5502
Local metabolites of healthy human brain measured with whole brain spectroscopic imaging and with single voxel spectroscopy - a study to compare different 1H-MRS data acquisitions and data analyses1Institute of Diagnostic and Interventional Neuroradiology, Hannover Medical School, Hannover, Germany, 2Department of Radiology, University of Miami School of Medicine, FL, United States
Synopsis
Local metabolite concentrations in 60 healthy volunteers were estimated from EPSI data that were analyzed from individual voxel measurements and using spectral integration over a ROI and compared to results from single-voxel acquisitions. Linear regression analysis was used to estimate age-dependence of metabolite concentrations obtained with each of the three different methods. The results were compared with each other for quantitative evaluation of EPSI acquisition at short TE for detection of brain metabolites.
Purpose
In
an earlier report, the relative metabolite ratios obtained using short TE whole
brain MR spectroscopic imaging (wbMRSI) of human brain, with data analysis
using the MIDAS program 1,
were compared with those obtained using Single-Voxel Spectroscopy (SVS) with data analysis using LCModel 2. In this
study, the wbMRSI and SVS acquisitions are compared using LCModel, with evaluation at three brain structures and
in a larger volunteer sample.Methods
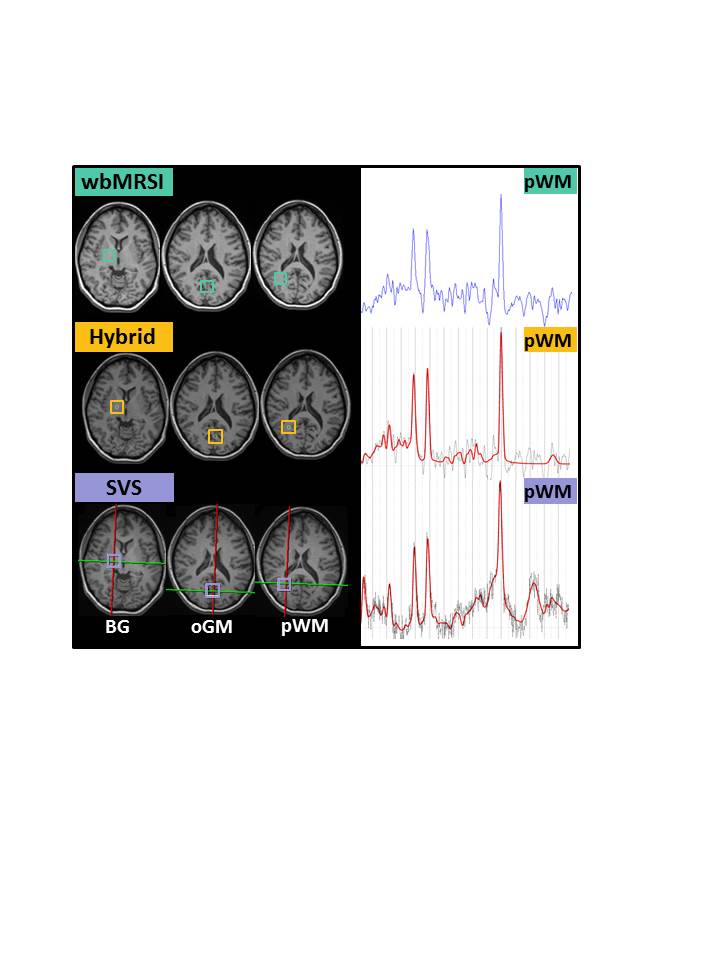
60 healthy volunteers aged between 20 and 70 years underwent MR examinations at 3T (Verio, Siemens, Erlangen) with a 12-channel phased-array head coil. The scan protocol included an EPSI (TR/TE = 1550/17.6 ms) acquisition over a field-of-view (FOV) of 280 x 280 x 180 mm with a scan time of 16 minutes 3; an axial T1-weighted 3D MPRAGE with the same angulation as that of EPSI; and three SVS using stimulated echo acquisition (TR/TE = 1550/20 ms, 192 acquisitions, voxel volume 4 ml, scan time 5 min.) at right parietal white matter (pWM), occipital gray matter (oGM), and basal ganglia (BG) (Fig.1). To obtain regional metabolite concentrations from the EPSI data two different methods were used: a) the wbMRSI data were analyzed using MIDAS to obtain brain metabolite maps, from which individual voxel results were averaged over the brain regions corresponding to each SVS measurement (wbMRSI method); b) the spectra from the wbMRSI measurement, after B0 field correction and phase correction, were integrated over each of the volumes corresponding to the SVS measurements and the result fitted using LCModel (hybrid method 4). The SVS data were also analyzed using LCModel to obtain relative concentrations of n-acetyl-aspartate (NAA), choline (Cho), total creatine (tCr), glutamine/glutamate (Glx), and myo-inositol (mI). Results were compared as ratios to tCr. The values were compared by using one-way analysis of variance (ANOVA) with Bonferroni corrected post hoc tests. Linear regression analyses were made to estimate age-dependence of the metabolite concentrations obtained with the three methods.Results/Discussion
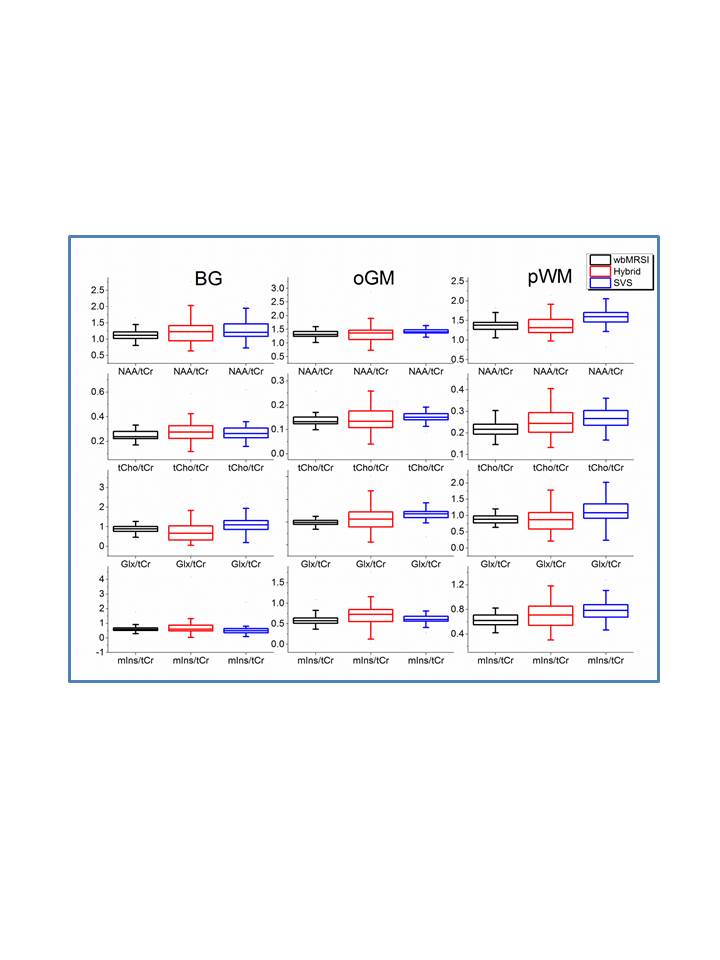
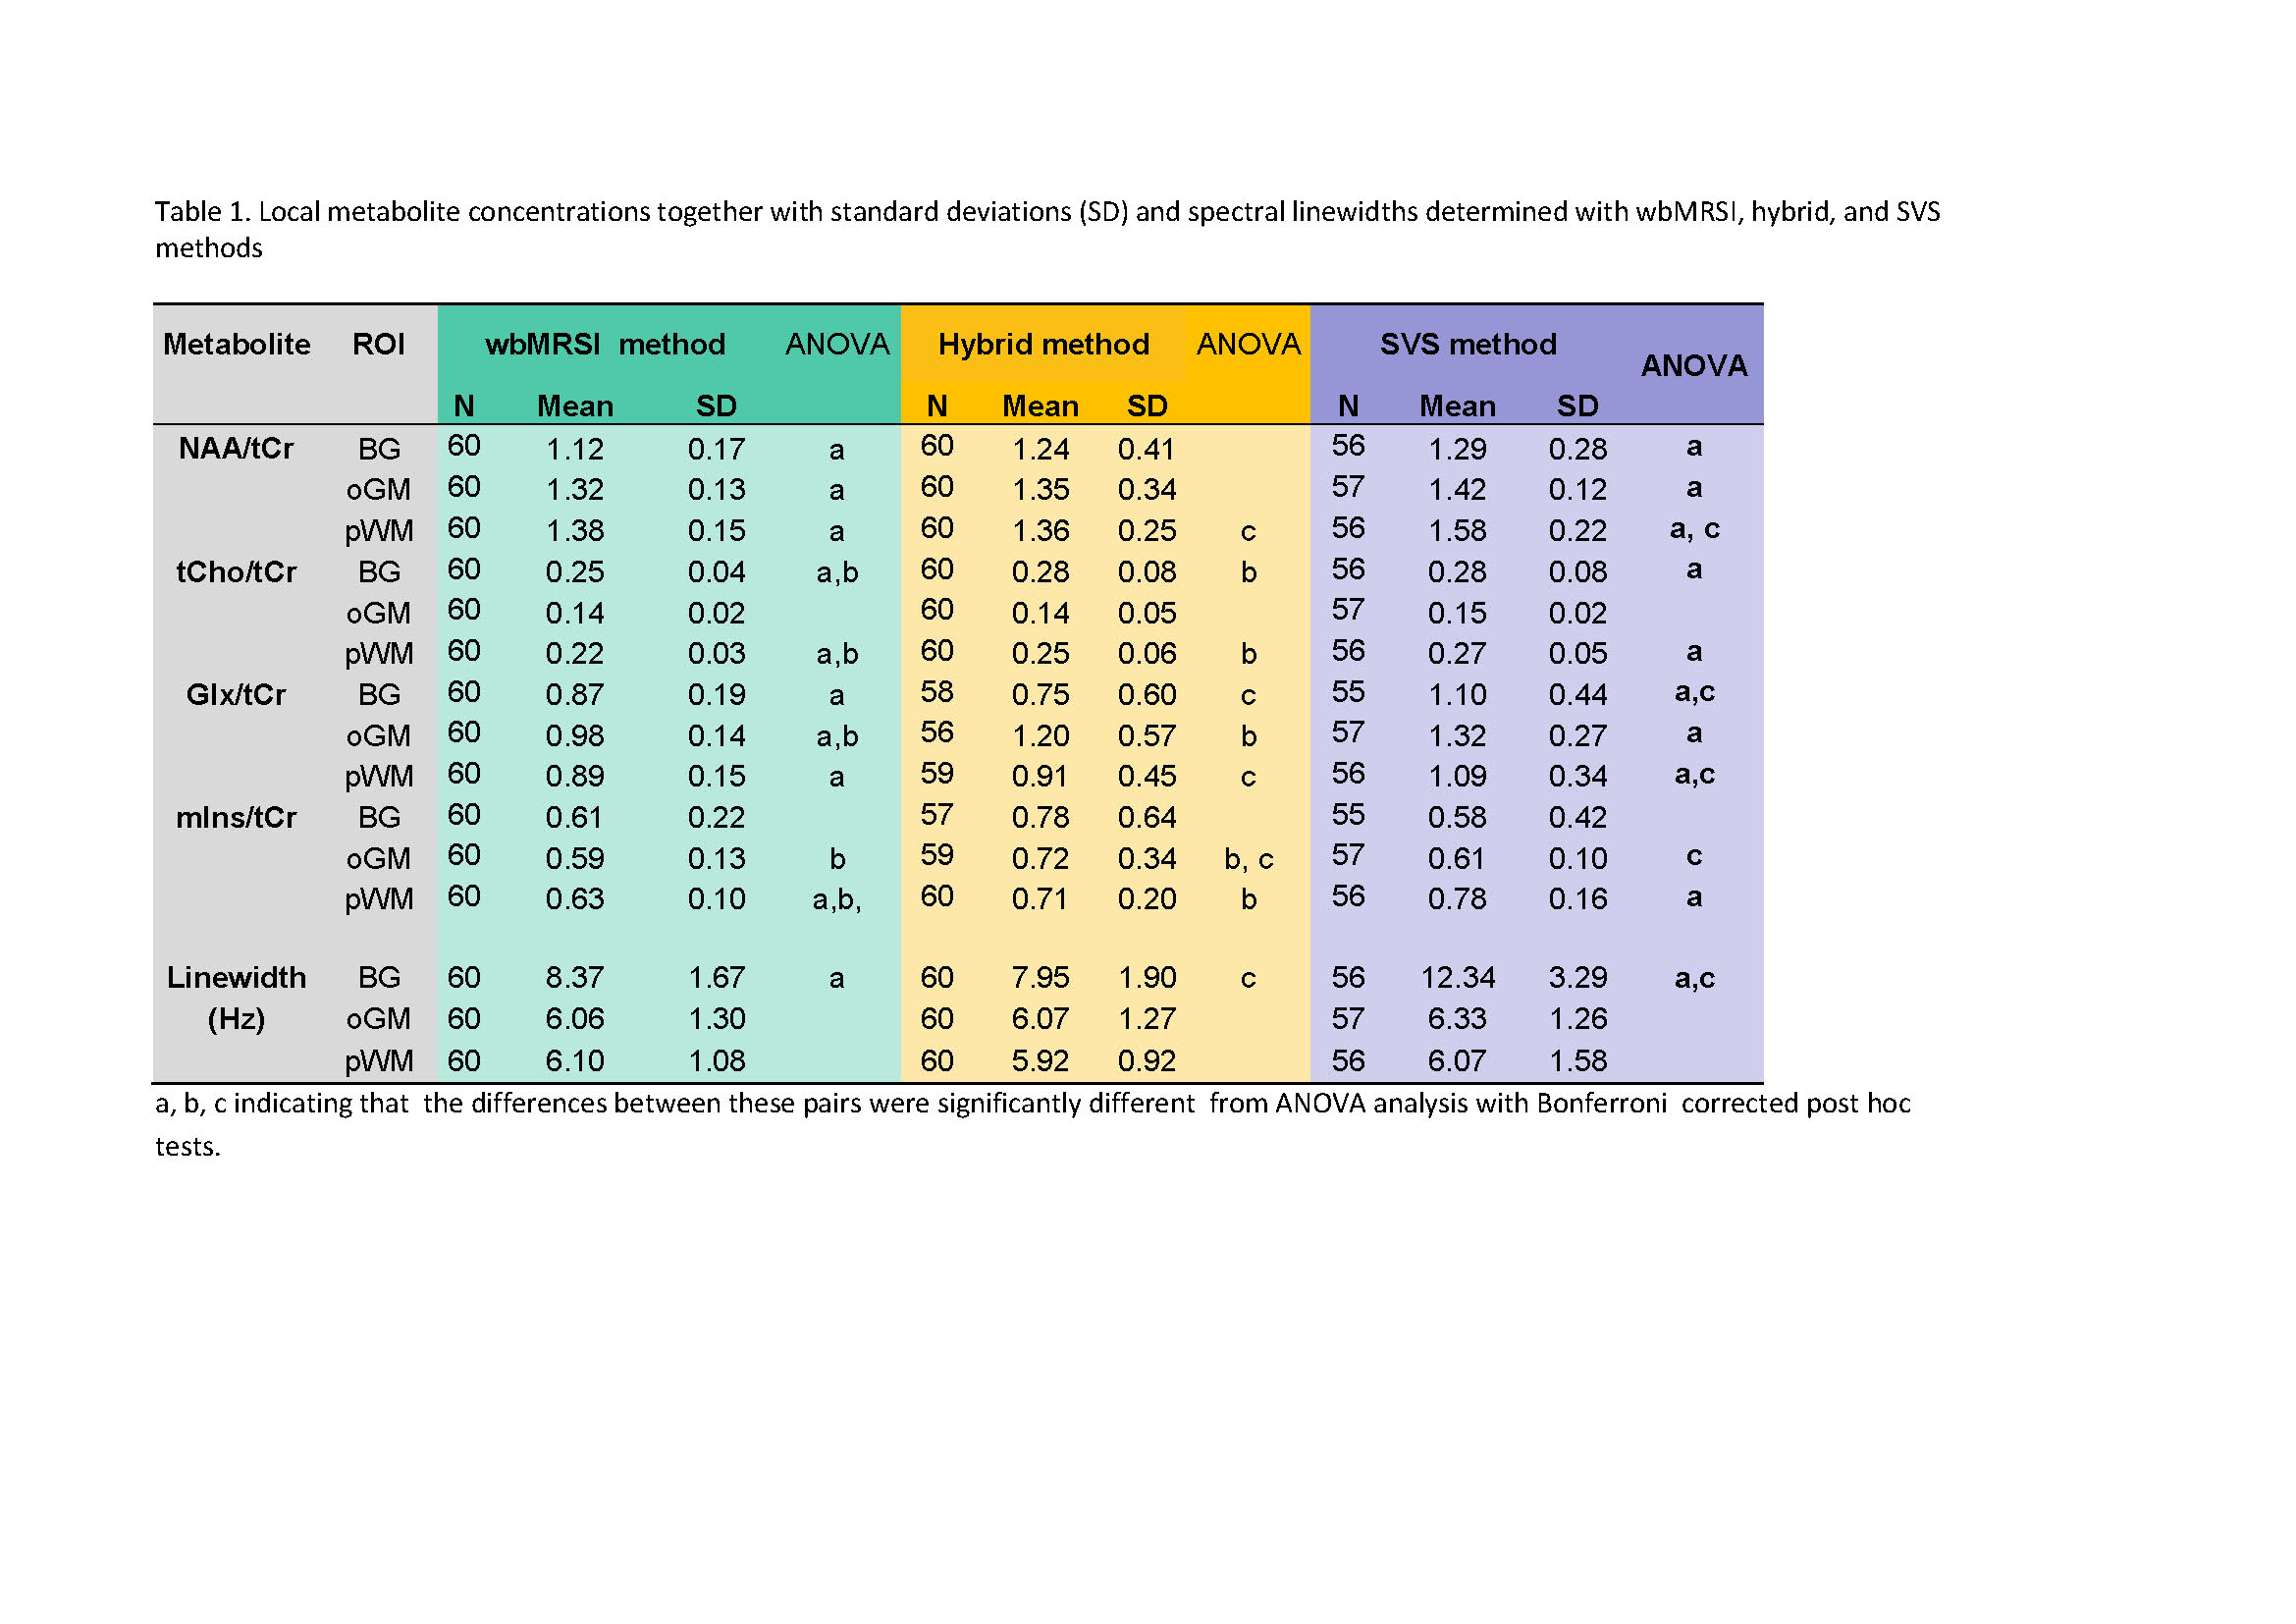
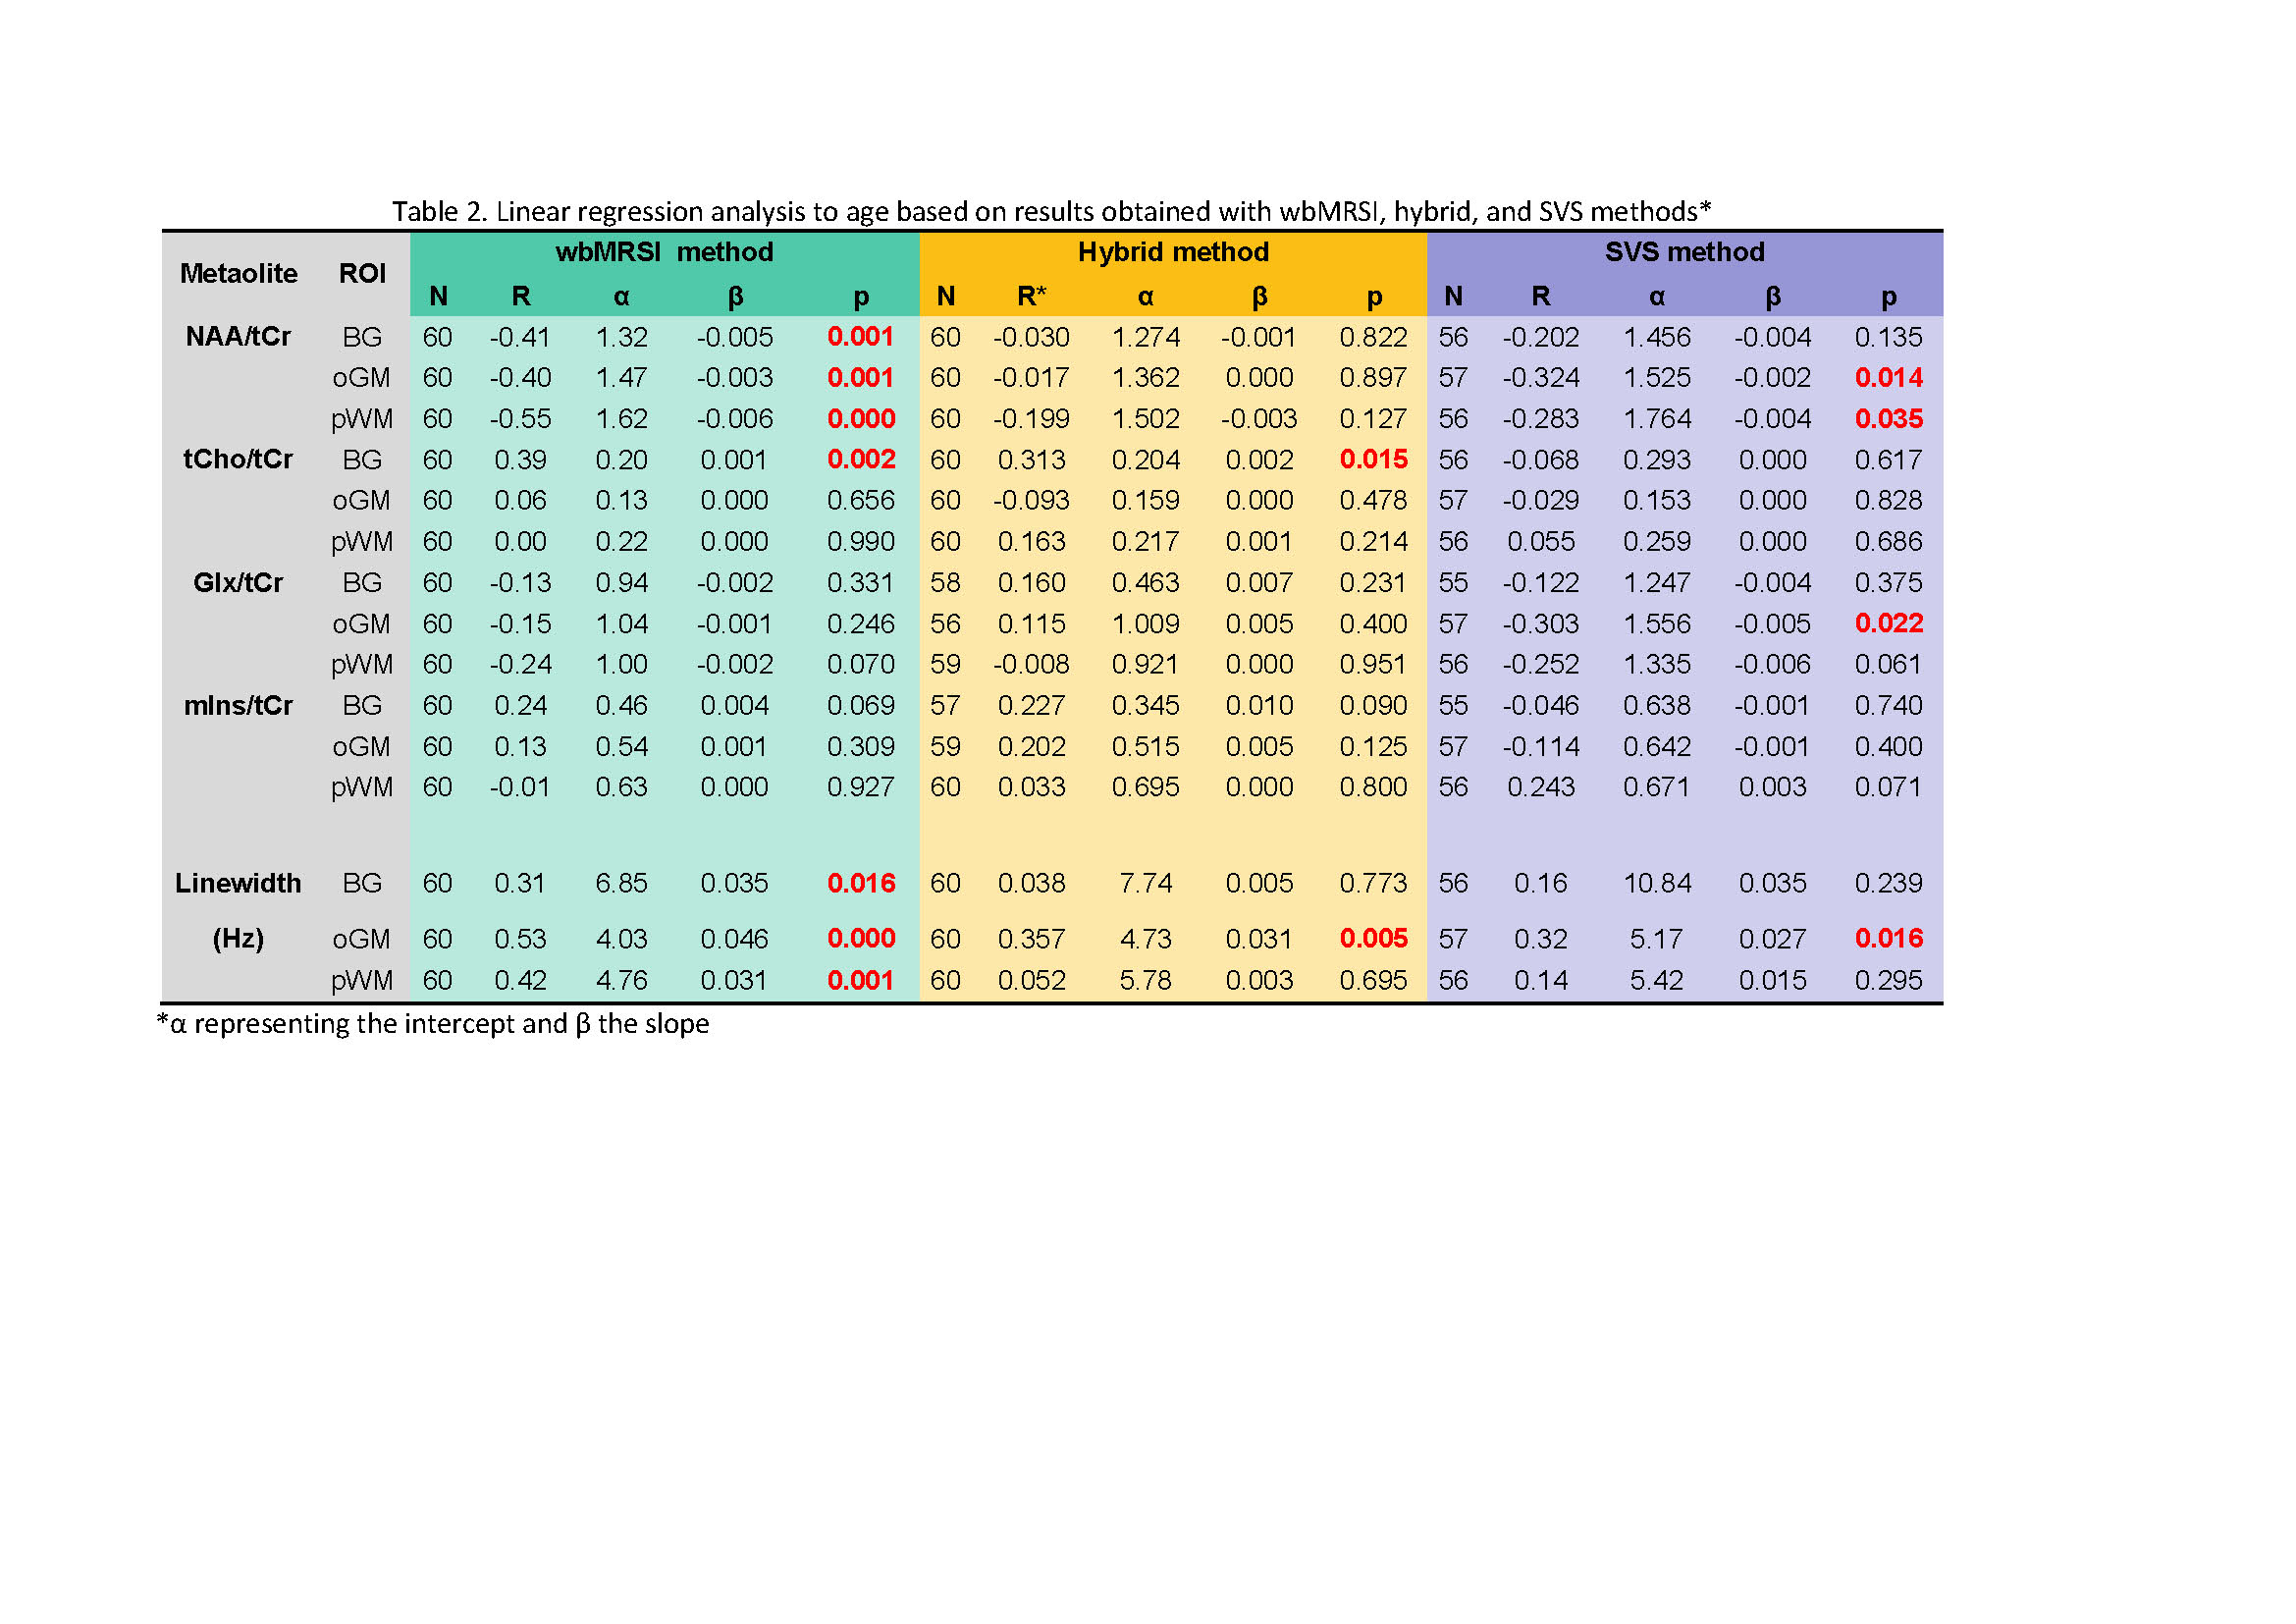
No statistically significant difference beween male and female subjects was found, thus the male and female data were combined for further analysis. Metabolite concentrations (in ratios to tCr) and the spectral linewidths with standard deviations (SD) determined with wbMRSI, hybrid, and SVS methods are given in Table 1, in which the results of ANOVA comparison were also included, and in Fig.2. The results of linear regression analysis are given in Table 2. At each of three brain structures, the mean concentrations (in ratios to tCr) derived from three methods were close to each other and showed similar relations between the metabolites (Fig.2), indicating that all the methods could be used reliably to measure local brain metabolites. Spectral linewidths, especially those in basal ganglia with more local field distortions, were narrower for wbMRSI (Table 1) due to the smaller nominal voxel size of the EPSI acquisition and application of B0 correction. Linear regression analysis revealed age-related decreases of NAA in all 3 ROIs measured with wbMRSI, but only in two ROIs measured with SVS (Table 2) – the reason could be the lower variance for NAA determined with wbMRSI (Fig.2, first box vs. third box in each). For the measured volume (4ml) the use of LCModel to fit the integrated spectra from EPSI data did not show benefits concerning the derived results. ANOVA comparison with Bonferroni corrected post hoc test revealed significant differences between individual metabolite concentrations measured with three different methods at each brain structure (Table 1), indicating that it is necessary for each acquisition technique to have its own reference for quantification purpose.Conclusion
Both short TE wbMRSI and SVS could be used to estimate local brain concentrations of NAA, Cho, tCr, mI, and Glx, with consistent results. By using the same TR and clinically acceptable scan times the wbMRSI method provided better spectral resolutions with narrower linewidth. Data with lower variance seems to benefit further data analysis.Acknowledgements
This work was supported by Deutsche Forschungsgemeinschaft and by NIH grant R01 EB016064 (A.A.M.).References
1. Ding XQ, Maudsley AA, Sabati M, Sheriff S, Dellani PR, Lanfermann H. Comparison of a short-TE whole brain MR spectroscopic imaging to single voxel spectroscopy for measurement of metabolite concentrations in human brain. Proceedings of the International Society of Magnetic Resonance in Medicine 2014, Milan 2014: 2901.
2. Provencher SW. Estimation of metabolite concentrations from localized in vivo proton NMR spectra. Magn Reson Med 1993; 30(6): 672-9.
3. Ding XQ, Maudsley AA, Sabati M, Sheriff S, Dellani PR, Lanfermann H. Reproducibility and reliability of short-TE whole-brain MR spectroscopic imaging of human brain at 3T. Magn Reson Med 2015; 73(3): 921-8.
4. Goryawala MZ, Sheriff S, Maudsley AA. Regional distributions of brain glutamate and glutamine in normal subjects. 2016; 29(8): 1108-16.
Figures