5499
MEGA-PRESS for simultaneous aspartate and glutamate quantification at 3T.1Semenov Institute of Chemical Physics, Russian Academy of Sciences, Moscow, Russian Federation, 2Clinical and Research Institute of Urgent Pediatric Surgery and Trauma, Moscow, Russian Federation
Synopsis
Direct Asp observation using PRESS, STEAM etc. in the human brain is strongly complicated by J-evolution and overlapping with other metabolites. In this work we have adjusted MEGA-PRESS for simultaneous Asp and Glu estimation. According to Vespa simulation as well as phantoms and in vivo studies TE=115ms was chosen as the best for Asp (2.65 and 2.80 ppm) and Glu (2.13 ppm) quantification without overlapping. Asp is the main precursor of neuronal marker NAA. NAA have been shown to be reduced in many disorders. Using this method allows accurate investigation of this important metabolic pathway.
Target audience:
MRI physicists, Clinical scientists, Neuroscientists.Introduction:
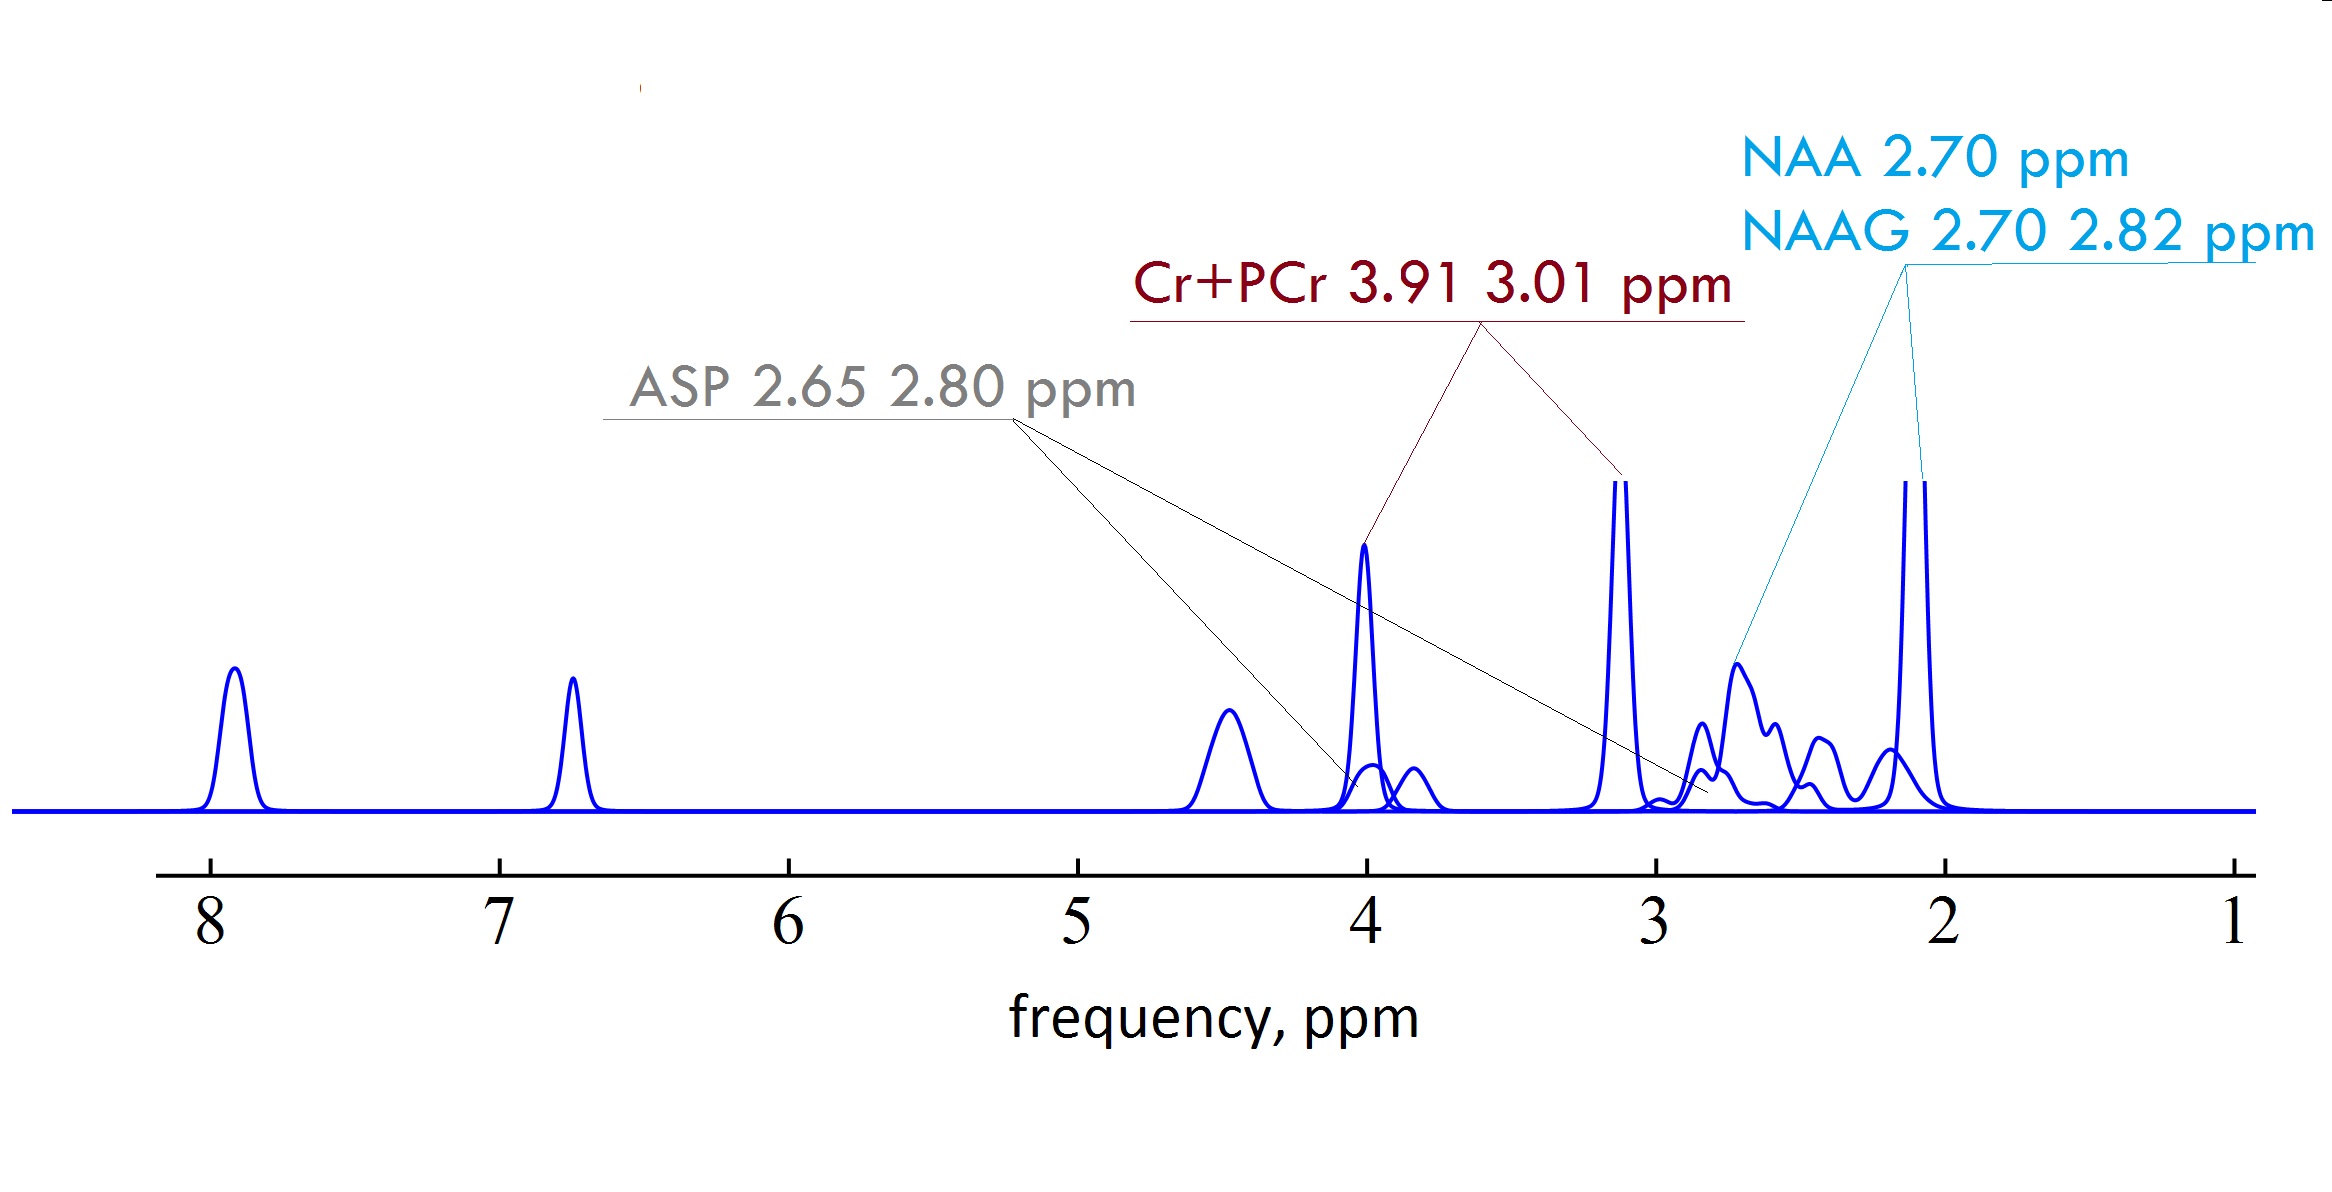
Aspartate (Asp) is an excitatory amino acid with cerebral concentration 1-2 mM/l. Asp structure is represented by an ABX pattern, however using a first order interpretation AMX is unlikely to lead to a substantial misinterpretation. Thus, 1H NMR spectrum of Asp contains doublet-of-doublets from the CH group at 3.89 ppm and coupled pair of doublets-of-doublets from the nonequivalent CH2 protons at 2.65 and 2.80 ppm1. Direct Asp observation using conventional localized methods like PRESS, STEAM etc. in the human brain is strongly complicated by J-evolution of these signals as well as by overlapping with other metabolites (Fig. 1). Spectral editing with MEGA-PRESS was previously shown to be effective for robust separation gamma-Aminobutyric acid (GABA)2, N-acetyl aspartyl glutamate (NAAG)3 and Gluthatione (GSH)4 from overlapping signals. The main purpose of this work was to adjust MEGA-PRESS for accurate Asp quantification.Methods:
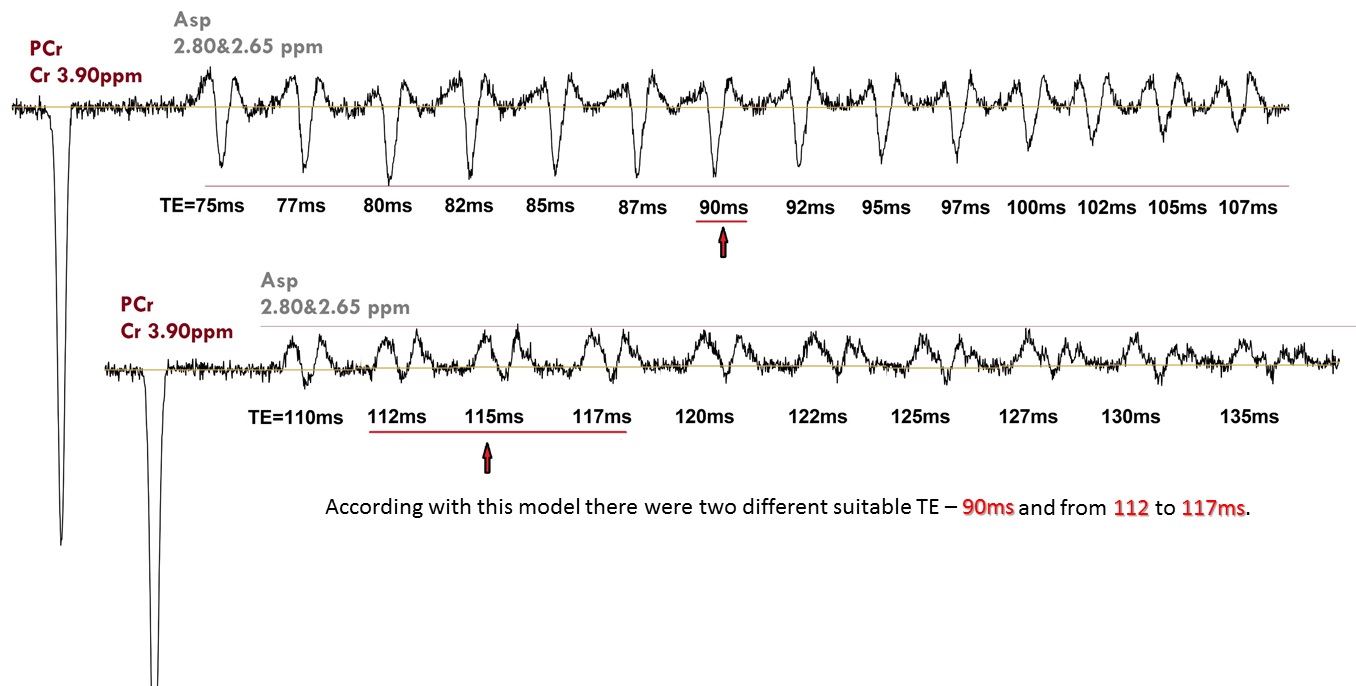
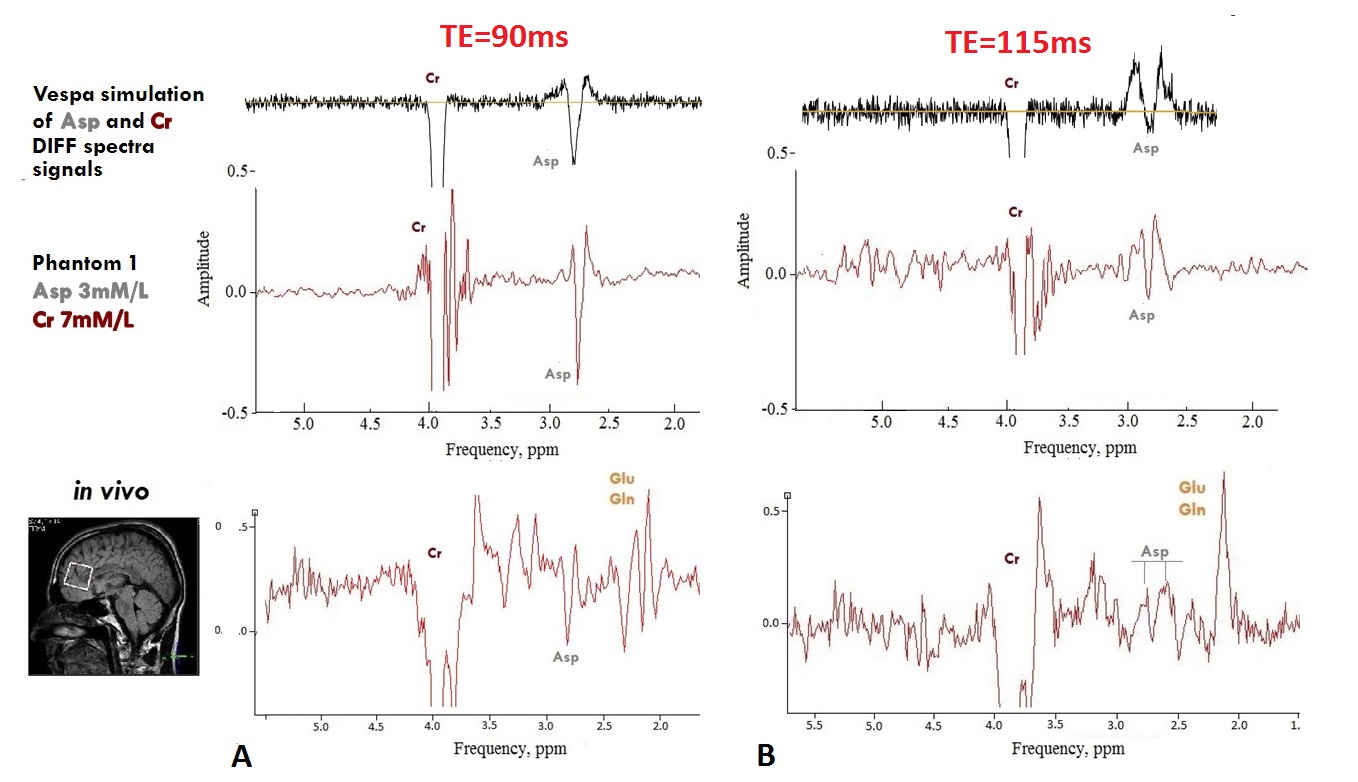
VESPA simulation of 2.65 and 2.80 ppm Asp signals with editing pulses at 3.89 ppm (“On-spectra”) and at 5.21 ppm (“Off-spectra”) was used to specify the best TE in the range from 75 to 135 ms. The phantoms spectra (phantom 1- Asp(3mM/l), Cr(7mM/l); phantom 2 - Glu(10mM/l), Cr(10mM/l); phantom 3 - Gln(10mM/l), Cr(10mM/l)) and In vivo spectra from frontal and parietal lobes of 7 healthy volunteers were acquired using MEGA-PRESS (TR=1900ms, NSA=8, 42 averages, VOI - 28×28×28mm) with TE=90ms (editing pulse length - 25 ms), and TE=115ms (editing pulse length - 40 ms). For quantification of Asp Amares algorithm in the jMrui 5.2 software was applied.
Results:
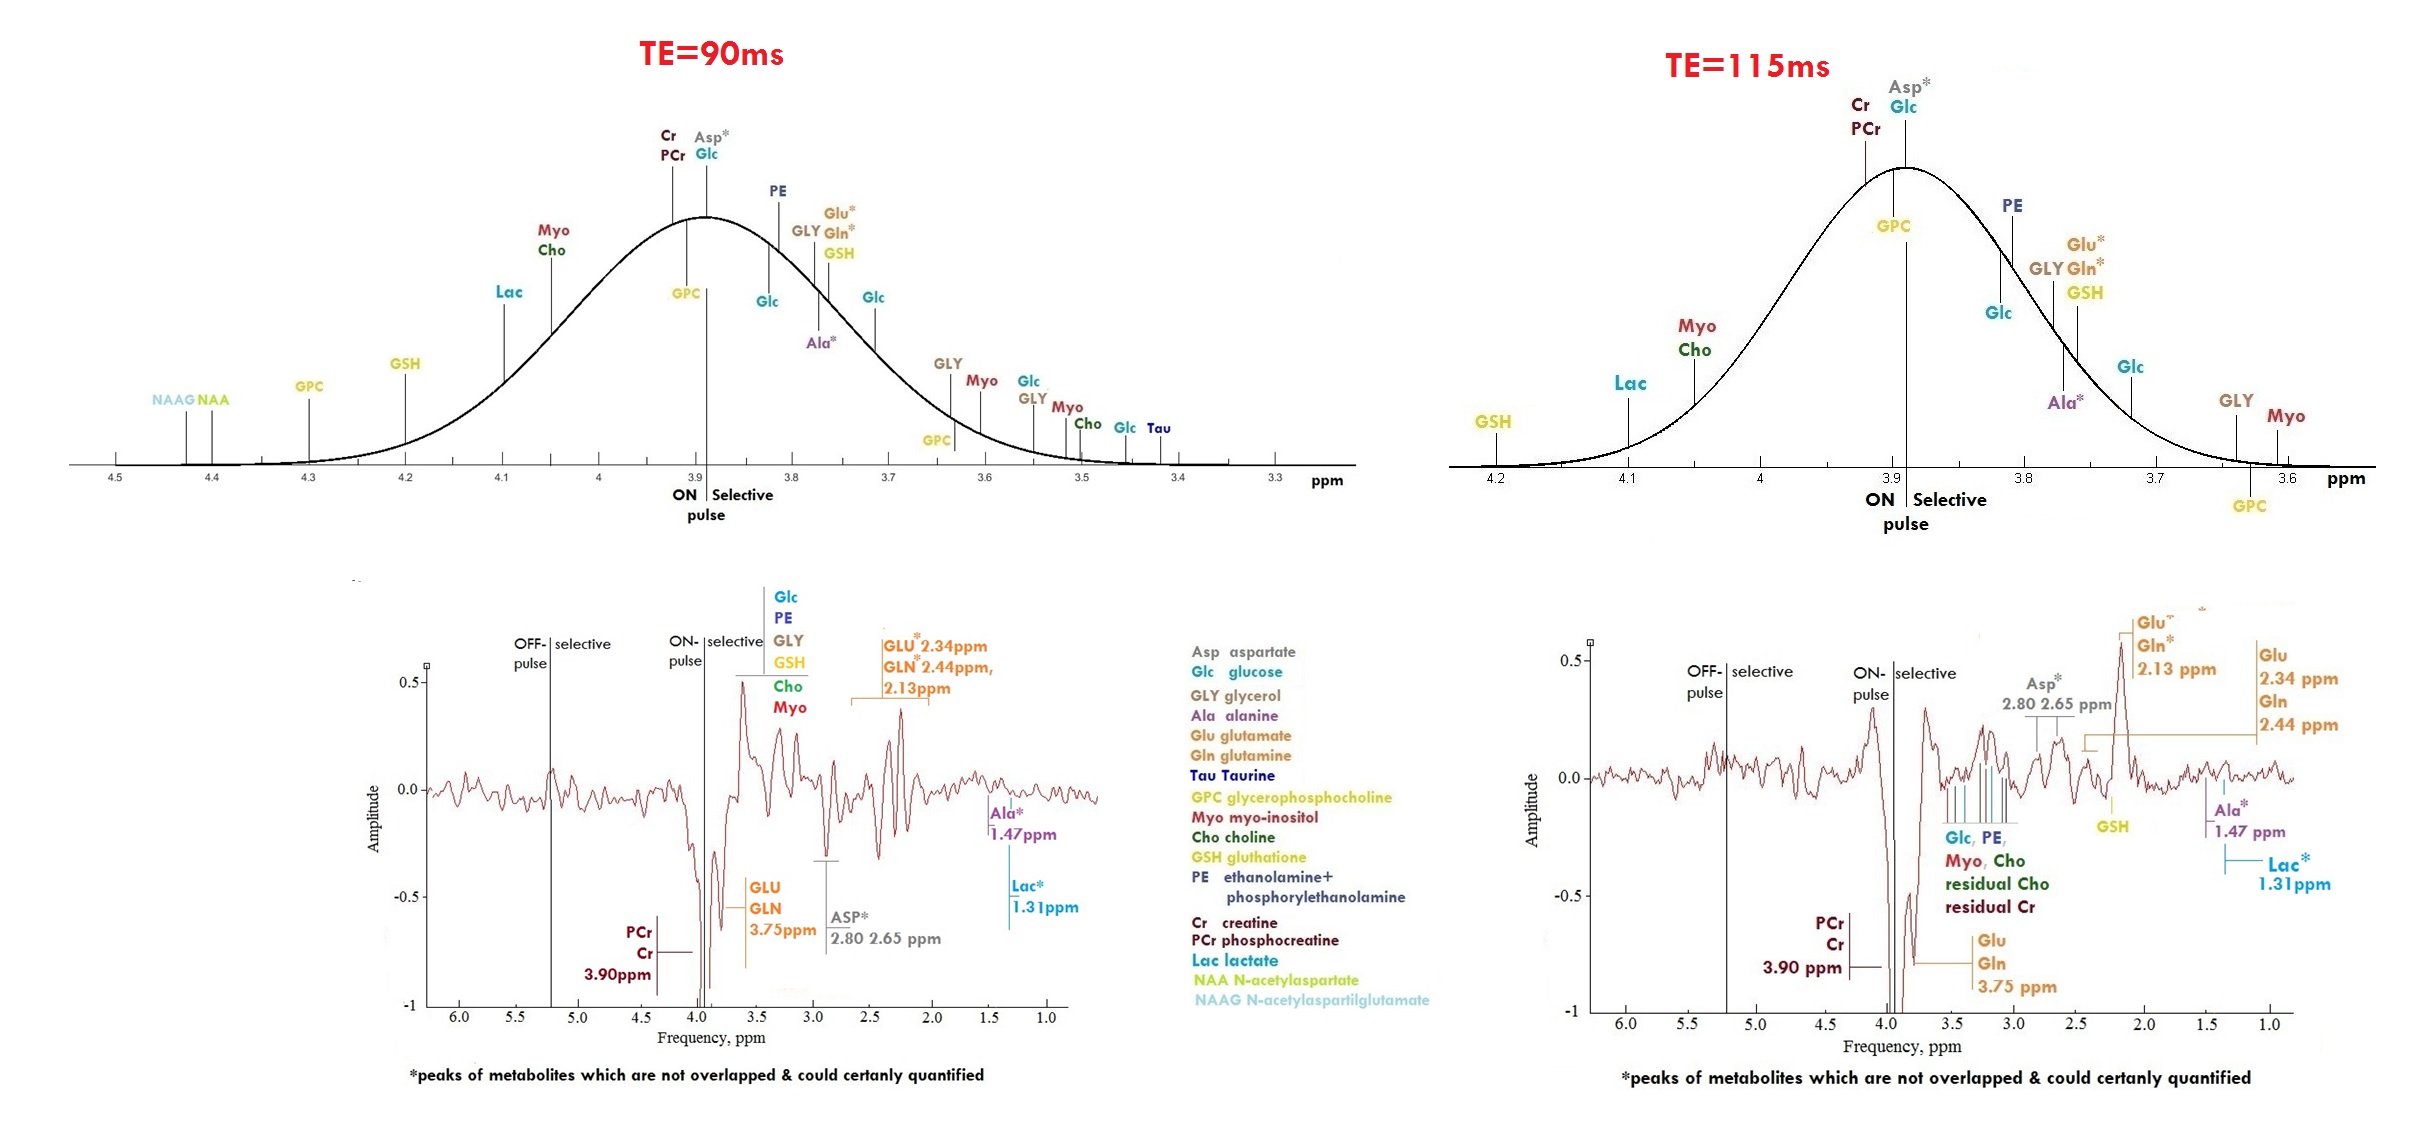
Fig.2. represents VESPA simulation of edited spectra (‘Diff-spectra’) for TE in the range from 75 to 135 ms which contain Asp (δ=2.65 and 2.80 ppm) and Cr (δ=3.89 ppm) as a reference. According with this model there are two suitable TE values – TE=90ms and TE in the interval from 112 to 117ms. Selectivity of editing pulses used with TE less than 90ms does not allow completely separate Asp signals at 2.80 & 2.65 ppm from NAA. There is a good agreement between simulated, phantom and in vivo spectra for TE=90 ms (Fig. 3A) as well as for TE=115ms (Fig.3B). Detailed analysis of coupled signals appeared in the edited spectra (Fig 4.) shows that Asp resonances at 2.80 & 2.65ppm are not overlapped with any metabolites for the both TE. Estimated Asp/Cr ratios was (11.1±1.2)×10-2 and (8.9±1.0)×10-2 in the frontal and parietal lobes respectively. For phantoms 2and 3 with equal content of Glu and Gln the value of Glu/Cr (0.69±0.07) was larger than those of Gln/Cr (0.38±0.05) for TE=115ms.Discussion:
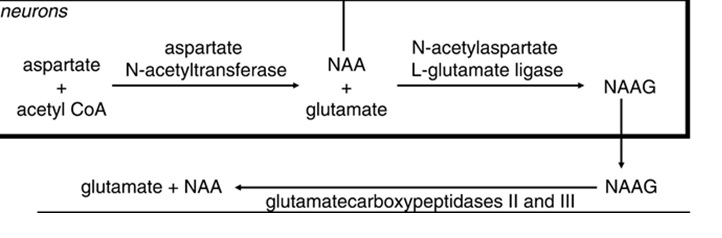
According to the simulation and in vivo data TE=90ms as well as TE =-115ms are suitable for Asp detection using MEGA-PRESS. However, there are some significant advantages for spectral editing if to use TE=115ms: 1) long editing pulses (40ms for TE=115ms compared to 25ms for TE=90ms) provide more editing selectivity and hence improve the quantification. 2) For TE=115ms the edited spectrum contains strong Glu+Gln (GLX) signal at 2.13 ppm (Fig. 2). According to preliminary phantom data this signal mainly contains Glu (about 80-90%). Thus changes in its intensity reflect chances in [Glu] with high precision. Quantitative data on Asp are important because of its function in the brain. At first, Asp is an excitatory neurotransmitter in the human central nervous system. It may be useful to investigate [Asp] alterations in various mental, neurodegenerative diseases etc. Secondary, Asp is the main precursor of neuronal marker N-acetylaspartate (NAA). [NAA] was shown to be altered in different pathologies. These alterations may be associated with disturbances in NAA synthesis. Quantification of Asp allows starting in vivo investigation of this metabolic pathway. Additionally simultaneous quantification of Asp, Glu, NAA, NAAG will allow one to explore the long chain of biochemical transformations in human brain in vivo (Fig.5).Conclusion:
In this study we have shown accurate simultaneous quantification of cerebral Asp and Glu with MEGA-PRESS. Highlighted capabilities for investigations using this method seem to be very useful and interesting for biochemical and clinical studies of human brain in vivo.Acknowledgements
No acknowledgement found.References
1. Govindaraju V, Young K, Maudsley A, Proton NMR chemical shifts and coupling constants for brain metabolites. NMR Biomed. 2000; 13:129-153.
2. Mesher M, Merkle H, Kirsch J, et al. Simultaneous in vivo spectral editing and water suppression. NMR Biomed. 1998; 11(6):266-272.
3. Landim RC, Edden RA, Foerster B, et al. Investigation of NAA and NAAG dynamics underlying visual stimulation using MEGA-PRESS in a functional MRS experiment. Magn Reson Imaging. 2016;34(3):239-245.
4. Saleha M, Oeltzschnera G, Chana K, Puts N, et al. Simultaneous edited MRS of GABA and glutathione. Neuroimage. 2016; 142:576-582
Figures