5498
Investigating the effect of phase cycling schemes on GABA-edited spectroscopy using MEGA-PRESS1Department of Electronic and Computer Engineering, National Taiwan University of Science and Technology, Taipei, Taiwan, 2Department of Computer Science and Engineering, National Sun Yat-sen University, Kaohsiung, Taiwan, 3Research Center for Mind, Brain and Learning, National Chengchi University, Taipei, Taiwan
Synopsis
The application of phase cycling scheme in combination with interleaved off-odd switch has been suggested for MEGA-PRESS method in many previous reports but the effect of phase cycling schemes on the spectral shape of GABA peak and on the GABA quantification has not been studied yet. Here, performance of phase cycling by different number of steps were and by modified interleaved scheme were compared. The results show that phase cycling is necessary to be applied prior interleaved on-off switch and minimum shape cycling steps are suggested to minimize subtraction artifacts possibly resulting from on-off frequency drift and motion.
Introduction
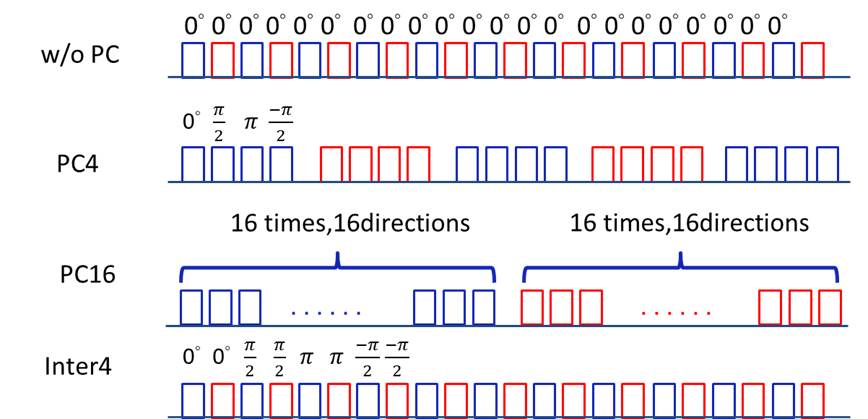
MEGA-PRESS as the most widely used MRS technique to quantity GABA (γ-Aminobutyric acid) in human brain consists of edit on and edit off scan usually acquired in interleaved mode to minimize subtraction artifacts resulting from potential frequency drift1,2. To improve the GABA peak on the edit spectra, phase cycling of 2 to 16 steps has been suggested be applied prior interleaved edit on and edit off loop at the cost of lower time resolution of on-off data2 and subtraction artifacts due to motion and frequency drift between on-off data. In this study, we investigate the performance of GABA quantification using different number of phase cycling steps. Further, an interleaved phase cycling scheme which implements phase cycling without compromise in temporal resolution for MEGA-PRESS method is used. We compared the spectra shape of GABA on the edit spectrum and performance of GABA quantification for different phase cycling schemes.Methods
Six healthy subjects were scanned on a 3T MR system (Skyra, Siemens Medical Solutions) with a 32-channel head coil. MRS spectra were collected using MEGA-PRESS sequence with scanning parameters: TR/TE = 2000 ms/68 ms., samples = 2048, bandwidth = 2000Hz, measurement =256. MRS data were acquired in dorsal lateral prefrontal cortex (DLPFC) using volume of interest = 25x30x20mm3. For each subject, MRS data were collected using 4 phase cycles schemes (Figure 1): without phase cycling (w/o PC), with four steps phase cycling (PC4), with sixteen steps phase cycling (PC16), and four steps phase cycling with interleaved loop prior phase cycling step (Inter4). All MRS data were phase and frequency corrected based on information from Creatine (Cr) peak on the edit off spectra using pair-wise correction1,3. GABA signal is quantified using Gaussian fitting and concentrations were calibrated by water and Cr signal3. Fitting errors were defined as standard deviation of the fitting residual divided by the amplitude of the fitted peak.Results
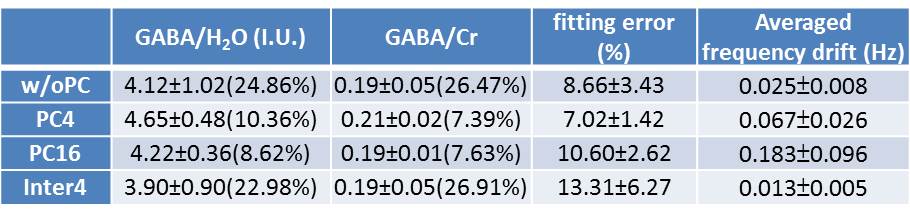
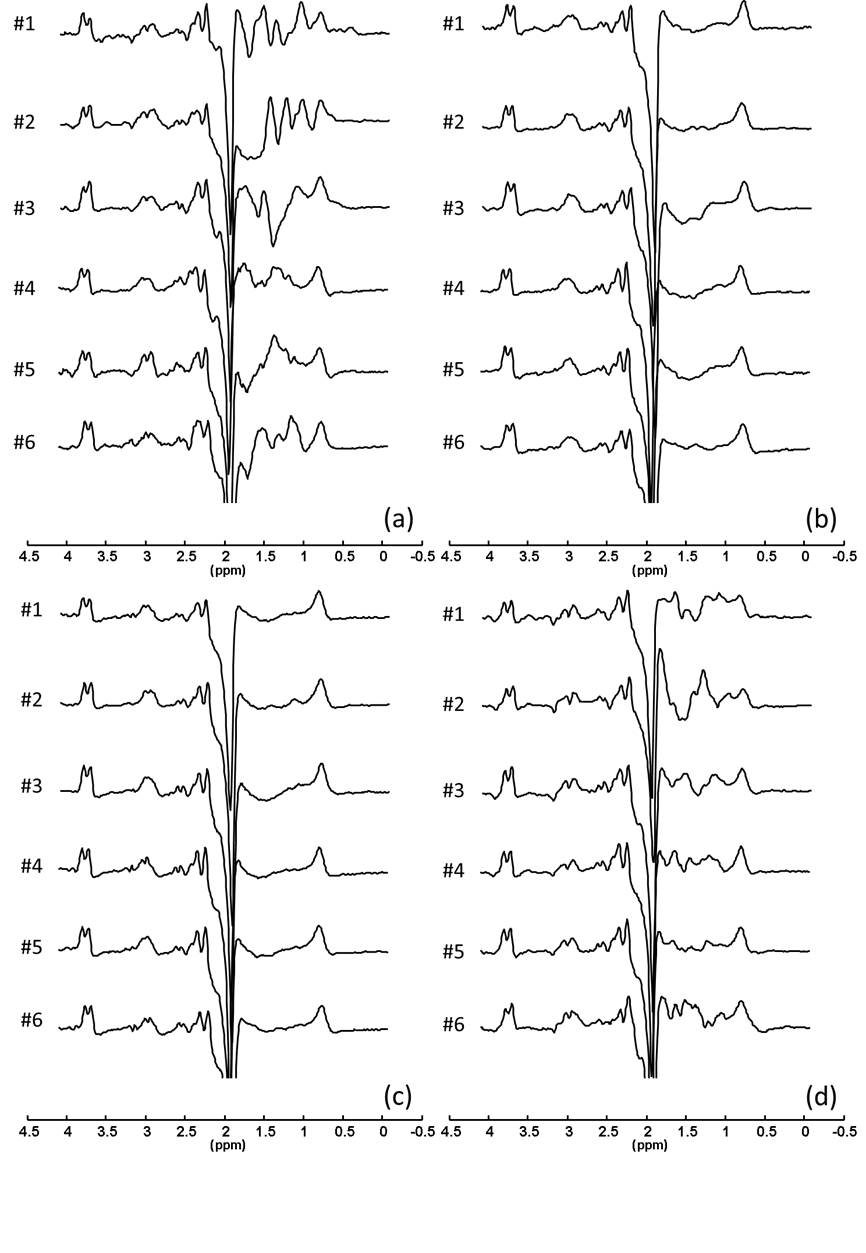
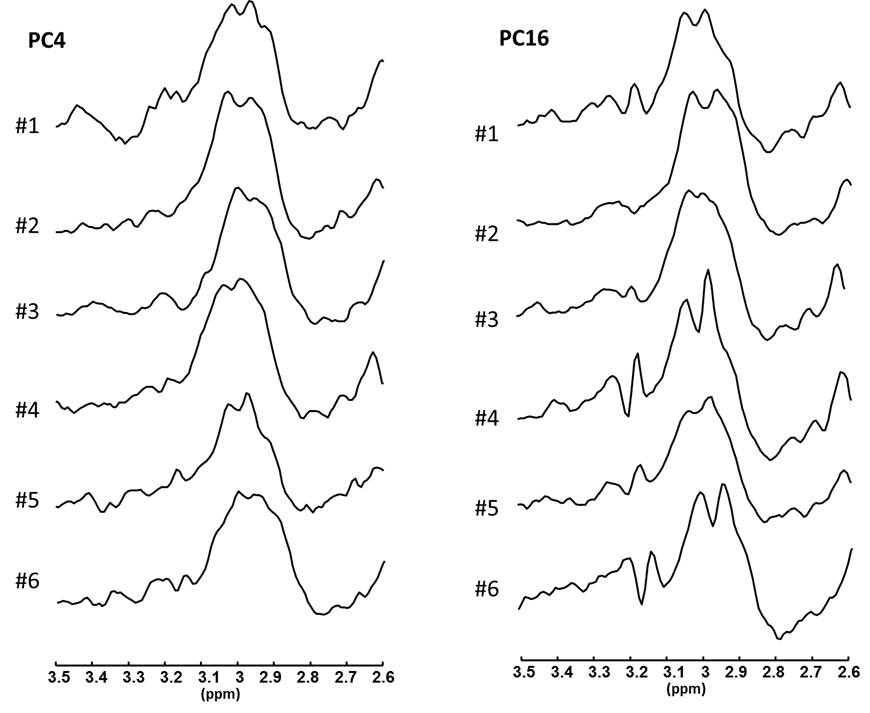
Edited spectra of four phase cycling schemes were shown in figure 2. The MM peak at 0.89 ppm can be clearly identified in PC4 and PC16 but no in w/o PC and Inter4 due to baseline fluctuations at this spectral range. For qualitative evaluation of spectral shape of GABA peaks at 3.0 ppm, the edited spectra in the spectral range of 2.6 – 3.5 ppm from all subjects from PC4 and PC16 data sets are shown in Figure 3. Instead of smooth signal at plateau of GABA peaks, there are ripples presented as split of small peaks at the center of GABA (3.0 ppm) and side of GABA peaks (3.1 to 3.3 ppm) found in 2subjects of PC16 data sets. Quantitative results were shown in table1. The GABA concentrations and GABA to Cr ratio are at similar levels for PC4 and PC16 and the between subject variance of PC4 and PC16 (7%~10.5%) are less than those of w/o PC and Inter4 (22%~27%). Among 4 phase cycling schemes, PC4 showed least fitting errors (7%~9%). The FWHM of Cr is range between 6.77 to 6.95 Hz, which indicates that the MRS data are collected at controlled field homogeneity. The frequency drifts for all data sets are less than 7Hz for 8.5 minutes MRS scan. The averaged frequency drift (table 1) indicate that increased time resolution in 16 phase cycling steps can lead to higher frequency drift between on-off scan.Discussions and Conclusions
In conclusions, our results showed that phase cycling is necessary to avoid baseline fluctuation in the edited spectrum and to ensure stable GABA shape. However, the applying of phase cycling across editing pulse interleaved seems ineffective. Furthermore, stable GABA peaks can be derived on edited spectrum with both 4 and 16 steps, but phase cycling of 16 steps are subject to larger frequency drift between edit-on and edit-off spectrum, which may result in subtraction artifacts on the GABA shape. Therefore, minimum shape cycling steps are suggested to minimize subtraction artifacts possibly resulting from on-off frequency drift and motion.Acknowledgements
No acknowledgement found.References
1.Ashley D. Harris .et al, Impact of frequency drift on Gamma-Aminobutyric acid-edited MR Spectroscopy. Magnetic Resonance in Medicine. 2014;72:941–948
2.Paul G. Mullins .et al, Current practice in the use of MEGA-PRESS spectroscopy for the detection of GABA. NeuroImage 2014;86: 43–52
3.Shang-Yueh Tsai, Chun-Hao Fang, Thai-Yu Wu, Yi-Ru Lin. Effects of Frequency Drift on the Quantification of Gamma-Aminobutyric Acid Using MEGA-PRES. Scientific Reports. 2016 Apr 15;6:24564. doi: 10.1038/srep24564.
Figures