5497
J-difference editing of Creatine in the human brain1Biomedical Engineering, Johns Hopkins School of Medicine, Baltimore, MD, United States, 2Russell H. Morgan Department of Radiology and Radiological Science, Johns Hopkins School of Medicine, Baltimore, MD, United States, 3F. M. Kirby Research Center for Functional Brain Imaging, Kennedy Krieger Institute, Baltimore, MD, United States
Synopsis
In in vivo proton spectra, Creatine (Cr) and phosphocreatine are usually regarded as non-coupled spin systems (1). This abstract reports on the observation of a small coupling between the creatine CH2 (3.91 ppm) and CH3 (3.02 ppm) groups. A series of J-difference edited experiments were performed both in a phantom and in the human brain to demonstrate that a coupling exists. This coupling was found to have a coupling constant of 0.28 Hz in an isotropic phantom and an even greater coupling in a white matter region.
Purpose
In in vivo proton spectra, Creatine (Cr) and phosphocreatine are usually regarded as non-coupled spin systems (1). This abstract reports on the observation of a small coupling between the creatine CH2 (3.91 ppm) and CH3 (3.02 ppm) groups. A series of J-difference edited experiments were performed both in a phantom and in the human brain to demonstrate that a coupling exists, and that is may result in creatine signals occurring in edited spectra in vivo.Methods
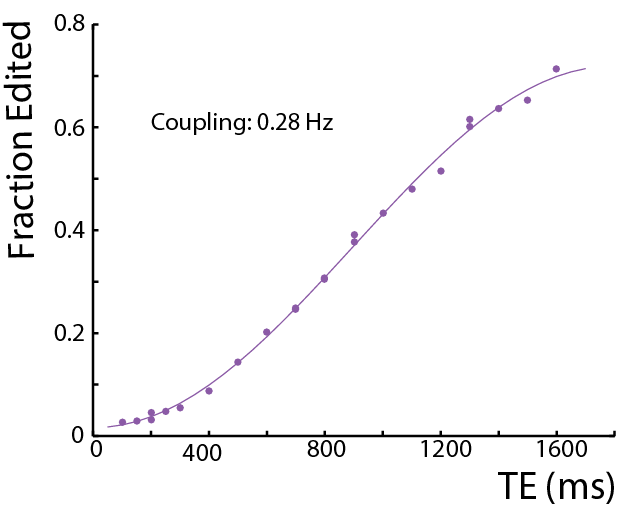
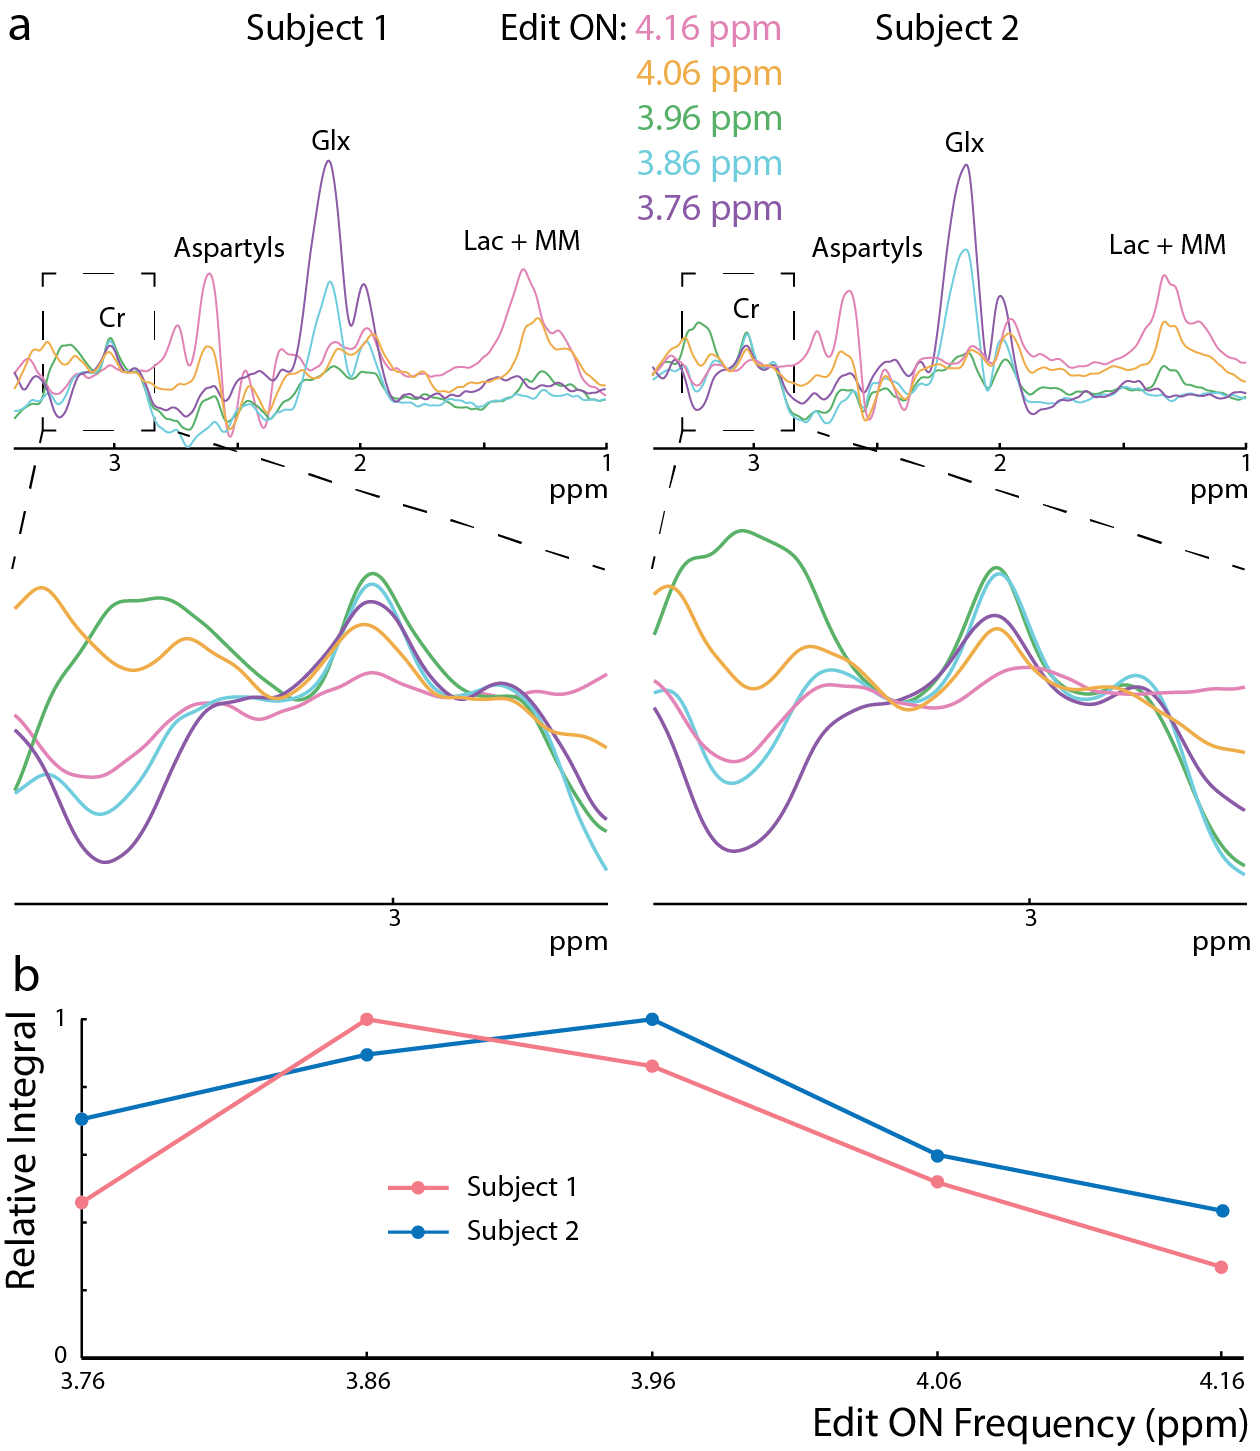
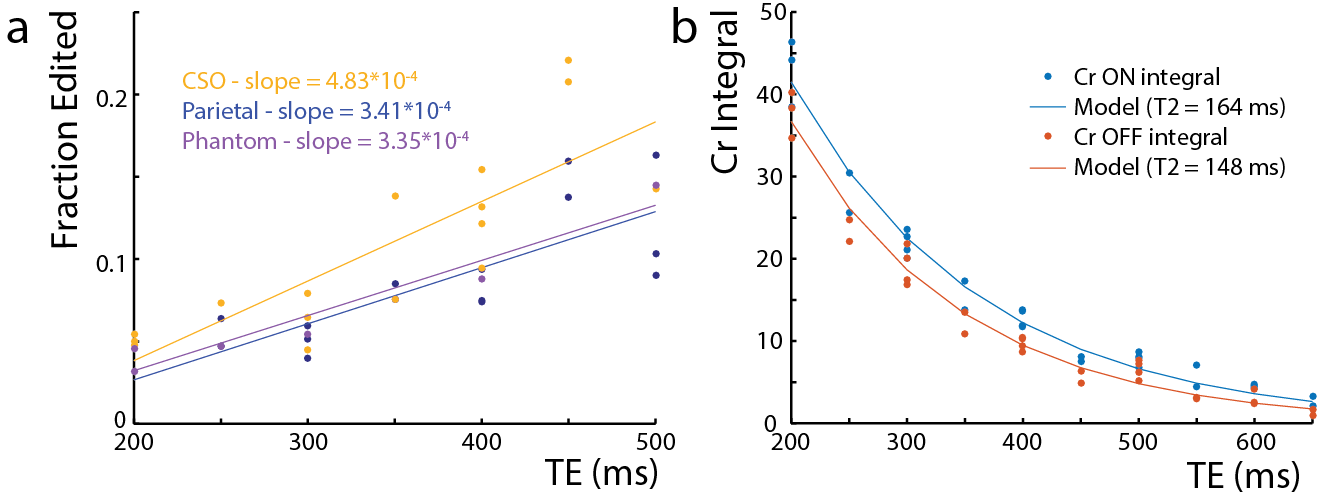
All experiments were performed on a Philips Achieva 3T scanner. To estimate the coupling constant (J) between the Cr CH2 and CH3 resonances, a series of MEGA-PRESS2 experiments with the edit-ON pulse applied at 3.91 ppm were performed at TE 100-1800 ms in a 50 mM Cr phantom. The voxel size was (2.7 cm)3, and 45 ms sinc-Gaussian editing pulses were used. The difference spectra were frequency-corrected to the residual water signal and normalized by the integral of the ON Cr signal. The 3.0 ppm Cr peak in the difference spectra was fit with a Lorentzian function and the peak area modeled as . To investigate whether Cr can be edited in vivo, MEGA-PRESS experiments with editing pulse frequency offsets 3.76-4.16 ppm (bracketing the 3.91 ppm Cr resonance) were performed in two subjects (1 female; ages 23/24) in a (4 cm)3 midline parietal region with 320 signal averages, TR=2s, TE=140 ms, and VAPOR water suppression. In addition, the magnitude of the edited Cr signal and its TE-dependence was investigated in centrum semiovale (CSO) white matter (a 6.5x2x3 cm3 voxel centered on the cortical spinal tract) and parietal gray matter ((4 cm) 3 (Par)). 5 subjects, (Par: 3 female, 26 ± 3 years, CSO: 4 female, 24 ± 4 years) were scanned, with TE = 200-500ms, ON 3.91 ppm, 320 signal averages, and TR=2 s. The Cr T2 was estimated with an exponential fit to both the ON and the OFF TE-modulated integrals in the CSO. The same MEGA-PRESS sequence as in the phantom was performed in 7 subjects (3 female, age 26 ± 3 years), with the parameters: TR=1.6s, TE=180 ms, 320 averages (Par), and 640 averages (CSO).Results
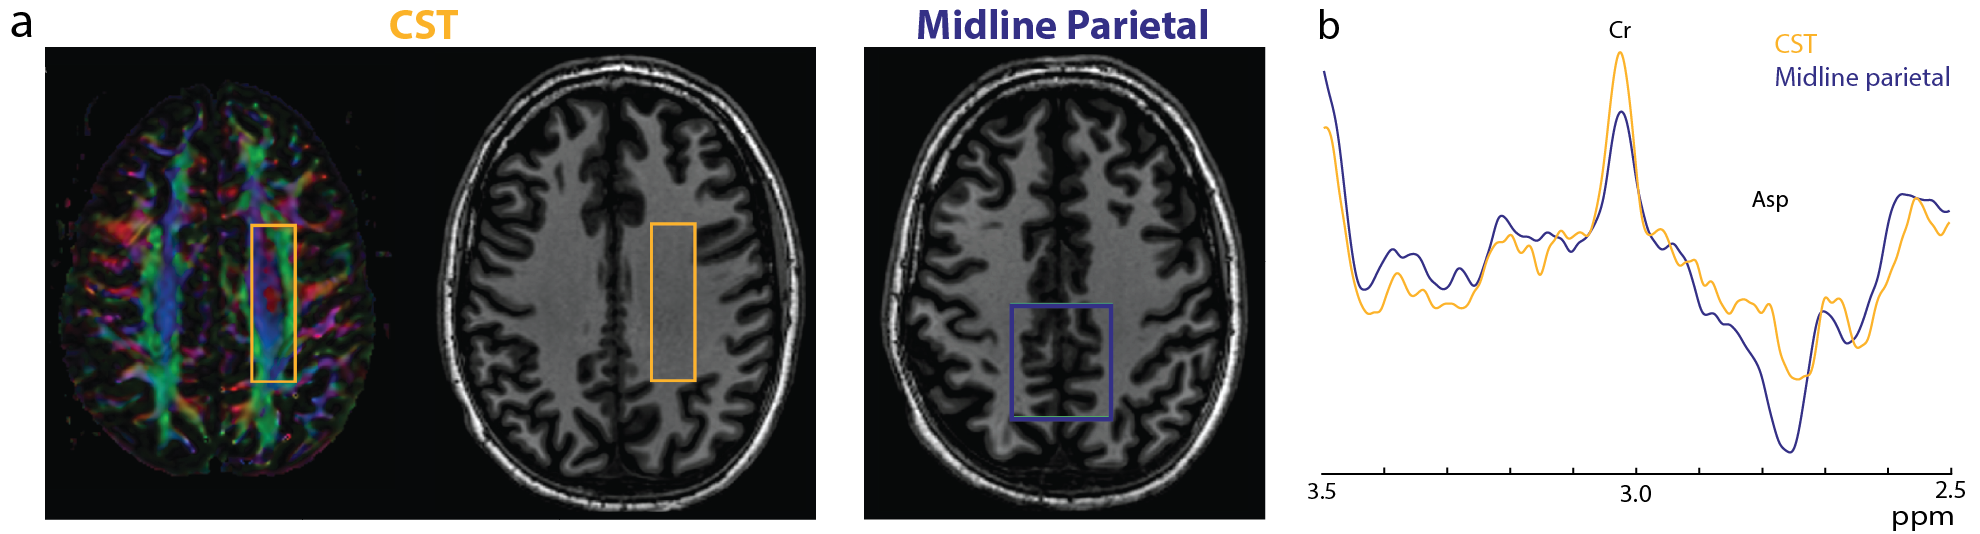
In the phantom (Figure 1), the signal varies as a sine-squared function of TE corresponding to an estimated J = 0.28 Hz. In vivo in the brain, a small edited signal attributable to Cr at 3.02 ppm was also observed in MEGA-PRESS difference spectra, with a maximum amplitude when the editing pulse is applied on resonance with the Cr CH2 peak at 3.91 ppm (Figure 2). The fraction of the Cr signal edited increased as a function of TE (Figure 3a) increased from TE 200 up to 500 ms in both GM and WM voxels, indicating that a small coupling exists. The edited signal is 1.44 times larger in the more anisotropic WM region (CSO). Figure 3b shows the ‘ON’ and ‘OFF’ peak areas as a function of TE in the range 200-650 ms; Cr T2 was estimated to be 164 ms in the ON spectra and 148 ms in the OFF spectra. Figure 4a shows example voxel placements while Figure 4b shows representative spectra showing ~50% more edited Cr in the predominantly WM CST voxel (mean increase 60%; p<0.05 across the 7 subjects).Discussion
It is demonstrated that a small J-coupling exists between Cr resonances at 3.9 and 3.0 ppm; this coupling is rarely observed in conventional MRS since it is much smaller than the linewidth attainable either in vivo or (usually) in phantoms. Cross-peaks have been observed in 2D correlation spectra and attributed to this coupling, however (3). Because of this small coupling, a 3.0 ppm peak may appear in J-difference editing when the editing pulses are placed near to 3.9 ppm, and it may be necessary to add Cr to a basis set to fit such spectra (e.g. in the case of editing glutathione, for instance). It is also curious that the magnitude of this coupling appears to be larger in WM than GM; the origin of this is unclear, but one possibility might be the existence of residual dipolar couplings that are known to be present in Cr in other anisotropic environments (such as muscle fibers (4)).Acknowledgements
This work was supported by NIH R01 EB016089 and P41 EB015909.References
1. Govindaraju V, Young K, Maudsley AA. Proton NMR chemical shifts and coupling constants for brain metabolites. NMR Biomed 2000;13:129–53.
2. Mescher M, Merkle H, Kirsch J, Garwood M, Gruetter R. Simultaneous in vivo spectral editing and water suppression. NMR Biomed 1998;11:266–272.
3. Albert Thomas M, Yue K, Binesh N, Davanzo P, Kumar A, Siegel B, Frye M, Curran J, Lufkin R, Martin P, Guze B. Localized two-dimensional shift correlated MR spectroscopy of human brain. Magn Reson Med 2001;46:58–67.
4. Boesch C, Kreis R. Dipolar coupling and ordering effects observed in magnetic resonance spectra of skeletal muscle. NMR Biomed 2001;14:140–148.
Figures