5494
The use of MEGA-sLASER with J-refocusing echo time extension to measure the proton T2 of lactate in healthy human brain at 7 T1Sir Peter Mansfield Imaging Centre, University of Nottingham, Nottingham, United Kingdom
Synopsis
The challenges in T2 measurement of lactate (Lac) in healthy brain tissue include J-modulation, signal overlaps and low concentration. To overcome these and characterize Lac T2 relaxation in normal brain tissue at 7T (for the first time), this study used a MEGA-sLASER sequence with J-refocusing echo time extension. The measured T2 value of Lac was 182±10 ms in healthy human brain (occipital lobe), which can be used for absolute quantification of Lac. The measured T2 of NAA (169±8 ms) agrees with previous 7T reports. With high sensitivity, this approach showed its potential in detecting changes in Lac T2 in pathology.
Introduction
Lactate (Lac) has raised a lot of interest over the past three decades for its particular role in brain energetics. For absolute quantification of Lac concentration, T2 relaxation decay must be taken into account for scans with long echo times (e.g. TE=144ms commonly used). However, limited information on proton T2 values of Lac is available1, especially for normal brain tissue, due to the difficulties caused by low concentration, signal overlaps and J-modulation. A promising strategy for T2 measurement of coupled spin systems is to refocus the J-modulation of the signal by using a frequency-selective refocusing pulse2. This study aims to measure the T2 of Lac in healthy human brain at 7T using MEGA-sLASER with a selective refocusing pulse.Methods
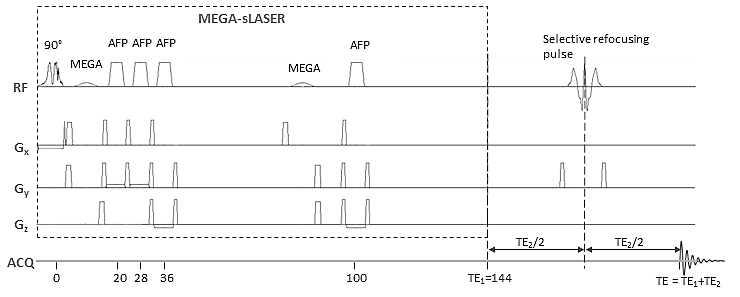
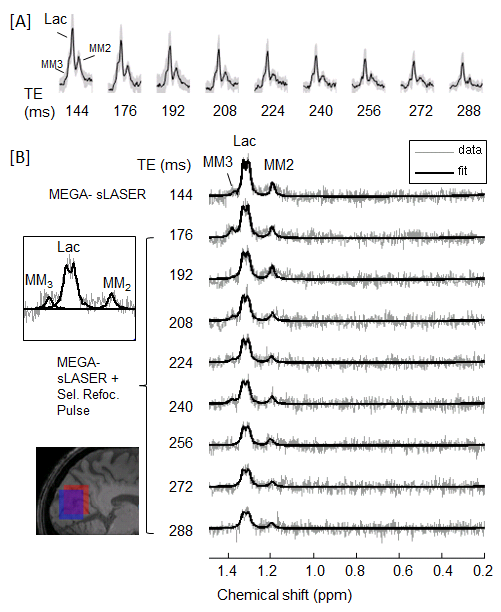
MR data were acquired on a 7T Philips Achieva system. 6 healthy subjects (age range: 23-30 yrs) participated with ethical approval from the University of Nottingham Medical School Ethics Committee. The MEGA-sLASER sequence (Fig. 1) with offset independent trapezoid (OIT) adiabatic pulses (BW=4.8kHz) and a pair of MEGA editing pulses (bandwidth 120Hz, editON: 4.1ppm & editOFF: 9.7ppm) was used with a frequency-selective refocusing pulse (bandwidth 1369Hz, transition 90Hz, centred at 0.8ppm), which refocused the Lac methyl signal at 1.3ppm without affecting the Lac methine signal at 4.1ppm. 1H spectra were acquired from a voxel of 2.5×4×3 cm3 in the occipital lobe using this sequence with varying echo time extensions (TE2= 0, 32, 48, 64, 80, 96, 112, 128, and 144 ms; TE=144+TE2 ms, TR=5s, 60 averages). The 1.3ppm Lac signal in DIFF spectra (editON-editOFF) and the 2.0ppm NAA signal in SUM spectra (editON+editOFF) were quantified with LCModel3. The co-edited resonances of macromolecules at 1.20ppm (MM2) and 1.38ppm (MM3) were also fit for more accurate quantification of Lac. In vivo T2 relaxation times were then estimated using a least squares fit to a mono-exponential decay function for each individual subject and the group mean.Results
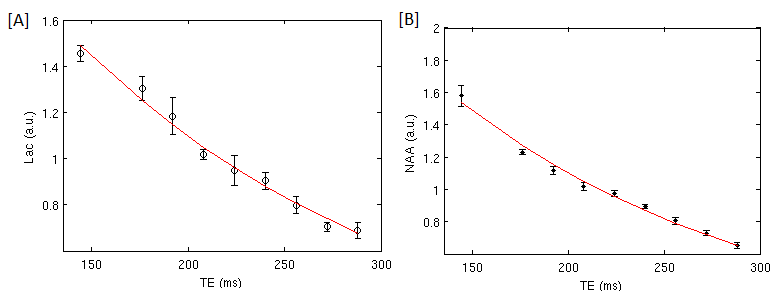
Fig. 2[A] shows the mean and inter-subject variation of Lac signals at 1.3ppm in DIFF spectra (editON-editOFF) acquired at different TEs. Fig. 2[B] shows the measured and fitted 1.3ppm Lac signals from a representative subject. This demonstrates the quality of Lac peak fitting and the consistency of the Lac peak shape across different TEs, achieved by selective refocusing of the Lac signal at 1.3ppm. Lac signals were accurately quantified individually with Cramér-Rao lower bounds (CRLB) ranging from ~7% to ~10% on average (for TEs ranging from 144ms to 288ms). Fig. 3 shows the mono-exponential fitting of the group mean signal amplitudes versus TE, from which the in vivo T2 of Lac and NAA (methyl protons) were estimated to be 182±10ms and 169±8ms, respectively. Based on T2 fitting for individual subjects, the inter-subject coefficient of variation (CV%) of the T2 relaxation times estimated was 8% for Lac and 7% for NAA, reflecting both the stability of this T2 measurement approach and the consistency of T2 values across healthy human subjects.Discussion
This study reports the first T2 measurement of Lac (methyl protons) in healthy human brain at 7T. This can be used for absolute quantification of Lac and as a reference against which to compare the T2 of Lac in abnormal brain tissue, such as brain tumours. The measured T2 of NAA (methyl protons) agrees with previous 7T reports4,5,6. With high sensitivity, the adapted spectral editing method for Lac T2 measurement shows its potential in detecting changes in Lac T2 in pathology.Acknowledgements
This
work is funded by the Medical Research Council (MRC) UK (Grant number: MR/K020803).
References
[1] Madan A., et al. MRM. 2015;73:2094-2099.
[2] Andreychenko A., et al. NMR in Biomed. 2013;24:943-957.
[3] Provencher S., et al. MRM. 1993;30: 672-679.
[4] Li Y., et al. JMID. 2012;S1(002):2155-9937.
[5] Michaeli S., et al. MRM. 2002;47:629-633.
[6] Tkác I., et al. MRM. 2001;46:451-456.
Figures