5490
Improving the quality of DW spectra in the supraclavicular fossa with a navigator-gated and cardiac-triggered flow-compensated diffusion-weighted STEAM MRS acquisition1Department of Diagnostic and Interventional Radiology, Technical University Munich, Munich, Germany, 2Philips Healthcare, Hamburg, Germany, 3Else Kröner Fresenius Center for Nutritional Medicine, Technical University Munich, Munich, Germany
Synopsis
Measuring in vivo blood perfusion within the brown adipose tissue depot of the human supraclavicular fossa is highly relevant in metabolic and obesity research. DW-MRS can probe perfusion properties by measuring the IVIM signal of the water peak. However, DW-MRS of the supraclavicular fossa remains a challenging task due the high sensitivity of the region to motion and the associated poor spectral quality. The present work proposes a DW-MRS methodology with a flow compensated acquisition combining cardiac and respiratory tracking to improve spectral quality. IVIM results for the water peak are shown for the first time in the supraclavicular fossa.
Purpose
In adult humans brown adipose tissue (BAT) is mainly present in the supraclavicular fossa1. In contrast to white adipose tissue (WAT), which serves as an energy storage, BAT can burn energy and might therefore be a potential therapeutic target in obesity treatment2. BAT has a lower fat content and a higher vascularization compared to WAT3. The increased perfusion fraction of BAT is an important parameter in the characterization of its function and activation4. Diffusion weighted (DW) MR Spectroscopy (MRS) can probe the perfusion of fat containing tissues by measuring the diffusion signal properties of the water peak. At low diffusion weighting, the perfusion fraction and the water diffusion coefficient can be extracted, as described by the intravoxel incoherent motion model (IVIM)5. However, DW-MRS of the supraclavicular fossa is expected to be strongly confounded by the high sensitivity of the region to intravoxel dephasing due to physiological motion (respiratory and cardiac-induced blood pulsation). As DW increases, physiological motion affects the spectral quality and results in an unstable fat signal even at b-values below 1000s/mm2. The purpose of the present work is to develop a DW-MRS methodology for improving the spectral quality of DW-MRS in the supraclavicular fossa.Methods
Pulse sequence:
DW STEAM MRS schemes were built without and with flow compensation (FC). Both modules were based on a standard STEAM sequence with additional gradients after the first and third RF pulse to induce diffusion weighting (Fig. 1). For the FC version a velocity compensated bipolar gradient scheme was applied. The polarity of the gradients was switched for half of the averages to compensate for eddy-current effects6.
In-vivo experiment:
The supraclavicular fossa of two healthy subjects was scanned using a 3T system (Ingenia, Philips Healthcare) with a 16-channel anterior coil, a 12-channel posterior coil and a 16-channels head coil. Dixon-based fat fraction maps were used to localize the MRS voxel in the supraclavicular fossa (Figs. 2a and 2b). The sequence parameters were TR=2 heartbeats (was equivalent to 2000ms), TE (non FC)=34ms, TE (FC)=63ms, TM=16ms, voxel size=10x10x8mm3, BW=5000, NSA=32, scan duration=approx 11:00min and b-values=1-20-40-60-100-150-200-300-400-600s/mm2. To minimize the effects of physiological motion cardiac triggering with a ECG module (trigger delay=400ms) and respiratory gating with navigator echoes at the diaphragm was applied (Fig.2c). Measurements were performed without FC, with FC and with FC and cardiac triggering. Navigator positions were acquired before every TR to exclude certain averages in the post-processing.
Post-processing:
The preprocessing (Fig.2d) of the spectra included zero order phasing, gaussian apodization and frequency allignment of single acquisitions. With respiratory gating single averages were excluded when the navigator position was outside the pre-defined navigator gating window of 6mm. The mean spectra of the remaining averages was taken and corrected for eddy current phase6. A peak area quantification was performed considering eight fat peaks6.
Spectral quality assessment:
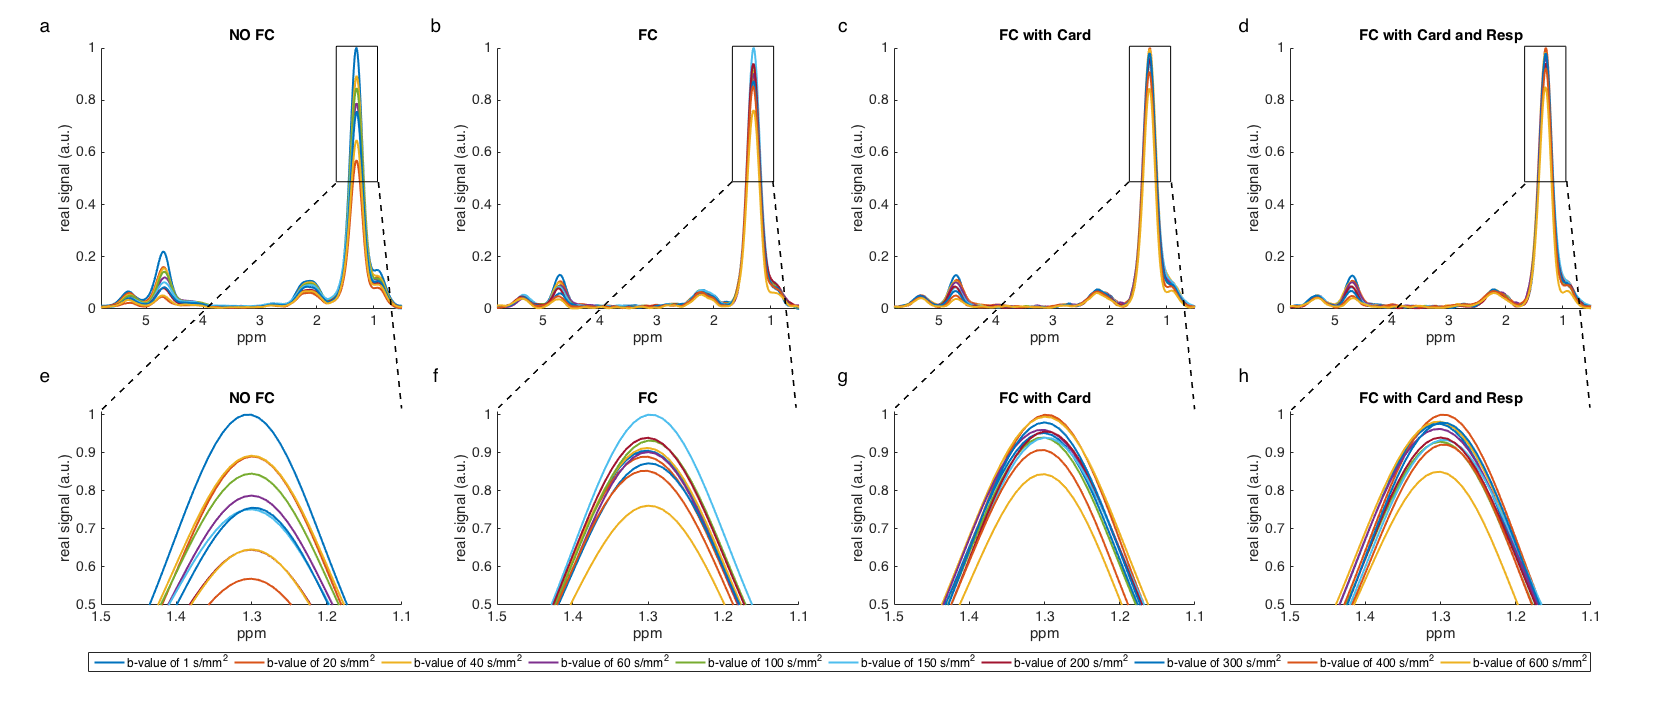
Given the low diffusion coefficient of fat7, the methylene signal should stay constant at this low b-value range. Therefore, the stability (standard deviation of the fitted peak area) of the methylene signal at 1.33ppm of acquisitions measured with different b-values was used to quantify the spectral quality.
Results
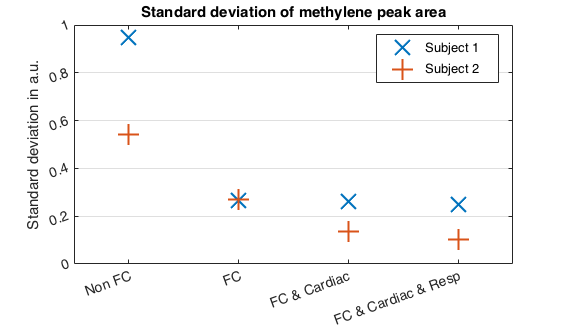
Fig.3 shows the spectral quality for different acquisition schemes. The FC diffusion weighting and the physiological tracking decreases the spreading of the fat signal amplitude over b-values. Fig.4 shows the standard deviation of the methylene peak area for both scanned subjects. A reduction of the standard deviation can be observed for both subjects when flow compensation, cardiac triggering and repiratory gating was introduced. Fig.5 shows the logarithm of the water peak signal versus the b-value for the cardiac triggered, respiratory gated FC sequence. To correct for the remaining variations of the methylene area the amplitude of the spectra was adjusted in order to reach methylene area consitency for the results shown in Fig. 58. In addition, an exponential fitting of the water signal for b-values between 200 and 600s/mm² resulted in D=1.3*10-3mm2/s.Discussion & Conclusion
Figs.3 and 4 indicate that the stability of the methylene peak is improved due to the proposed correction steps. The presented FC gradient scheme as well as the physiological tracking gradually decreases the dispersion of the methylene fat peak for different b-values in both examined subjects and are therefore essential for DW-MRS of the supraclavicular fossa. The signal decay shown in Fig.5 is in agreement with the IVIM model and could potentially be used to quantify blood perfusion in BAT. However, the long echo time of the FC gradient scheme may limit the SNR of the water peak and the presented results should be verified in a larger scale study.Acknowledgements
The present work was supported by the European Research Council (grant agreement No 677661, ProFatMRI) and Philips Healthcare.References
1. Cypess AM, Haft CR, Laughlin MR, Hu HH. Brown Fat in Humans: Consensus Points and Experimental Guidelines. Cell metabolism. 2014; 20(3):408-415
2. Boss O., Farmer S. R. Recruitment of brown adipose tissue as a therapy for obesity-associated diseases. Front. Endocrine. 2012; 3:14
3.Frontini, A. et al. Distribution and Development of Brown Adipocytes in the Murine and Human Adipose Organ. Cell Metabolism. 2010; 11(4): 253 - 256
4. Ernande, L.,Stanford, KI., Thoonen, R.,Zhang, H., Clerte, M.,Hirshman, MF.,Goodyear, LJ.,Bloch, KD., Buys, ES.,Scherrer-Crosbie, M., Relationship of brown adipose tissue perfusion and function: a study through β2-adrenoreceptor stimulation. Journal of Applied Physiology. 2016; 120(8): 825-832
5. Le Bihan D, Breton E, Lallemand D, Aubin ML, Vignaud J, Laval-Jeantet M.. Separation of diffusion and perfusion in intravoxel incoherent motion MR imaging. Radiology 1988;168:497-505
6. Ruschke, S., Kienberger, H., Baum, T., Kooijman, H., Settles, M., Haase, A., Rychlik, M., Rummeny, E. J. and Karampinos, D. C., Diffusion-weighted stimulated echo acquisition mode (DW-STEAM) MR spectroscopy to measure fat unsaturation in regions with low proton-density fat fraction. Magn. Reson. Med. 2016, 75: 32–41
7. Lehnert A, Machann J, Helms G, Claussen CD, Schick F. Diffusion characteristics of large molecules assessed by proton MRS on a whole-body MR system. Magn Reson Imaging 2004;22:39–46
8. Döring, A., Adalid, V., Brandejsky, V., Boesch C., Kreis R., Optimized Estimation of Apparent Diffusion Coefficients of Metabolites, Proc. ISMRM Spectroscopy Workshop 2016, p. 14
Figures