5489
Correlation of Diffusion Weighted Imaging and Echo Planar Correlated Spectroscopic Imaging of Breast Cancer in 3T1Human Magnetic Resonance Center, Institute for Applied Life Sciences (IALS), University of Massachusetts, Amherst, MA, United States, 2Radiological Sciences, University of Califonia Los Angeles, Los Angeles, CA, United States, 3Physics, California State University, Fresno, CA, United States
Synopsis
In vivo magnetic resonance spectroscopy (MRS) of the breast can be used to measure the level of choline-containing compounds, which is a biomarker of malignancy. The advantage of four dimensional (4D) echo-planar correlated spectroscopic imaging (EP-COSI) enables full slice coverage of the breast facilitating recording of multi-voxel based two-dimensional (2D) MRS than the single-voxel based localized correlated spectroscopy (L-COSY). Also in addition to differentiate malignant from benign, EP-COSI can differentiate the healthy fatty from glandular. Decreased ADC values derived from diffusion weighted imaging (DWI) can be correlated with increased choline and decreased lipids quantified by the EP-COSI technique.
Introduction
In vivo proton MRS of the breast, which provides molecular information obtained in a noninvasive manner, has shown that choline-containing compounds can be detected in most breast cancers 1-3, whereas choline is generally not detectable in normal breast tissues. Single voxel 1D MRS and a single slice-based two-dimensional (2D) or three dimensional (3D) MRSI suffer from overlapping metabolites and also, the MRSI scan time is long. Likewise, localized 2D correlated spectroscopy (L-COSY) 4 suffers from a voxel placement and a long scan time. EPSI can significantly cut down the acquisition duration 5. Combining a second spectral dimension with the EPSI sequence will increase the spatial-spectral coverage using echo planar correlated spectroscopic imaging (EP-COSI) which records two spectral and two spatial dimensions 6. Diffusion weighted imaging (DWI) is a short, non-contrast MRI sequence that has strong potential to increase specificity as an adjunct to conventional breast MRI protocols. DWI measures the apparent diffusion coefficient (ADC), which characterizes the mobility of water molecules in vivo and indirectly reflects tissue cellularity, microstructural characteristics and membrane integrity 7. Two major goals of this work were as follows: 1) to implement and validate 4D EP-COSI in healthy fatty, glandular and breast cancer in women, and 2) to correlate the metabolite ratios derived from the 4D EP-COSI data with ADC from the DWI data.Materials and Methods
The 4D EP-COSI sequence was implemented on a Siemens 3T Tim-Trio MRI/MRS scanner (Siemens Medical Systems, Erlangen, Germany) as shown by Lipnick et al.6. The parameters for the EP-COSI acquisition were: TR /TE/ Average = 1500s/30ms/1, 1024 bipolar echoes with each echo sampling 16 kx and 16 ky, FOV= 16cm. The bandwidth of directly detected spectral dimension (F2) was 1190Hz and for the indirect second dimension (F1), 50 increments with bandwidths of 1250Hz was used. The individual voxel volumes in the 4D EP-COSI data were approximately 2.0ml. Water suppressed (WS) (20 minutes) and non water suppression (NWS) (1.25 mins) EP-COSI data were collected. 15 healthy subjects (mean age of 45 years) and breast cancer patients (6 benign patients with a mean age of 43 years and 5 malignant patients with a mean age of 51 years) underwent acquisition of MRI/DWI and EP-COSI with a dedicated 4-channel phased array breast ‘receive’ coil. For voxel placement, axial, coronal and sagittal T1- and T2-weighted MR images were used, and the 4D EP-COSI spectra were recorded in the fatty and glandular areas of healthy and malignant breasts. For the DWI, 2D spin-echo echo-planar imaging (EPI) sequence (TR/TE of 3800/93ms; data matrix, 192 × 192; signal average, 3; slice thickness, 3 mm; distance factor, 20%) in the axial plane was used. Sensitizing diffusion gradients in three orthogonal directions with b values of 50 and 800 s/mm2 were applied. The ADC maps were created automatically by the system from the trace-weighted images with b values of 50 and 800 s/mm2Results
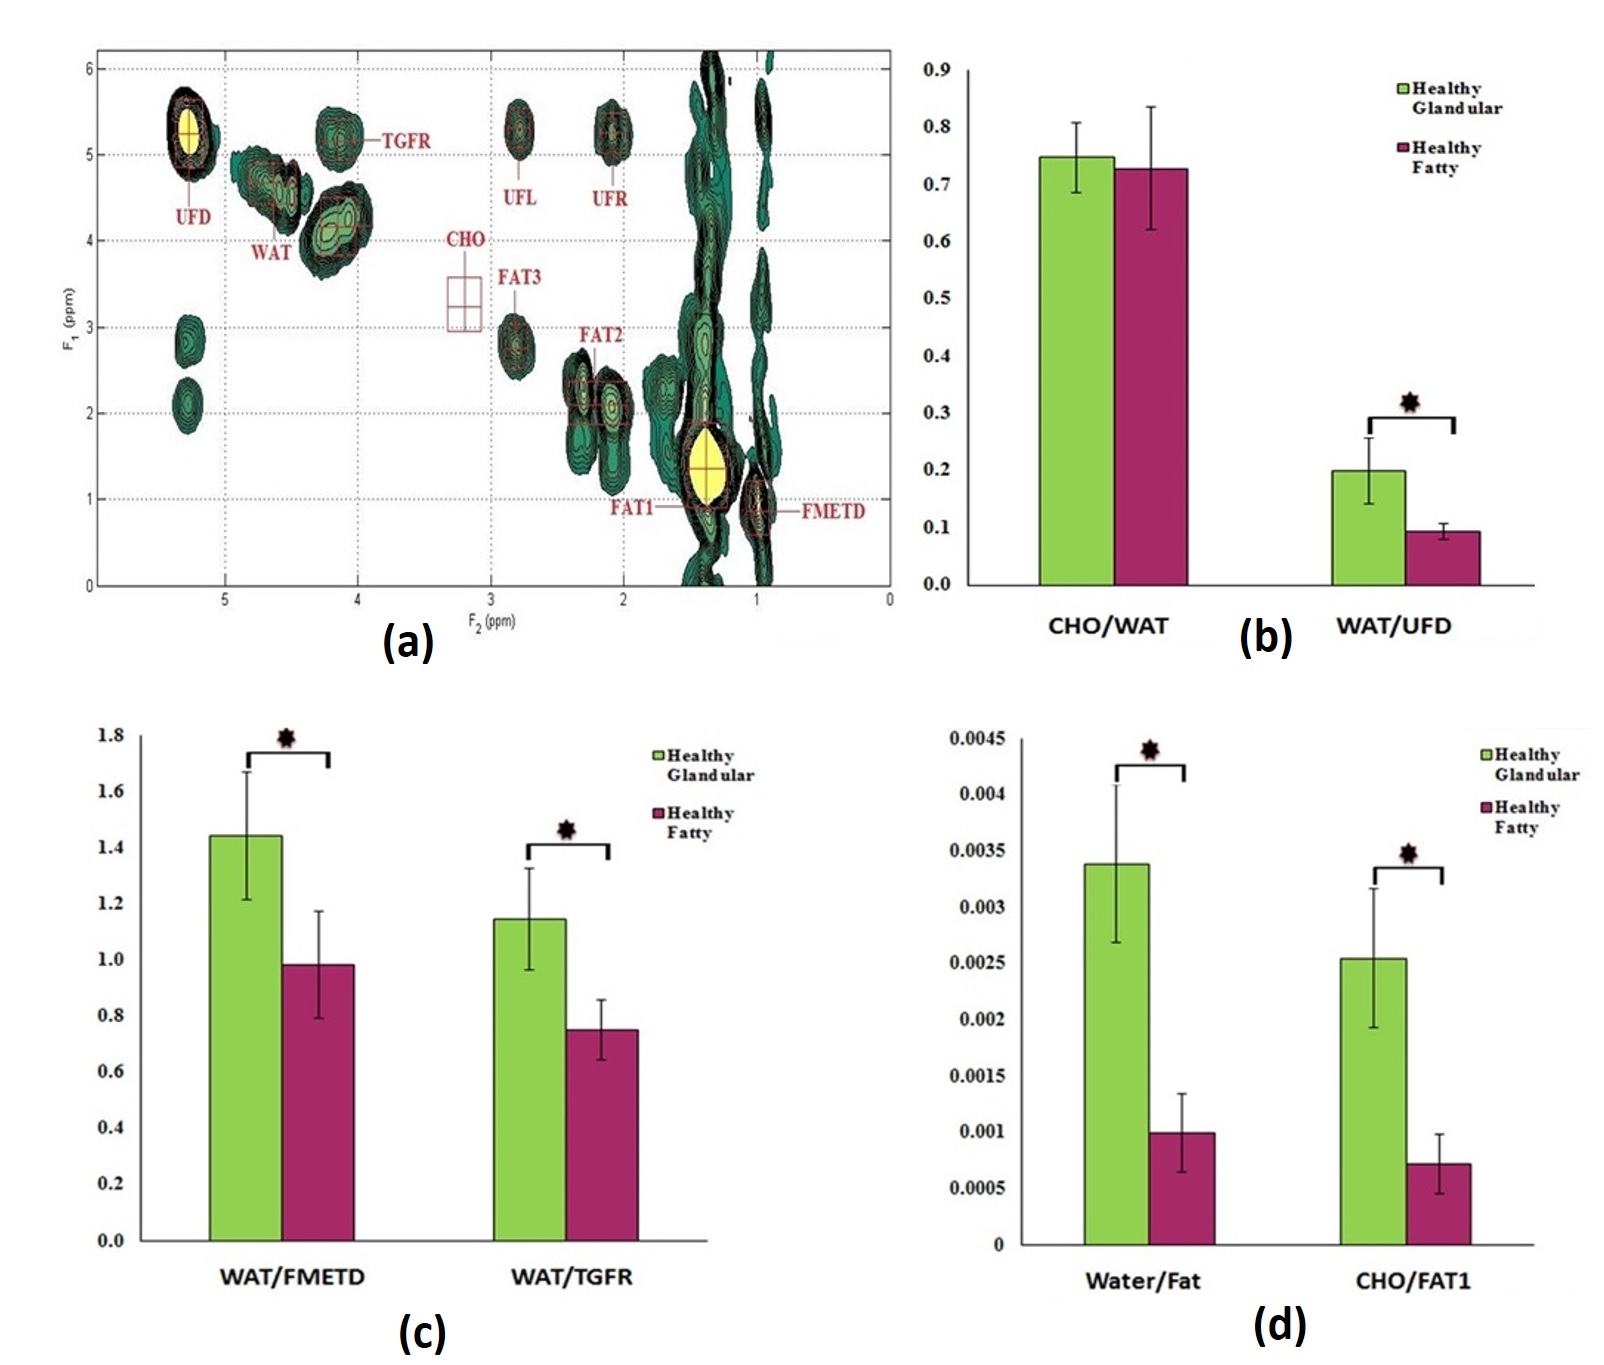
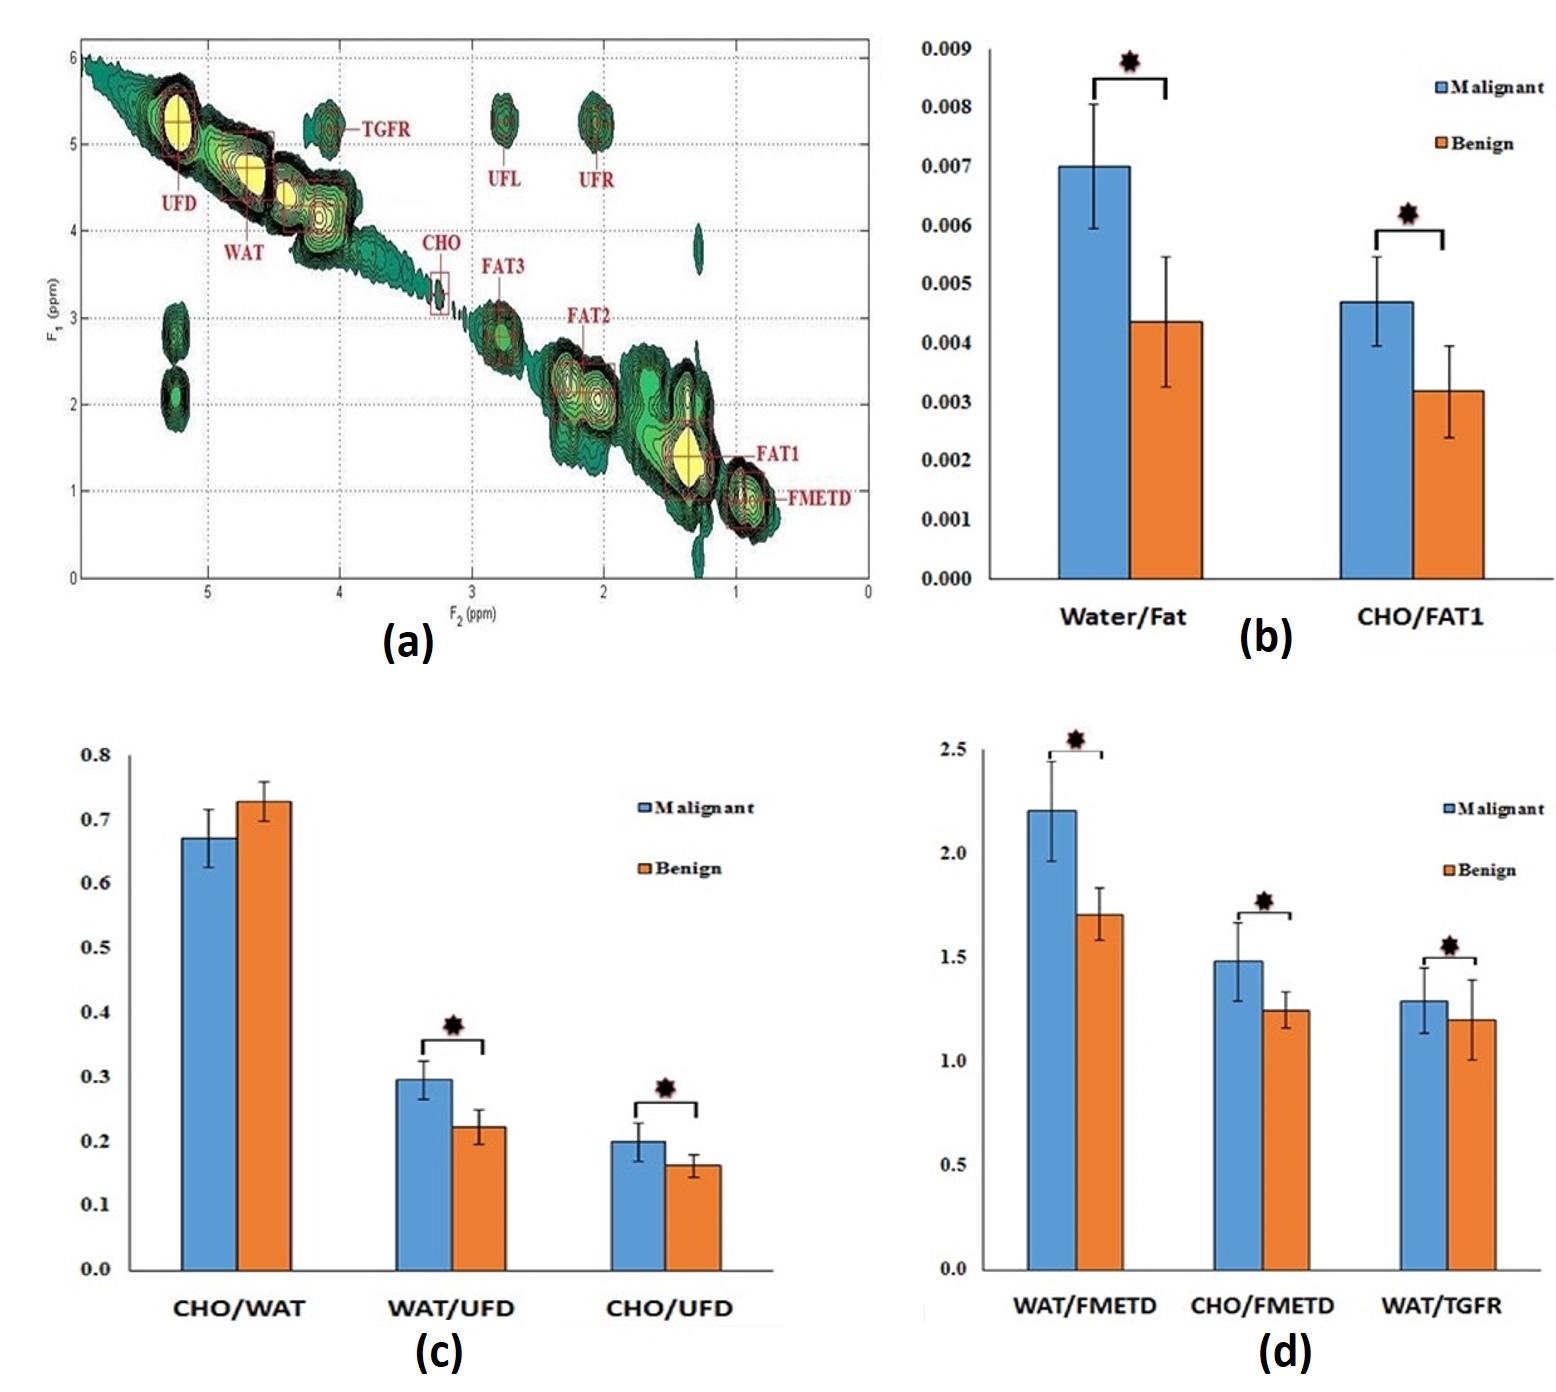
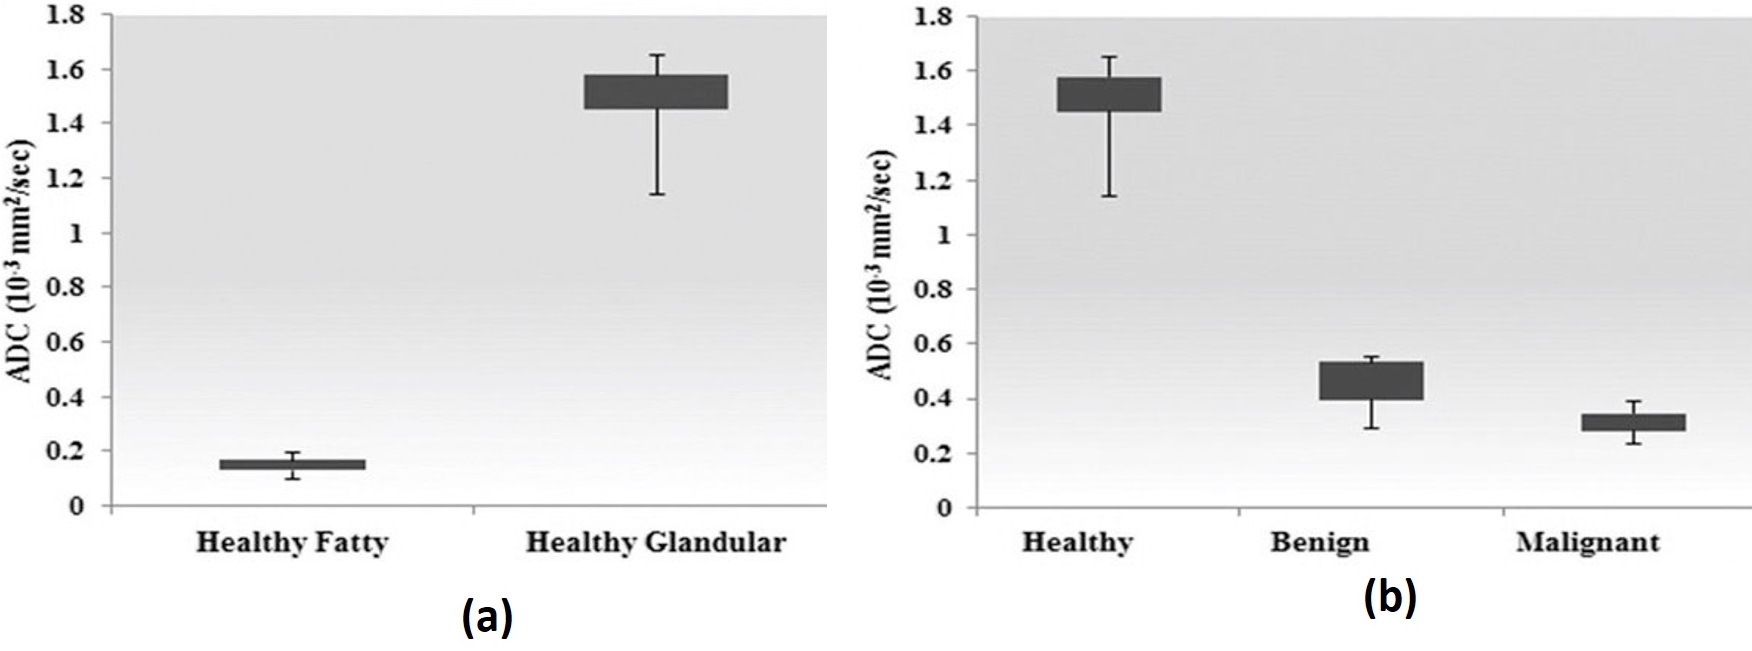
The extracted 2D COSY of 52 years old healthy volunteer and various metabolites ratios of healthy glandular and fatty breast are shown in Fig.1(a-d). The extracted 2D COSY of 55 years old malignant patient and metabolites ratios of benign and malignant patients are shown in Fig.2 (a-d). The ADC values derived from the DWI data of healthy fatty, glandular regions (Fig.3a) and malignant, benign and healthy are shown in Fig.3b. The 4D EP-COSI spectra recorded in breast carcinoma showed decreased peaks representing the protons of methyl, methylene, water, methyl fat (FMETD), methylene fat (FAT1), olefinic fat (UFD), and a peak due to the tri-methyl protons of choline (Cho), which was not in detectable in healthy breast tissues.Discussion
Statistically significant metabolite changes (p<0.05) were observed in the following groups: Wat/UFD, Wat/FMETD, Wat/TGFR, Wat/Fat and Cho/Fat1 (between healthy glandular and healthy fatty). The difference in ADC values between healthy glandular and healthy fatty and benign as well as healthy and malignant showed statistically significant (P<0.05). In agreement with earlier result 7, the ADC values were overlapping between malignant and benign breast lesions. MRS changes were measurable in multiple breast regions using the 4D EP-COSI sequence. However, the result of this pilot study has a limitation due to the small number of malignant and benign subjects.Conclusion
An important conclusion of this pilot study is that DWI and 4D EP-COSI data can be acquired in the same setting and ADC values derived from DWI can be correlated with biochemical changes. The 4D EP-COSI data enables a single slice coverage of the breast facilitating recording of multi-voxel based 2D MRS and also able to differentiate the healthy glandular and fatty breast.Acknowledgements
(W81XWH-10-1-0743) and (W81XWH-16-1-0524) from the Congressionally Directed Medical Research Programs (CDMRP) Breast Cancer Research Program (BCRP).References
1. Bolan PJ, Nelson MT, Yee D, et al. Imaging in breast cancer: Magnetic resonance spectroscopy. Breast Cancer Res. 2005;7(4):149–152.
2. Jagannathan NR, Kumar M, Seenu V, et al.Evaluation of total choline from in-vivo volume localized proton MR spectroscopy and its response to neoadjuvant chemotherapy in locally advanced breast cancer.Br J Cancer. 2001 Apr; 84(8): 1016–1022.
3. Meisamy S, Bolan PJ, Baker EH, et al. Adding in vivo quantitative 1H MR spectroscopy to improve diagnostic accuracy of breast MR imaging: preliminary results of observer performance study at 4.0 T. Radiology. 2005;236(2):465–475.
4. Thomas MA, Yue K, Binesh N, et al. Localized two-dimensional shift correlated MR spectroscopy of human brain.Magn Reson Med. 2001 Jul;46(1):58-67.
5. Posse S, DeCarli C, Le Bihan D.Three-dimensional echo-planar MR spectroscopic imaging at short echo times in the human brain. Radiology. 1994 Sep;192(3):733-8.
6. Lipnick S, Verma G, Ramadan S, et al. Echo planar correlated spectroscopic imaging: implementation and pilot evaluation in human calf in vivo.Magn Reson Med. 2010 Oct;64(4):947-56.
7. Guo Y, Cai YQ, Cai ZL, et al. Differentiation of clinically benign and malignant breast lesions using diffusion-weighted imaging. J Magn Reson Imaging. 2002 Aug;16(2):172-8.
Figures