5487
Accurate determination of cerebral lactate and glutamate concentration changes during a long visual stimulus1Sir Peter Mansfield Imaging Centre, University of Nottingham, Nottingham, United Kingdom
Synopsis
Estimation of metabolic changes during neuronal activation represents a challenge for in vivo MRS, particularly in the case of lactate, whose dissociation from other resonances is not straightforward. To reliably quantify lactate, the lipid and macromolecular signals were significantly reduced by using a long TE (144 ms) and the remaining macromolecular signals in the vicinity of the lactate peak were individually fitted with lorentzian peaks. Statistically significant changes in lactate and glutamate levels during 15 min of visual stimulation were detected in the visual cortex, unveiling a distinctive metabolic response pattern, which can provide further insight into brain activation mechanisms.
Purpose
Consistent increases in lactate (Lac) and glutamate (Glu) levels during visual stimulation have been reported at ultra-high field (7T)1,2,3,4. The majority of these functional MRS (fMRS) studies used short TE sequences, in which the accurate quantification of some metabolites of interest can be difficult, especially in the case of Lac, whose resonances overlap with signals of higher concentration compounds, in particular macromolecules (MM). Alternatively, the use of a longer TE (144 ms), which results in an inverted Lac doublet, and substantially reduces the intensity of the lipid and MM signal, has been shown to be feasible for fMRS studies4. Nevertheless, a non-negligible amount of MM signal is still present in the spectral regions adjacent to Lac and needs to be carefully characterised. The spectral quantification with a general measured MM baseline may not be sufficiently robust to account for inter-subject variability in the different MM components. Therefore, the aim of this work was to accurately determine the changes in Lac and Glu levels during visual stimulation, by individually fitting the non-fully relaxed MM resonances at TE = 144 ms with simulated lorentzian peaks. The investigation of the metabolic time courses was explored using an extended visual stimulus (15 min), longer than previously used.Methods
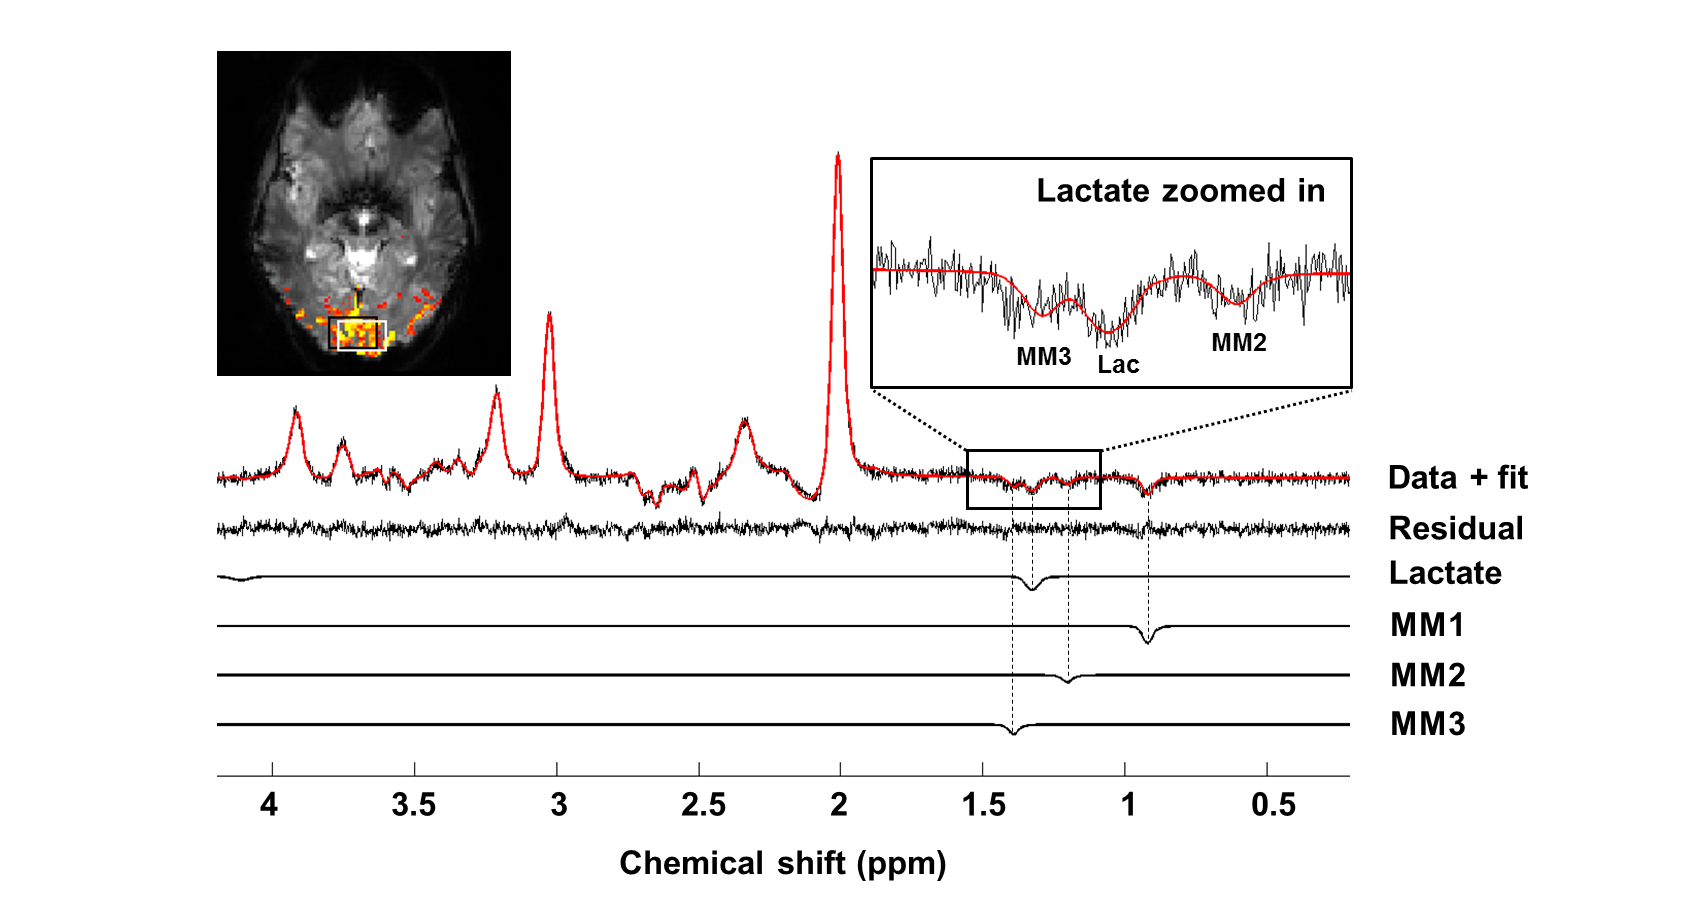
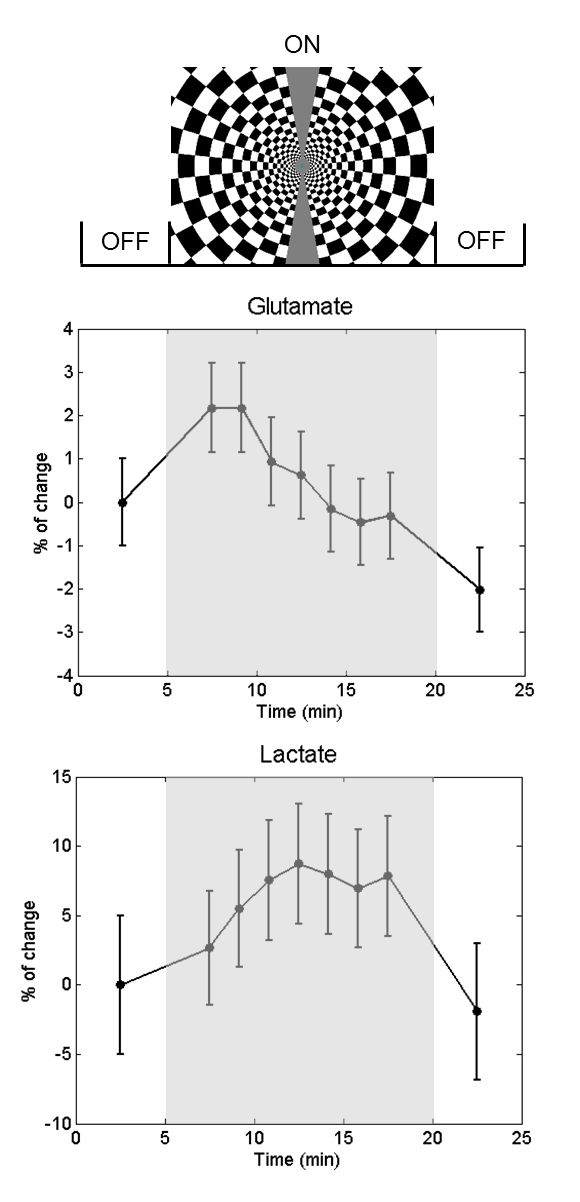
MR measurements were performed on six healthy volunteers (3 males; age range: 25 - 30 years) on a 7T Philips Achieva MR system (Philips Healthcare, Best, Netherlands). 1H spectra were acquired with a sLASER sequence (TR/TE = 5000/144 ms, voxel size = 20x30x20 mm3) during the application of an activation paradigm, which consisted of 15 min of visual stimulation (flickering checkerboard at 8 Hz - ON period), preceded and followed by 5 min of rest (OFF periods). Prior to this, an fMRI localiser was performed to assist the positioning of the volume of interest in a region of strong visual activation. The spectra were averaged into blocks of 20 scans, followed by a moving average with a kernel of 3 blocks. Only averages fully composed of blocks from either the ON or OFF period were kept, to avoid a mixture of signals acquired in different conditions. The resulting spectra (60 averages) were quantified using LCModel5, with a basis set composed of 19 metabolites and 3 simulated MM components - MM1 (0.89 ppm), MM2 (1.20 ppm) and MM3 (1.37 ppm). Metabolic time courses were also obtained from the average of all the subjects’ spectra, after frequency alignment using the creatine peak at 3.02 ppm (group analysis). Statistical analysis was performed using a two-tailed t-test (α = 0.05) on the percentage of change relative to the first OFF period.Results and discussion
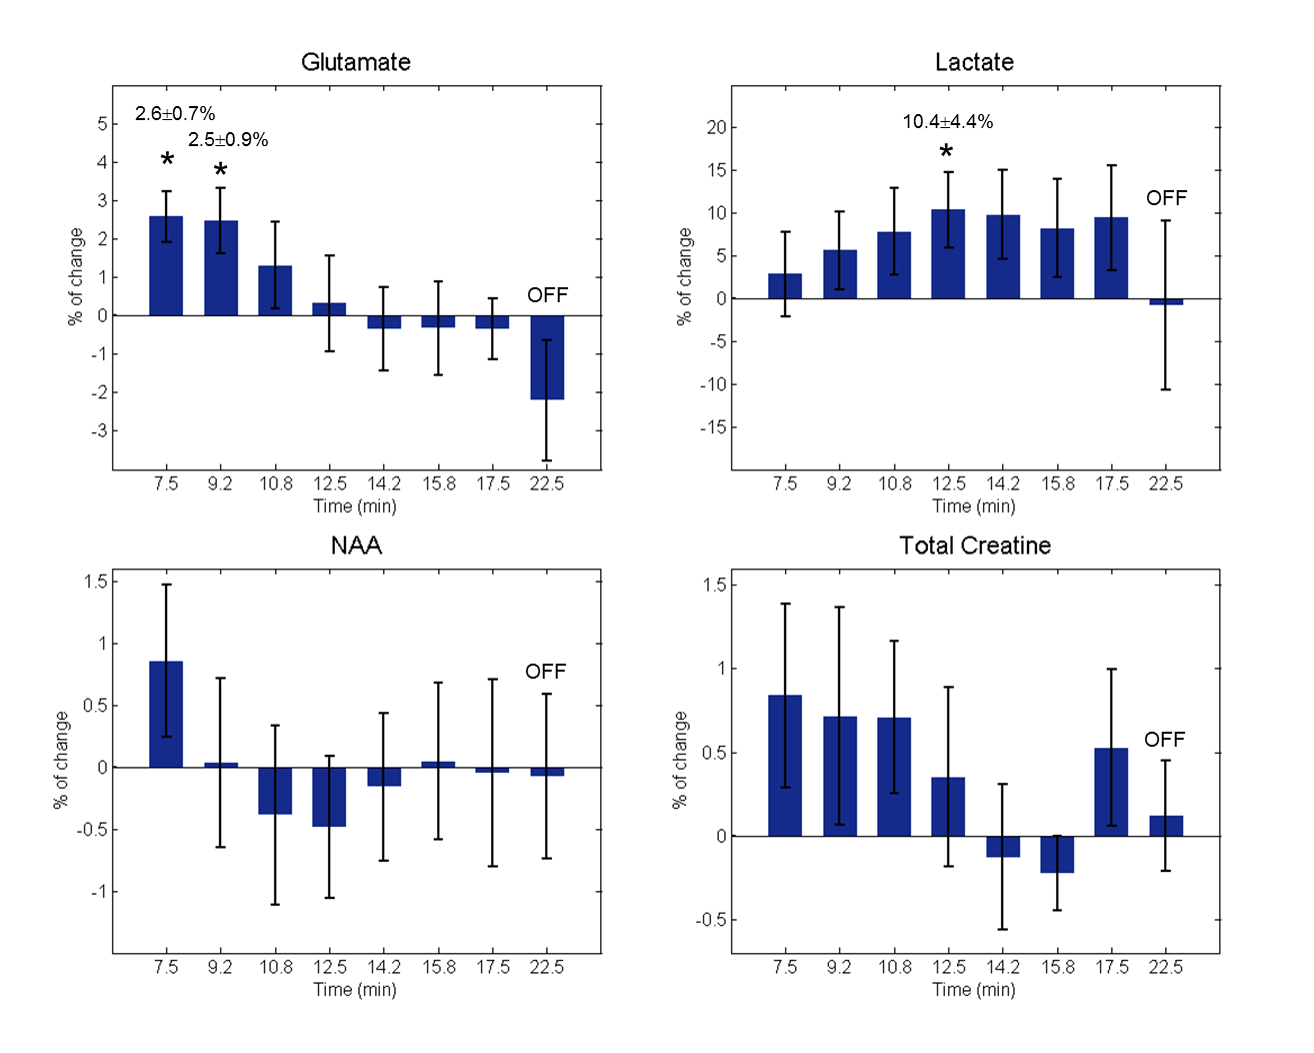
Glu and Lac levels were estimated in LCModel with Cramér-Rao lower bounds of ~ 2% and ~ 8%, respectively, for individual subject time points. The simulated basis set with the addition of the relevant MM resonances exhibited a good agreement with the individual spectra, resulting in a well-fitted inverted Lac peak (Figure 1). The Lac peak was also shown to be easily identifiable, such that the temporal changes can be confirmed by visual inspection of the spectra, without the need to employ difference methods. The analysis of the group spectrum (Figure 2) showed a transient increase in Glu levels within the first minutes of stimulation, followed by a return to baseline. In contrast, Lac levels gradually increased during the ON period, reaching maximum activation in the middle of this period, and maintaining a steady-state until the end of the stimulation. The percentage of change in the metabolite levels relative to the baseline calculated with the individual subject spectra (Figure 3) confirmed the metabolites’ time course obtained with the group analysis, with significant increases in Glu levels of 2.6±0.7% and 2.5±0.9% as an immediate response to the stimulus and a rise in Lac levels of 10.4±4.4% reached halfway through the stimulation. The initial changes in Glu and Lac in the first minutes of the stimulation agree with previous observations1,2,3,4. However, no statistically significant changes in NAA and total creatine levels were observed during the stimulation, as expected for these molecules.Conclusion
The acquisition and analysis strategy here presented, although limiting the number of measured metabolites, was shown to provide a reliable way to detect changes in Lac and Glu during visual stimulation. This has previously proved challenging, especially for Lac. Other studies have used shorter stimulation periods, which did not reveal the different Lac and Glu responses evident in the present longer time course, allowing further interpretation of the dynamics of brain metabolism during activation.Acknowledgements
No acknowledgement found.References
1. Lin Y, et al. Investigating the metabolic changes due to visual stimulation using functional proton magnetic resonance spectroscopy at 7T. JCBFM. 2012; 32: 1484-1495.
2. Schaller B, et al. Net Increase of Lactate and Glutamate Concentration in Activated Human Visual Cortex Detected With Magnetic Resonance Spectroscopy at 7 Tesla. J. Neuroscience Res. 2013; 91: 1076-1083.
3. Bednarík P, et al. Neurochemical and BOLD responses during neuronal activation measured in the human visual cortex at 7 Tesla. JCBFM. 2015; 35: 601-610.
4. Bednarík P, et al. Functional MRS at 7T and long TE. Proc. 24th ISMRM meeting. 2016.
5. Provencher S. Estimation of metabolite concentrations from localized in vivo proton NMR spectra. Magn Reson Med. 1993; 30: 672-9.
Figures