5485
Water lineshape fitting method to overcome B0 field inhomogeneity for NMR spectroscopy1Erwin L. Hahn Institute for Magnetic Resonance Imaging, University of Duisburg-Essen, Essen, Germany, 2Donders Institute for Brain, Cognition and Behavior, Radboud University, Nijmegen, Netherlands
Synopsis
Good B0 field homogeneity is an essential requirement for NMR single voxel spectroscopy. Previously proposed spectral fitting method assumes that all metabolite signals have a Lorentzian shape. However, B0 inhomogeneity may both broaden the linewidth, and modify the lineshape into an asymmetric form. This study has demonstrated a water lineshape fitting method to overcome B0 inhomogeneity using corresponding metabolite fitting models by water lineshape. We obtained similar relative metabolite signal intensities and improved spectral fitting quality regardless of the field homogeneity condition.
Introduction
Good B0 field homogeneity is an essential requirement to accomplish a fundamental goal of single voxel spectroscopy, which is to quantify metabolite concentrations within the voxel. Previously proposed spectral fitting method [1] assumes that all metabolite signals have a Lorentzian shape. However, B0 inhomogeneity may both broaden the linewidth, and modify the lineshape into an asymmetric form. We hypothesize that a realistic metabolite fitting model considering B0 homogeneity by a water lineshape can better estimate metabolite concentration giving fitting results that are largely independent of the B0 field inhomogeneity.Material and methods
Lineshapes of all metabolites are considered to have one identical shape, which is equal to that of the water signal. We can specify the chemical-shifts and J-coupling for each metabolite. We designed metabolite basis sets which meet these conditions for the spectral fitting by LCModel. We acquired semi-LASER[2] MRS data from the occipital-cortex of 8 healthy volunteers (5M/3F;27.3±2.63YO) under three different B0 homogeneity conditions (linewidth - Good: 20~30Hz / Fair: 50~60Hz / Poor: 70~80Hz) using a Siemens 7T system with following scan parameters; 8cm3 isotropic-voxel, TE/TR/NEX=68ms/4500ms/64. A 3D-MPRAGE was acquired as an anatomical reference before spectroscopy. B0 homogeneity was adjusted by FASTESTMAP[3]. Water signal was also acquired by turning off the water suppression for each field homogeneity condition (NEX=16). We simulated each metabolite with the same sequence and scan parameters as for the in-vivo spectroscopy scan by NMRSIM (Bruker, Rheinstetten). Field homogeneity condition was accounted for by convolving the water signal with delta functions, which were extracted from the simulated models for 20 metabolites (Ala, ASC, Asp, Cho, Cr, GABA, GPC, GSH, Gln, Glu, Gly, Lac, NAA, NAAG, PCh, PCr, Scyllo, Tau and Ins). Individual metabolite basis sets were created for each shimming case. Metabolite concentrations were estimated using LCModel [1]. Quantification errors were also estimated by Cramér–Rao lower bound (CRLB), which is an estimated relative standard deviation (%SD,) as a reliability for each reported metabolite concentration by LCModel.Results
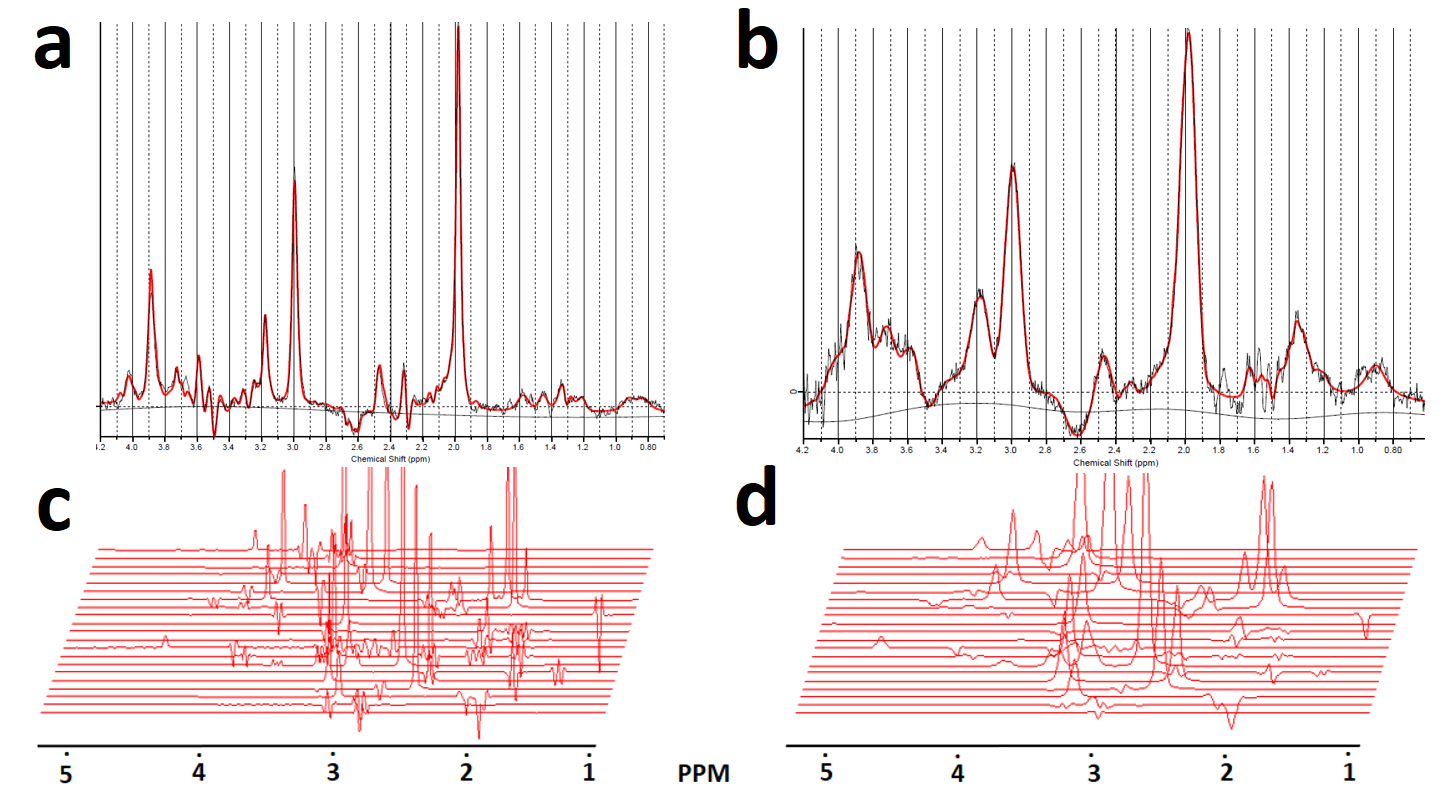
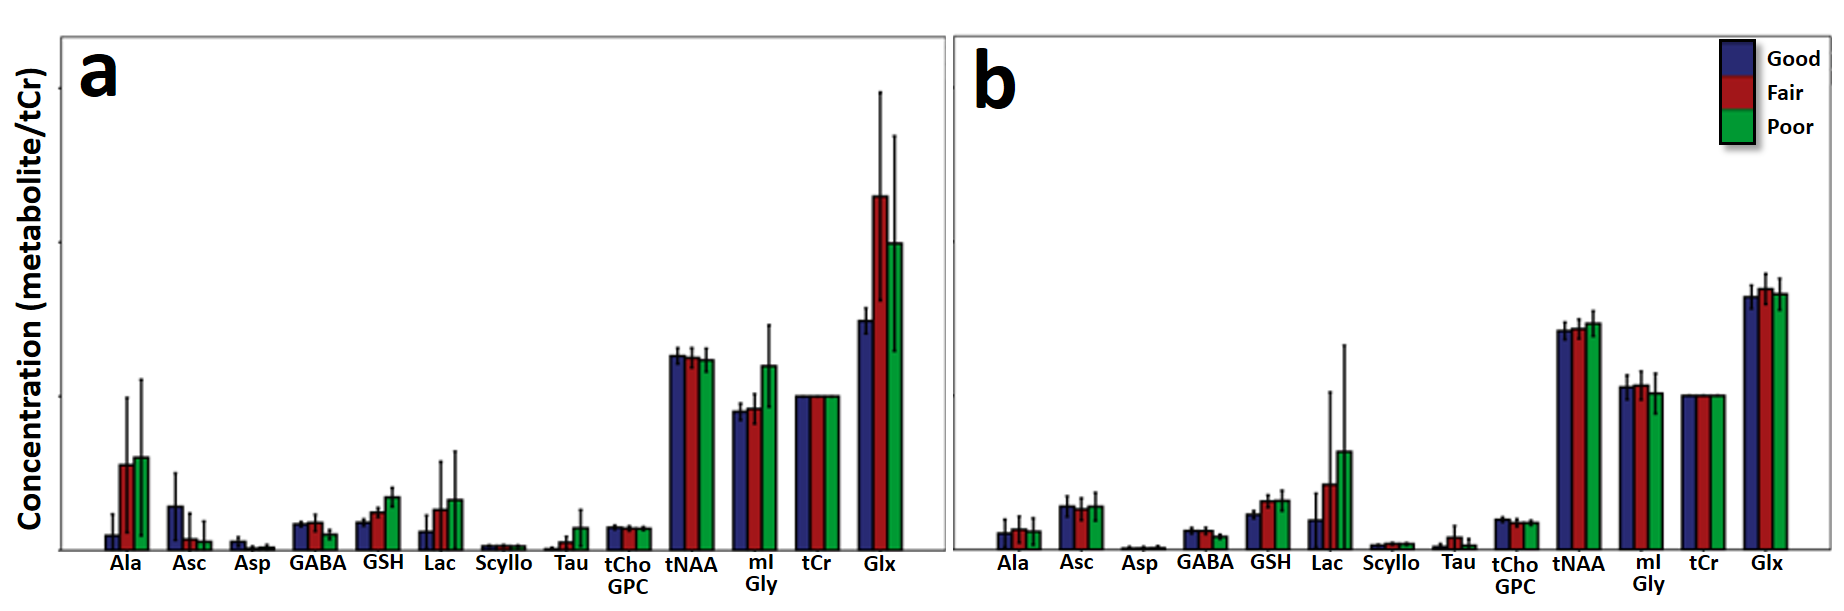
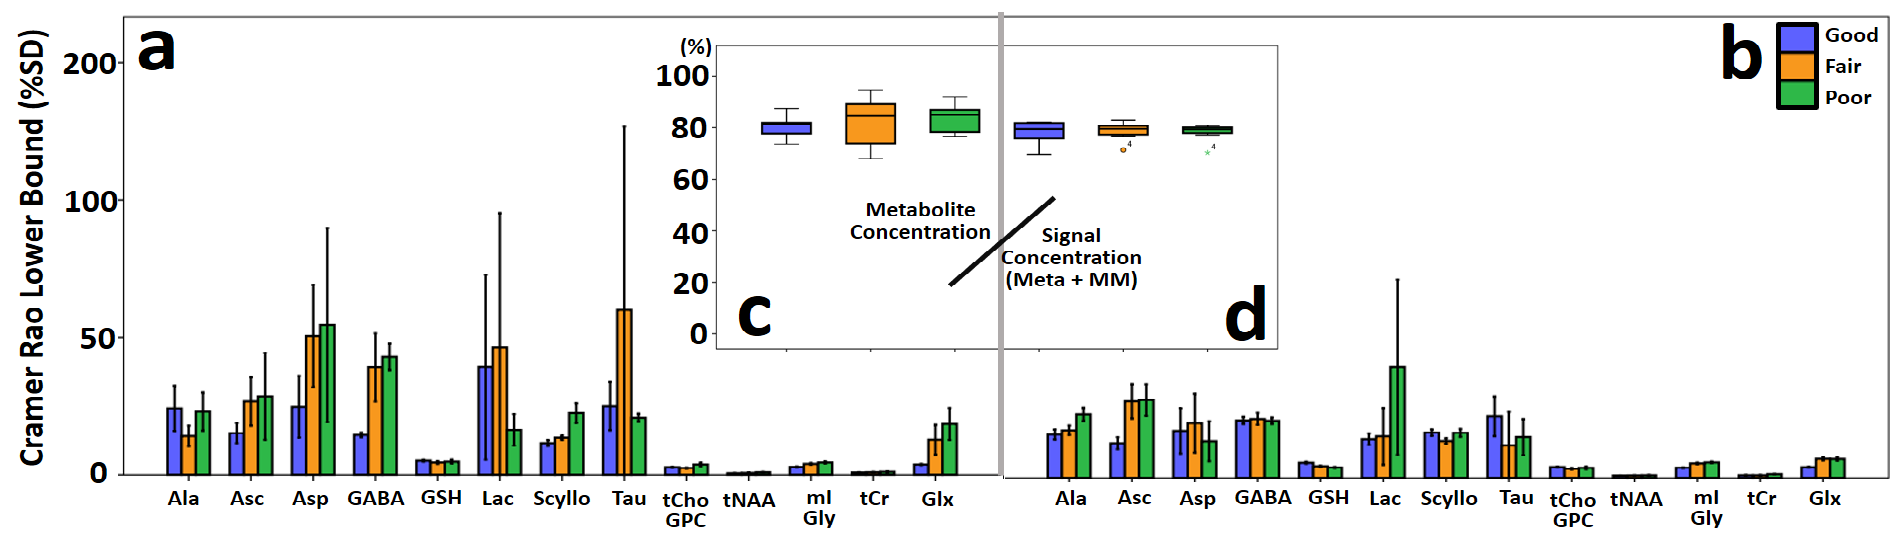
The water linewidths for each field homogeneity condition were 26.38±1.49, 55.50±1.50, 76.21±1.66(Hz); good, fair, poor; respectively. Fig.1 shows fitted lines after the LCModel analysis by water lineshape models (a, b), and their corresponding water lineshape fitting models models (c, d). Fig.2 shows a concentration comparison of each metabolite, normalized to tCr concentration, after LCmodel fitting with conventional fitting models (a), which did not consider field inhomogeneity, and with water lineshape fitting models (b) under the different field homogeneity conditions. As seen in Figure 3, Water lineshape fitting method reduced CRLB below 60% in most cases (a, b), and showed more stable metabolite concentration over total signal concentration in all field homogeneity conditions. (c, d)Discussion
This study has demonstrated a water lineshape fitting method to overcome B0 inhomogeneity using corresponding metabolite fitting models by water lineshape. In most cases, we obtained similar relative metabolite signal intensities regardless of the field homogeneity condition except Lactate which is solely located at 1.3ppm in the area with abundant macro-molecule. Macro molecule signal, mistaken as Lactate, artificially elevates this signal concentration in the poor field homogeneity condition. Water lineshape fitting method improved spectral fitting quality, which is estimated by CRLB, to the acceptance level (<50%) reported by Provencher [1]. The improvement in stable metabolite concentration over total signal concentration and improved spectral fitting quality confirm that water signal fitting improves spectral estimation in situations with a poor linewidth. For the range of linewidths used in the study, and under the assumption that an adequate water suppression can still be achieved the figure shows that the results obtained are considerably less sensitive to linewidth than the conventional spectral fitting method.Acknowledgements
No acknowledgement found.References
[1] Provencher, Stephen W. "Estimation of metabolite concentrations from localized in vivo proton NMR spectra." Magnetic resonance in medicine 30.6 (1993): 672-679.
[2] Scheenen, Tom WJ, et al. "Short echo time 1H-MRSI of the human brain at 3T with minimal chemical shift displacement errors using adiabatic refocusing pulses." Magnetic resonance in medicine 59.1 (2008): 1-6.
[3] Gruetter, Rolf, and Ivan Tkác. "Field mapping without reference scan using asymmetric echo-planar techniques." Magnetic resonance in medicine 43.2 (2000): 319-323.
Figures