5484
A Novel Method for Absolute Metabolite Quantification of 1H Spectroscopic Imaging in the Human Brain Based on Water Measurement with Ultrashort TE1Biomedical Center Martin, Jessenius Faculty of Medicine, Comenius University, Martin, Slovakia, 2Faculty of Mathematics, Physics and Informatics, Comenius University, Bratislava, Slovakia, 3Jessenius Faculty of Medicine, Comenius University, Martin, Slovakia
Synopsis
We introduce an easily implementable quantification method in vivo based on unsuppressed water measurement (pulse-acquire FID sequence with low flip-angle, short TE and TR and geometry identical to metabolite MRSI). Our quantification is practically independent on water relaxation times, requires only short extra measurement time and is robust enough in pathologies like tumors. We tested its results in a homogeneous phantom, healthy volunteers and tumor patients using a head resonator and an 8-channel array coil for acquisition.
Introduction
The authors introduce a fast and easily implementable method of absolute metabolite quantification for 2- or 3-dimensional 1H MR spectroscopic imaging (MRSI) in vivo. The method is practically independent on water T1 and T2, requires only short extra measurement time and is robust enough for quantification in pathologies like tumors. Automated data processing and metabolite map display can be provided by a freely available tool jSIPRO1 in connection with LCModel2 or jMRUI3.Methods
Our method is based on unsuppressed water measurement (used in addition to any common metabolic MRSI sequence) by a pulse-acquire (FID) sequence with very low flip angle, ultra-short TE and very short TR. Water signal is acquired in several phase-encoding steps with geometry identical to the metabolite sequence. This signal is used by LCModel as an internal reference for absolute metabolite quantification.
Our measurements were performed using a clinical 1.5 Tesla Siemens Symphony scanner with whole-body coil signal excitation. For metabolite signal acquisition, we used standard 3-dimensional PRESS MRSI sequence (TE 30 and 135 ms, TR 1500 ms, 16x16x8 matrix (elliptical), 15 minutes). For water referencing, we proposed and tested an identical FID-based sequence (supplied by scanner vendor, 1º flip angle, TE=2.3 ms, TR=200 ms and thus measurement time of 2 minutes). Precise local flip angles were adjusted exploiting the vendor-supplied sequence for water suppression pulse adjustment in a very small volume (1x1x1mm3). Two coils were tested for signal acquisition (8-channel head array, standard head resonator). Our method was tested in an aqueous phantom containing four brain metabolites in high concentrations; in 6 young healthy volunteers (20 years ±2); and in 20 patients with brain tumors undergoing MRSI examination for other studies.
The following parameters were tested in vitro and in vivo: Flip angle distribution, possible T1 weighting of water signal, consistency of LCModel water signal processing, and overall performance of the method. We tested the effect of water signal acquisition with lower spatial resolution, which was previously used in other similar methods.4, 5 Data were processed and visualized using jSIPRO1 and spectral fitting performed with LCModel2.
Results
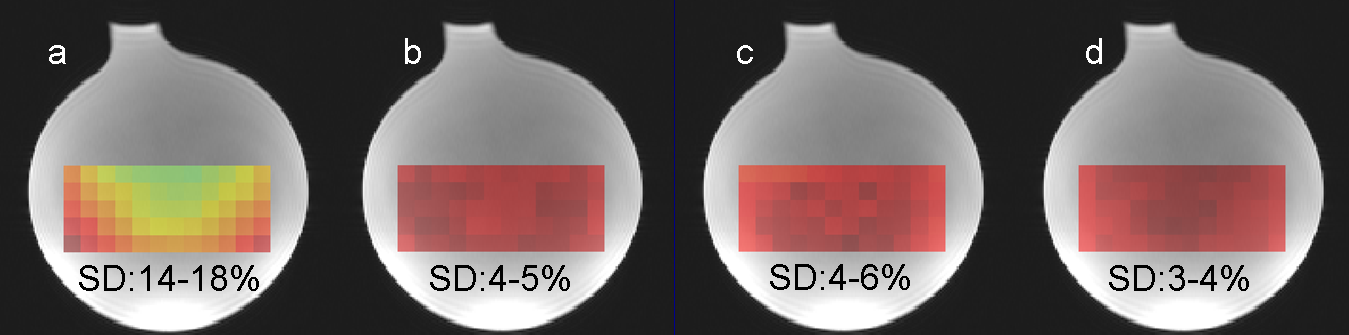
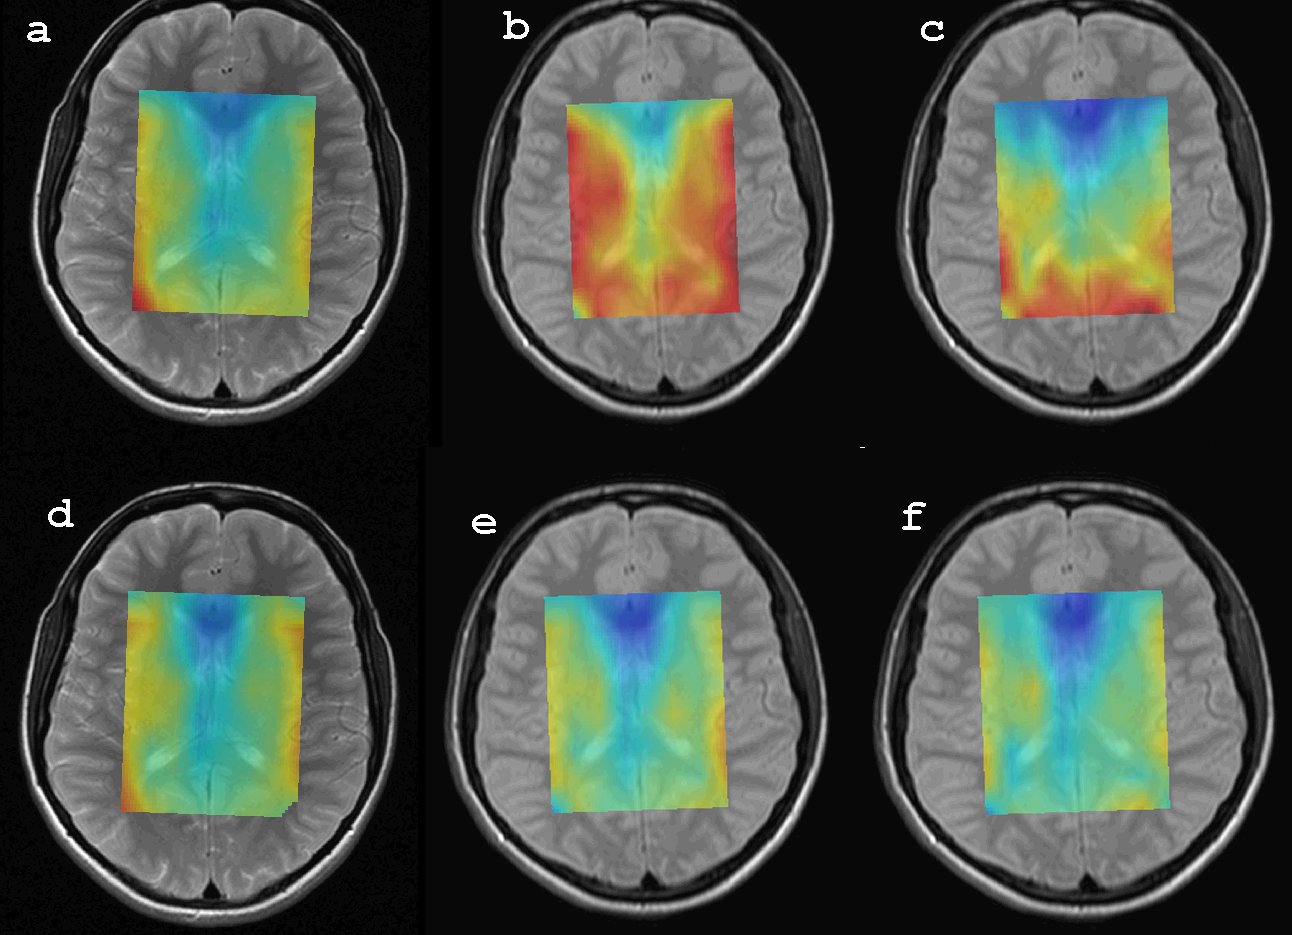
Local flip angles for data acquisition were reliably adjusted by exploiting scanner’s water suppression pulse setting. The flip angle distribution within the measured VOI was in a range of a few percent (3-4%). We also found a negligible influence of T1 weighting on the reference water measurement. With 8-channel array coil, our quantification method has shown to correct for inhomogeneous coil sensitivity profile, which was tested in a homogeneous phantom (Fig. 1), in healthy volunteers (Fig. 2) and demonstrated in patients with brain tumors. Phantom absolute concentrations acquired using 8-channel array coil have always shown a greater measure of dispersion if water was measured with fewer phase encoding steps than the metabolites.Discussion
Our results in vitro and in vivo confirm the potential of this method. Small flip angles used for water quantification make the method sensitive to excitation pulse angles, which have to be set up locally. The short TE and TR of the sequence avoids table value corrections for water relaxation, as in the method of Gasparovic et al.5 Water segmentation suggested by these authors could be a further improvement to the accuracy of our data evaluation. We believe that the time-efficient collection of the same-resolution water data by our method would enable a more precise metabolite quantification even in previously described methods.4, 5Conclusion
Our method has a potential for robust and easily implemented absolute quantification of 2- and 3-dimensional 1H MRSI data in vivo, even with multiarray coils used for signal acquisition.Acknowledgements
This work was supported by the Slovak Research and Development Agency under the contract no. APVV-14-0088, and by the project „Biomedical Center Martin“, ITMS code: 26220220187, co-financed from EU sources.References
1. Jiru F, Skoch A, Wagnerova D, et al. JSIPRO - Analysis tool for magnetic resonance spectroscopic imaging. Comput Meth Prog Bio. 2013; 112 (1): 173-188.
2. Provencher SW. Automatic quantitation of localized in vivo 1H spectra with LCModel. NMR Biomed. 2001; 14 (4): 260-264.
3. Naressi A, Couturier C, Devos JM, et al. Java-based graphical user interface for the MRUI quantitation package. Magn Reson Mater Phy. 2001; 12 (2-3): 141-52.
4. Wiebenga OT, Klauser AM, Nagtegaal GJA, et al. Longitudinal absolute metabolite quantification of white and gray matter regions in healthy controls using proton MR spectroscopic imaging. NMR Biomed. 2014; 27 (3): 304-311.
5. Gasparovic C, Song T, Devier D, et al. Use of tissue water as a concentration reference for proton spectroscopic imaging. Magn Reson Med. 2006; 55 (6): 1219-1226.
Figures