5480
Spectral quality: rosette spectroscopic imaging in human brain at 3T1Radiology, University of Pittsburgh, Pittsburgh, PA, United States, 2Siemens Medical Systems, 3MRRC, University of Pittsburgh, Pittsburgh, PA
Synopsis
Highly efficient sampling strategies based on gradient trajectories can accelerate MRSI studies by 1-2 orders of magnitude compared to conventional acquisitions. However, increasing acceleration and gradient slew rates commonly result in a predictable decline in spectral quality. This report uses rosette trajectory spectroscopic imaging studies to assess how spectral quality and Cramer Rao lower bounds influence how sensitive the MRSI and metabolite ratios are to the expected variation of tissue gray matter.
Introduction
Highly efficient sampling strategies based on gradient trajectories can accelerate MRSI studies by 1-2 orders of magnitude compared to conventional acquisitions (1,2). However, increasing acceleration and gradient slew rates commonly result in a predictable decline in spectral quality, which is a complex parameter that is estimated by the Cramer Rao lower bound CRLB in automated analysis packages (3). For MRSI studies, the concentration of many metabolites are variable with tissue content. Thus accuracy for abnormality detection can be improved in studies that traverse large brain regions by confidence interval testing with gray matter linear regressions (4). In these analyses, the size of the standard error of regression determines the ability to detect differences between white, gray matter and to detect pathology. In this report we consider how spectral quality and CRLB influence the standard error (SE) of the regression. This is done using a rosette trajectory, which is advantageous for its flexibility for variable resolution and acquisition time (5). To provide a range of spectral quality, we implement 4 trajectories with similar sampling volumes of 0.4cc (10x10x4) but with varying duration to achieve varying levels of SNR. The spectral assessment used a tissue based inclusion criterion of 40% total brain in order to evaluate voxels in the neocortical ribbon.Methods
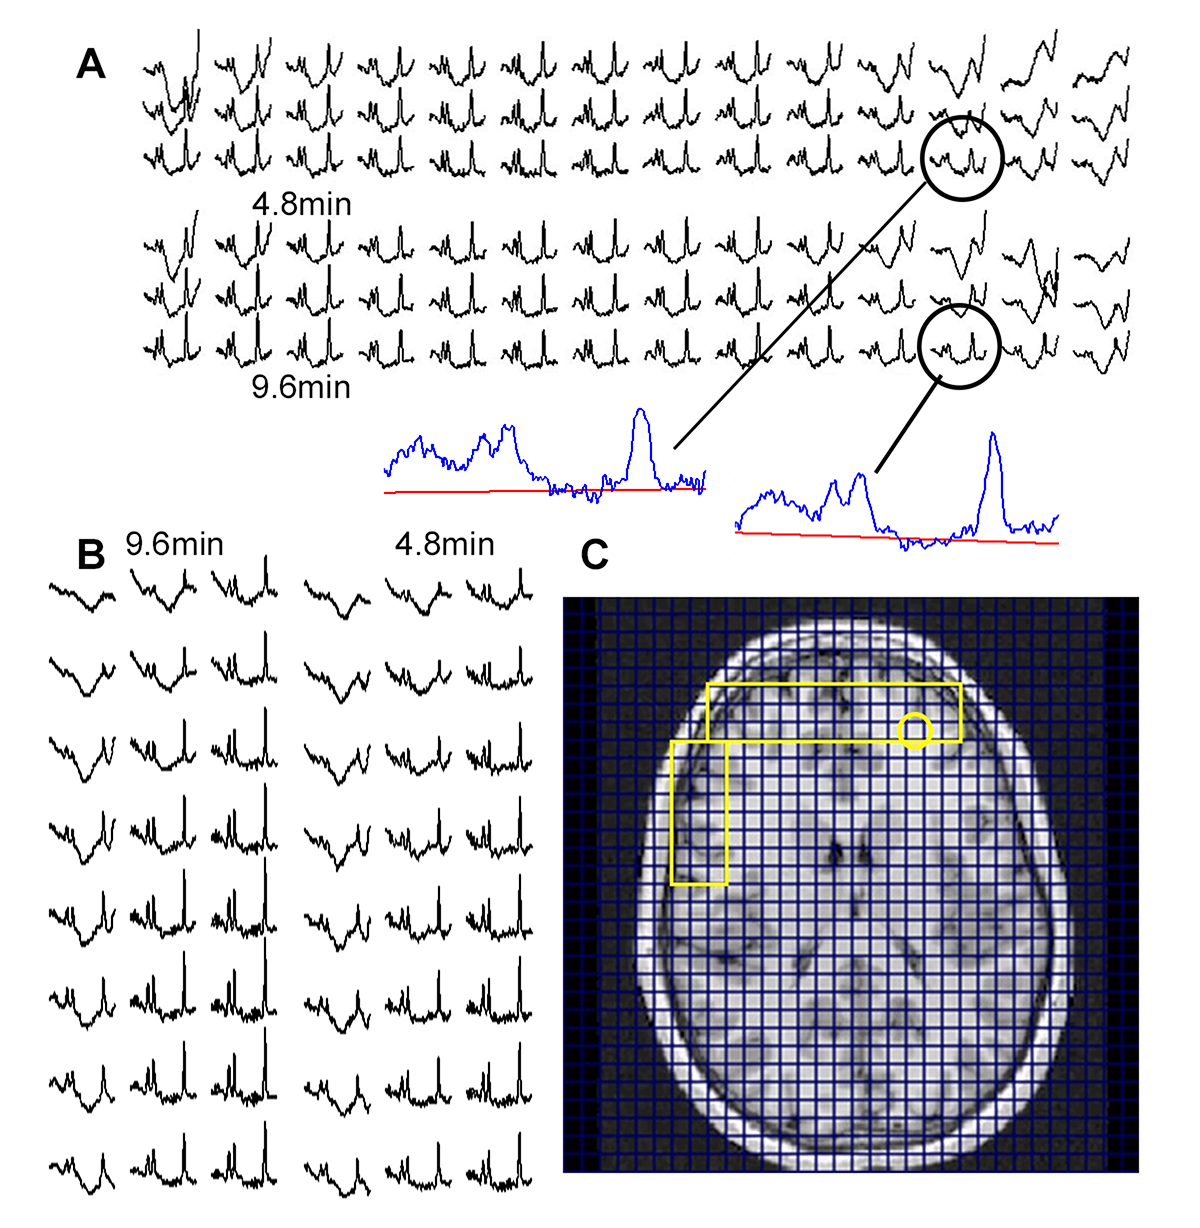
A Siemens (Erlangen, Germany) 3T Trio system with a 32 channel head coil was used for all studies. 3D rosette moderate echo (TE40ms, TR 2s) spectroscopic imaging (RSI) data were acquired over 20x20x12 matrix, FOV 20x20x4.8, spectral width of 1250Hz. Localization over the fronto-parietal temporal lobes was performed using a 40mm slab selective excitation in addition to conventional longitudinal phase encoding and in-plane rosette encoding. Water suppression was performed using a numerically optimized semi-selective frequency refocusing pulse and a narrow band adiabatic inversion pulse and delay. A non-selective adiabatic inversion pulse with optimized inversion recovery time is used for lipid suppression. Four trajectories were applied to achieve 9.6, 6, 4.8 and 2.4min acquisitions. For the 9.6min acquisition, Gmax=4.6mT/m, Smax = 36mT/m/ms, Nsh=24, while these were Gmax=8.5/9.8/11.5 mT/m, Smax=80/100/130 mT/m/ms with Nsh=15/12/6 shots/partition (6, 4.8, 2.4min respectively). Tissue segmentation and parcellation was performed on whole brain MP2RAGE images using the Freesurfer pipeline. As performed with 4 subjects, performance was evaluated based on efficiency of retained pixels and SE of the Cr/NA regression to gray matter content (Fig. 2). LCM was used for spectral analysis and an estimate of the CRLB for the Cr/NA and Ch/NA ratios was calculated from the individual CR values and amplitudes assuming no interactions.Results
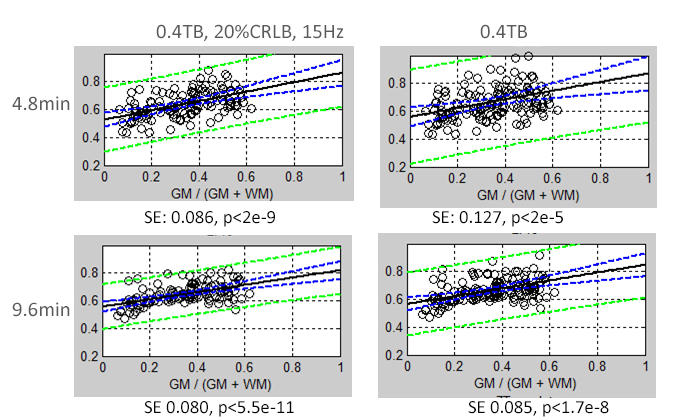
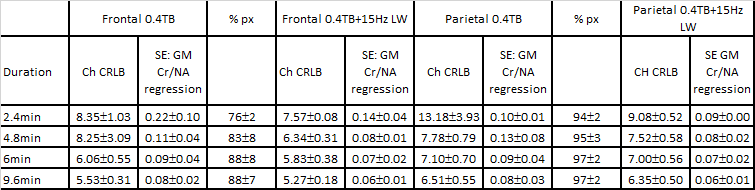
Fig. 1 presents sample 9.6 and 4.8min data. Overall, SNR is greater in the 9.6min acquisition by 32±6%. In regression with fraction gray matter, Fig. 2 shows the increased SE of regression with the 4.8min versus 9.6min acquisition for a single subject. Using a >40% total brain (TB) filtering with and without a 15Hz linewidth filter, Table 1 shows the dependence of the choline CRLB, the standard error of Cr/NA regressions and the number of retained pixels with acquisition time in spectra from the frontal and parietal lobe parcels. As expected, these parameters improved with the longer acquisitions, with sizable improvements in the SE. At low SNR, the 15Hz linewidth filter resulted in ~25% loss of pixels, which is halved to 12% loss with high SNR acquisitions.Discussion
For spectroscopic imaging studies with effective voxel sizes of ~1cc or less, variations in voxel gray matter content can significantly alter metabolite levels and ratios. Regression analyses using the tissue content can substantially improve the identification of pathology, as well as enabling accurate evaluation without the need to co-register into common brain space for morphometric comparison. Sensitivity for the regression analysis depends however on the value of the standard error of the regression. The present data show that in studies that target the inclusion of voxels within the cortical ribbon, higher SNR and smaller CRLB achieve a higher rate of voxel inclusion, as shown for the frontal lobe. The improved standard error results in a smaller prediction interval (PI) to detect metabolic abnormalities, e.g., for Cr/NAA, a SE=0.06 gives a prediction sensitivity of ±20% for a voxel with a 50:50 mix of average gray and white matter while a SE=0.10 acquired in 4.8min, would require a ±33% change (0.40-0.80) to reach statistical significance.Acknowledgements
Supported by NIH EB011639, NS090417, NS081772References
1. Maudsley AA, Domenig C, Govind V, et al. Mapping of brain metabolite distributions by volumetric proton MR spectroscopic imaging (MRSI). Magn Reson Med. 2009 Mar;61(3):548-59.
2. Posse S, DeCarli C, Le Bihan D. Three-dimensional echo-planar MR spectroscopic imaging at short echo times in the human brain. Radiology 1994;192(3):733-738.
3. Cavassila S, Deval S, Huegen C, et al. Cramer-Rao bound expressions for parametric estimation of overlapping peaks: influence of prior knowledge. Journal of magnetic resonance 2000;143(2):311-320.
4. Hetherington HP, Pan JW, Mason GF, et al. Quantitative 1H spectroscopic imaging of human brain at 4.1 T using image segmentation. Magnetic resonance in medicine 1996;36(1):21-29.
5. Schirda CV, Tanase C, Boada FE. Rosette spectroscopic imaging: optimal parameters for alias-free, high sensitivity spectroscopic imaging. Journal of magnetic resonance imaging: JMRI 2009;29(6):1375-1385.
Figures