5477
Simple and general automatic quality control of 3D 1H MRSI data of the prostate using intrinsic spectral properties1Department of Radiology and Nuclear Medicine, Radboud university medical center, Nijmegen, Netherlands
Synopsis
Proton 3D MR spectroscopic imaging (MRSI) provides spatial metabolic information of the prostate for improved cancer detection, localization, and staging. Clinical application of MRSI of prostate requires automatic quality control of spectra. We propose Qratio, a ratio balancing constructive spectral components of choline and citrate signals with destructive elements of lipid signals, water residuals and noise. We demonstrate that Qratio can serve as a general, fast and automated tool for quality control of prostate MRSI data, independent of field strength (1.5-7T) and acquisition protocol. The Qratio can be displayed as maps and performs with an accuracy of 88±3% and AUC=0.93.
Introduction
Proton MR spectroscopic imaging (1H MRSI) of the prostate provides spatial metabolic information that can improve the diagnosis of prostate cancer1,2. Spectral quality may suffer from artifacts such as lipid signal contamination due to chemical shift displacement or broad line-widths and low SNR due to field inhomogeneities3. Clinical applications of MRSI demand a quality control (QC) step. However, visual QC of hundreds of spectra is limited by the availability of experts, subjectivity and time restrictions. Automated QC of MRSI has been developed using extracted spectral features and machine learning algorithms, but the number and complexity of the features restrict their use to specific data for a particular acquisition procedure and field strength4.
As clinical MRSI of the prostate is performed with different sequences and field strengths we propose a simpler and general automatic QC method using a quality ratio (Qratio) composed of a priori knowledge of relevant and artifactual or contaminating spectral components generally occurring in spectra obtained with different field strength and sequences.
Methods
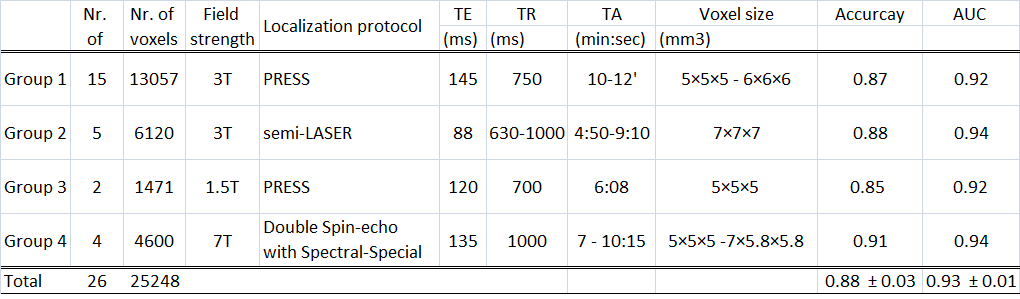
Patients suffering from prostate cancer (n=26) were measured on MR systems at 1.5, 3 and 7 T and with different acquisition protocols, and divided in four groups (Table 1). Visual inspection of spectra served as gold standard. For group 1, QC of a previous dataset based on consensus decision of four MR spectroscopists was used4. Groups 2, 3 and 4 were judged by one expert (experience>6 years) using the same rules for spectral QC as applied for group 1.
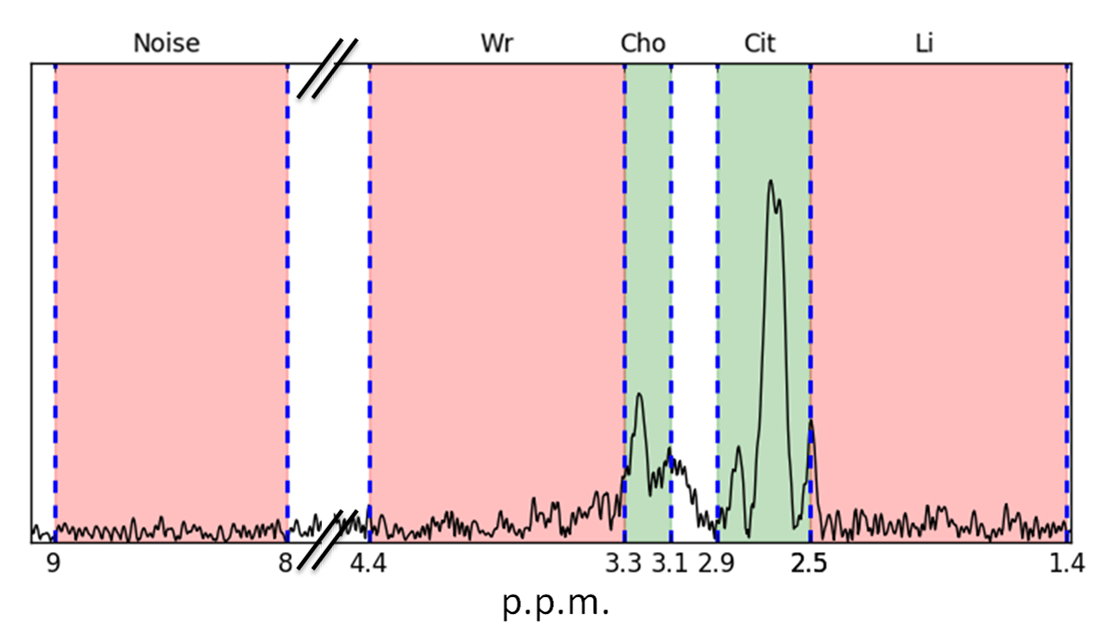
A Qratio was established relating the informative signals around the chemical shifts of choline (Cho) and citrate (Cit) to contaminating signals of lipids (Li), water residuals (Wr) and noise (Equation 1). An explorative data analysis revealed that the maxima of signals within certain regions determined spectral quality (Figure 1), more specifically we selected for Qratio the ppm ranges: 2.5-2.8 for Cit, 3.1-3.3 for Cho (and polyamines), 1.4-2.5 for Li, 3.3-4.4 for Wr, and 8-9 for noise.$$Q_{ratio}=\frac{Cit+Cho-Noise}{Cit+Cho +Li+Wr}\quad\quad\quad\quad\quad\quad(Cit,Cho,Li,Wr,Noise)\inⱤ^+\quad\quad\quad\quad(Equation\quad1)$$A subset of five patients of group 1 was used for a Qratio threshold calculation (development subset). This threshold was determined based on highest accuracy in spectral classification compared to the expert panel decision for the development subset. The remaining patients of group 1 and the datasets of groups 2, 3 and 4 were used to validate the transferability of the Qratio method to different acquisition protocols (validation subset) with expert labeling of the spectral quality as ground truth. The accuracy and area under the receiver operating characteristic curve (AUC) of the Qratio performance were calculated for each patient group (Table 1). Furthermore, binary (threshold-based) and probability quality maps were generated with the Qratio output for each voxel.
Results
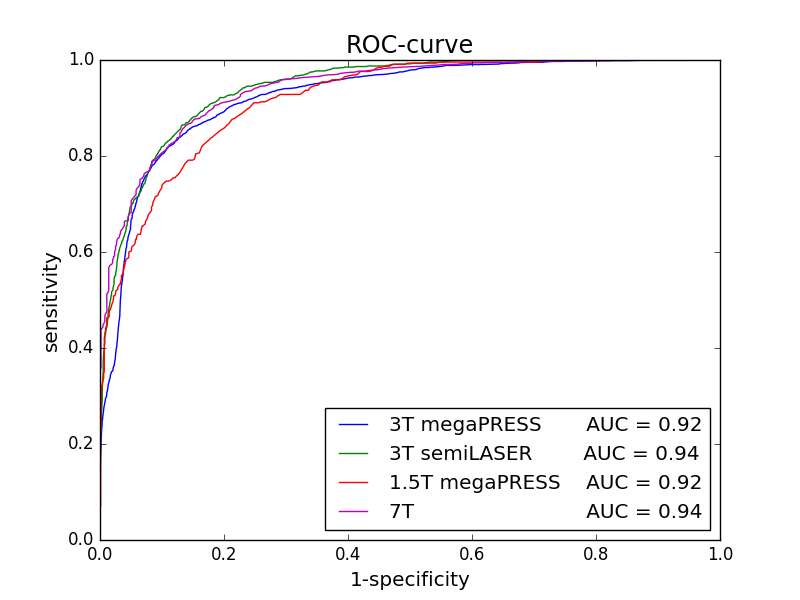
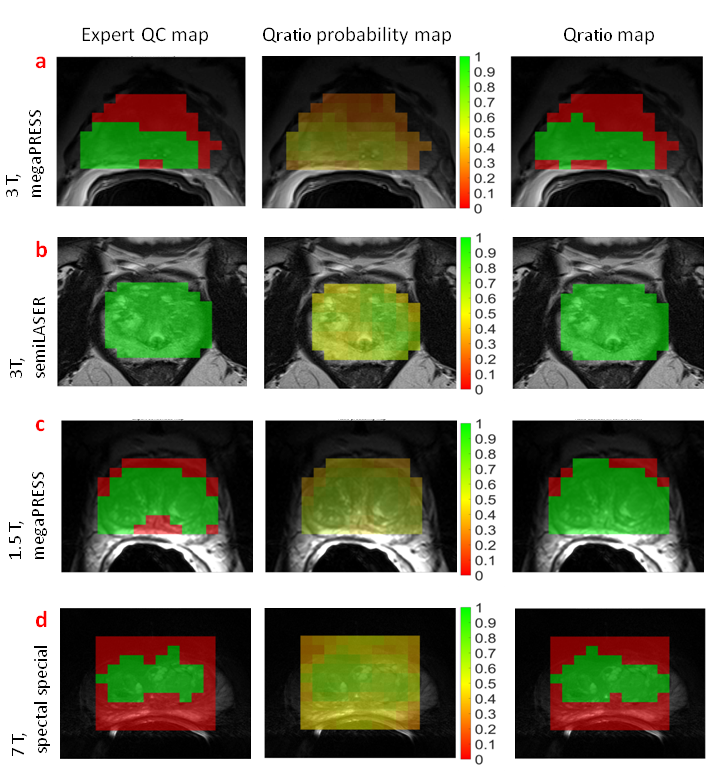
The automated Qratio classified 25248 spectra of 26 patients measured at different field strengths with different sequences into acceptable or unacceptable with an average accuracy of 88 ±3% (mean±std). Statistical analysis revealed an average AUC of 0.93 ±0.01 (mean±std) for the complete dataset (Figure 2). The Qratio did not reject more spectra than experts on average. The agreement of each possible pair of experts for spectral quality was 89 ±4% (mean±std). This was not significantly different from the average agreement between each expert and the Qratio for the entire Group 1 data, which was 87 ±4% (mean±std) (p-value=0.269). The performance of the Qratio QC is illustrated for each group with an MRSI slice of a patient (Figure 3). Unacceptable spectra are mainly localized outside or at the margins of the prostate. As binary classification for acceptable/unacceptable spectra may not always be sufficient enough in clinical practice, we also provide a Qratio probability map (Figure 3,middle column).Discussion and Conclusion
We introduce a simple automated QC method to classify the quality of spectra of the prostate independent of field strength and acquisition sequence as applied for human MRSI. Generally, feature extraction methods are restricted to a specific acquisition protocol. These methods rely on complete and complex spectral patterns resulting in over-fitting5,6. Whereas, the Qratio does not suffer from over-fitting as it depends on simple spectral properties. The Qratio provides automatic QC of MRSI spectra with a high accuracy of 88 ±3% (mean±std) and AUC=0.93 by only using intensities of 5 maxima within spectral regions of interest. The region selection makes the procedure also tolerant to small frequency shifts between spectra. Finally, we present a Qratio probability as a measure for the spectral quality of every voxel, which enables a more subtle evaluation of spectral quality as opposed to a threshold. To conclude, the Qratio is a generally applicable automatic tool for QC of prostate MRSI data.Acknowledgements
This project received funding from the European Union’s Seventh Program for research, Technological Development and Demonstration under Grant Agreement No ITN-GA-2013-316679.References
1. Hoeks, C.M., et al., Prostate cancer: multiparametric MR imaging for detection, localization, and staging. Radiology, 2011. 261(1): p. 46-66.
2. Scheenen, T.W., et al., Discriminating cancer from noncancer tissue in the prostate by 3-dimensional proton magnetic resonance spectroscopic imaging: a prospective multicenter validation study. Invest Radiol, 2011. 46(1): p. 25-33.
3. Kreis, R., Issues of spectral quality in clinical H-1-magnetic resonance spectroscopy and a gallery of artifacts. NMR Biomed, 2004. 17(6): p. 361-381.
4. Wright, A.J., et al., Quality control of prostate 1 H MRSI data. NMR Biomed, 2013. 26(2): p. 193-203.
5. Vapnik, V.N., An overview of statistical learning theory. IEEE Trans Neural Netw, 1999. 10(5): p. 988-99.
6. Hyvärinen A., S.J., Vigário R. . Spikes and bumps: artefacts generated by independent component analysis with insufficient sample size. in Proceedings of the International Workshop on Independent Component Analysis and Signal Separation. 1999. Alois, France.
Figures