5476
Absolute quantification of brain metabolites by 1H-MRSI using gradient echo imaging of ~2s as a concentration reference: initial findings1High Field MR Centre, Medical University of Vienna, Vienna, Austria, 2Christian Doppler Laboratory for Clinical Molecular MR Imaging, Vienna, Austria
Synopsis
The unsuppressed internal water signal is a standard reference method used for quantification of brain metabolites in 1H-MRSI, however it requires additional water unsuppressed acquisition, which is in case of MRSI time demanding. Therefore we compared the performance of water signal reference acquired with unsuppressed MRSI and with ~2s long gradient echo imaging integrated into MRSI sequence. Our findings indicates that gradient echo imaging can be used as a concentration reference for 1H-MRSI.
Purpose
The unsuppressed internal water signal is a gold standard for purpose of brain metabolites quantification in proton magnetic resonance spectroscopy. The main benefit is that some potential sources of errors are eliminated (e.g. coil loading, RF homogeneity), since both signals are acquired from the same tissue and in essentially the same way. Nevertheless few important considerations are still necessary, in particular different compartment T1 relaxation times and partial volume effects1. On the contrary, the acquisition of additional water unsuppressed spectra prolongs the measurement time, which is in case of spectroscopic imaging time demanding. Therefore we aimed to acquire the water signal with three different approaches (unsuppressed MRSI with two different TRs and gradient echo imaging) and compared their performance.Methods
In vivo measurements were performed on a 7T MAGNETOM scanner (Siemens, Erlangen, Germany) with a 32-channel head coil (transmit and receive). Spectroscopic data were obtained via a 1H-MRSI sequence with ultra-short acquisition delay2,3. The sequence parameters were: TE* = 1.3 ms, TR = 600 ms, FA = 45°, 64×64 phase encoding steps, 2048 spectral readout points, 6000 Hz bandwidth, FOV = 220×220×8 mm3, nominal voxel size: 3.4×3.4×8 mm3 resulting in an acquisition time of ~30 min. Water reference images were acquired in three different ways:
(1) A matching longer MRSI scan (W512) (TA= 2:07 min) acquired with TR = 200 ms, FA = 27°, 512 spectral readout points, 10-fold acceleration (2D-Caipirinha4) and no water suppression.
(2) A matching shortened scan (W128) (TA = 0:25 min) acquired with TR = 34 ms, FA = 12°, 128 spectral points, 10-fold acceleration. The other parameters were the same as for the MRSI measurement.
(3) GRE imaging acquired in ~2 sec (TR = 10 ms, FA = 7°) integrated into the MRSI sequence for MUSICAL5 coil combination and parallel imaging reconstruction.
All the data were processed with an in-house pipeline6 using Matlab and LCModel.
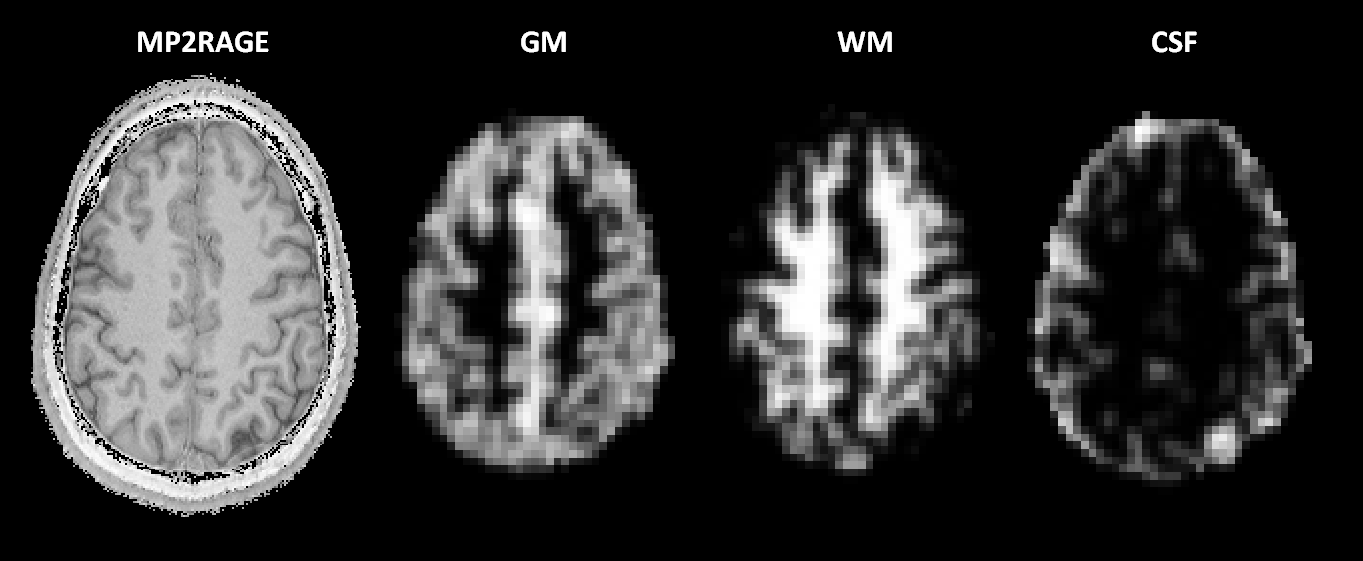
T1-weighted MP2RAGE images were segmented into GM, WM and CSF using FAST (FSL 5.0). Afterwards, the MRI-resolution segmented maps were Fourier transformed to k-space and zero-filled to MRSI resolution to match the PSF of the MRSI data, before Fourier transforming them back to image-space. Thereby we obtained tissue maps in MRSI resolution.
For computing different compartments relaxation attenuation factors we use the T1 values from literature7.
Numerical simulations for a range of T1s (water: 1.2-2s (WM-GM); metabolites: 1.5-1.9s (Cho-NAA)) and assuming a ±20% spatially dependent flip angle (FA) error were performed to estimate the worst case and susceptibility of the water-corrected metabolic maps to FA and T1 variability.
Results
Our simulations showed that taking into account differences in saturation due to spatial FA variations have far lower effect on the correction factors than wrong assumptions about literature T1 values (Table 1). (The simulations were further confirmed by our results showing only negligible effect of actual FA variations on correction factors (Figure 4)).
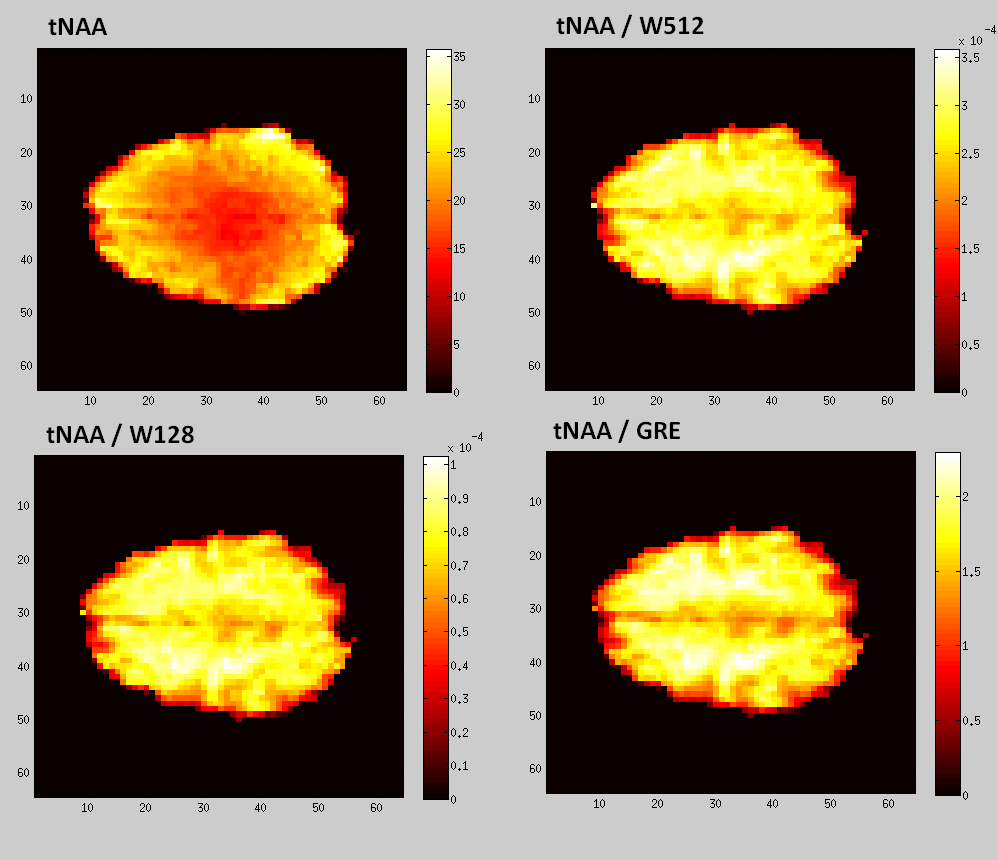
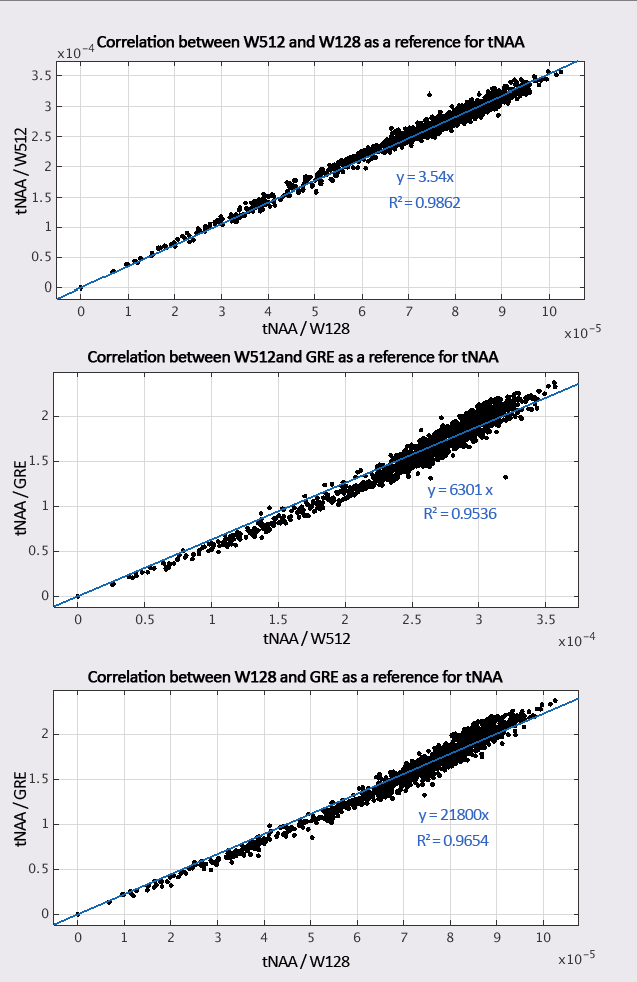
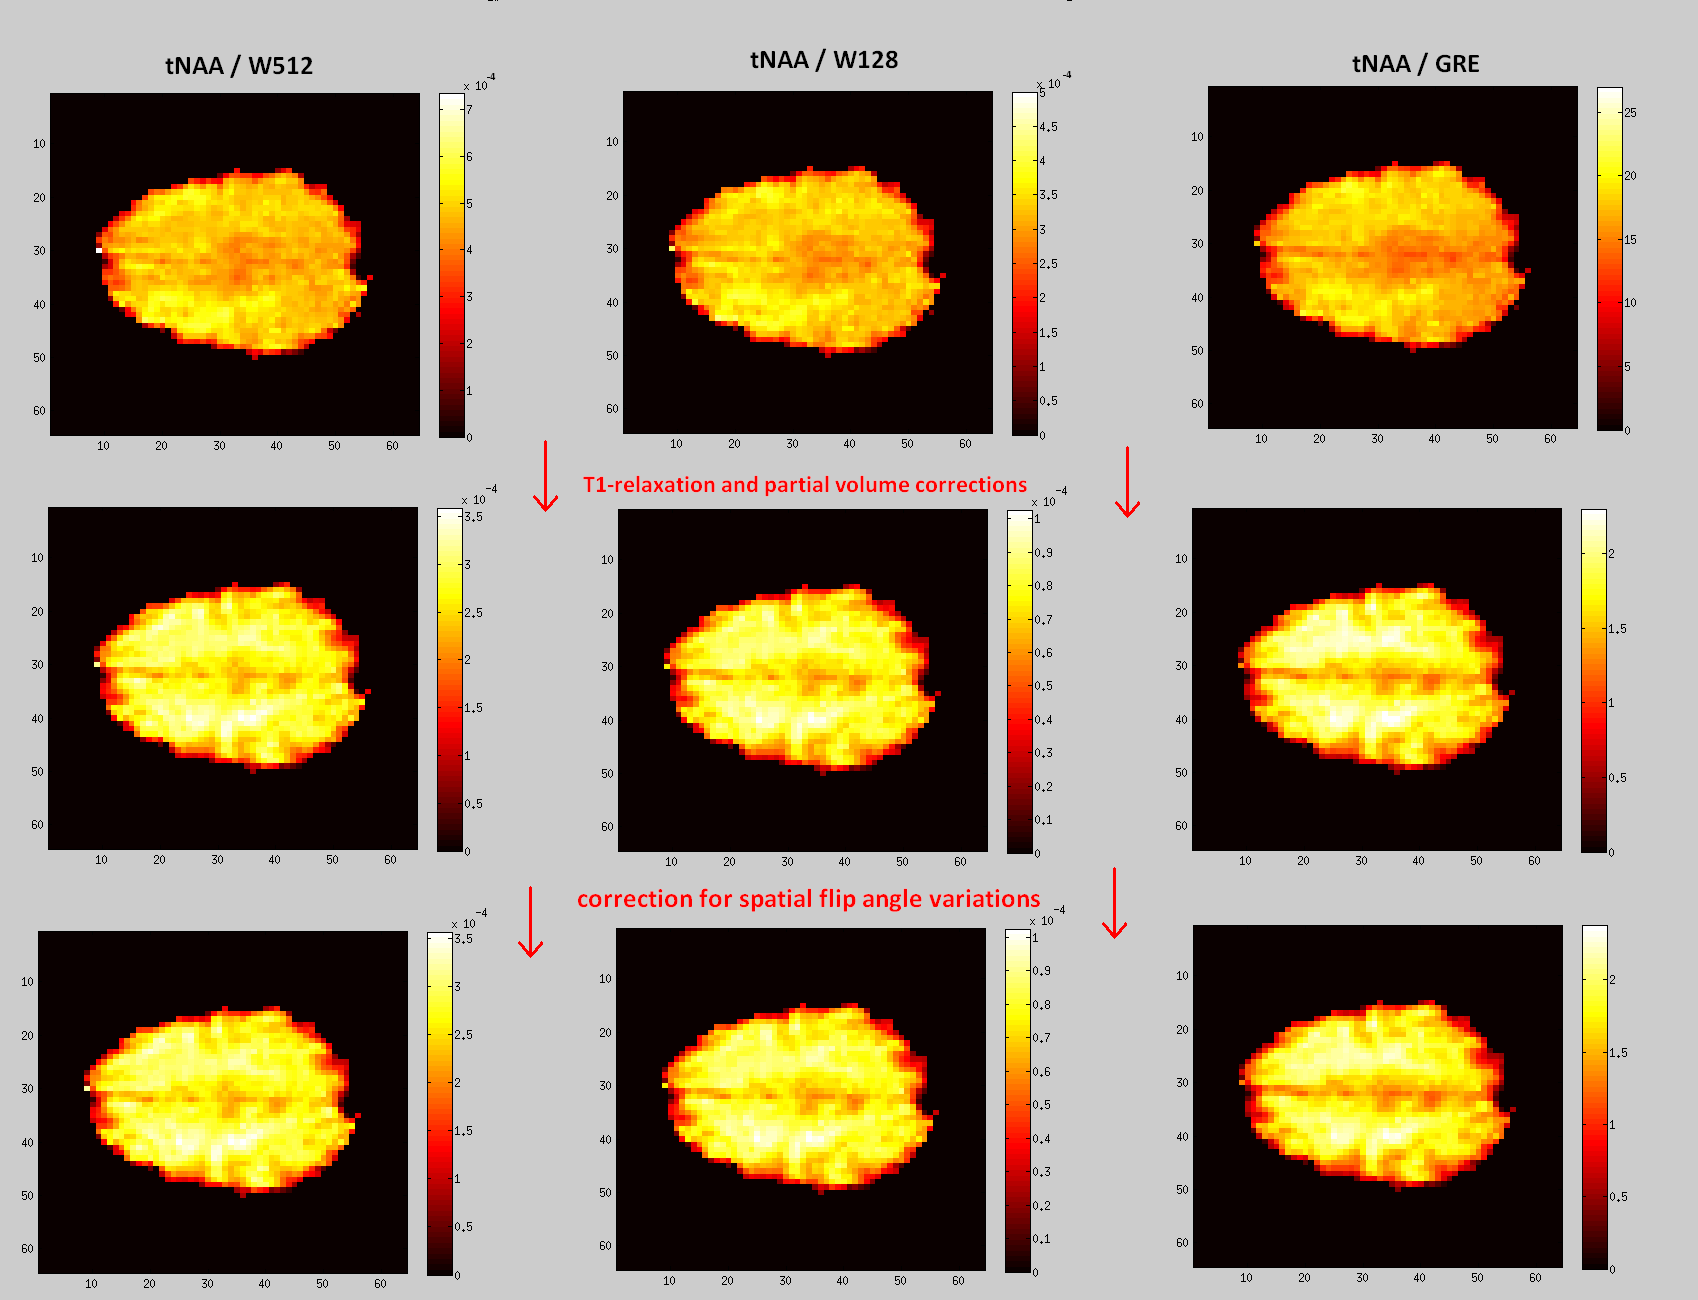
After performing the brain segmentation into volume fractions of GM, WM and CSF (Figure 1) and calculating the molal water fractions by accounting for the relative densities of MR-visible water (0.78, 0.65 and 0.97 for GM, WM and CSF, respectively)1 we subsequently performed the T1-relaxation and spatial FA variability (using acquired B1 map) corrections for each acquisition. Metabolic maps of tNAA without reference and with three different water reference approaches are displayed in Figure 2 demonstrating their equivalency and thus good performance of GRE as a metabolite reference for MRSI. These findings were further confirmed by correlation analysis showing only differences in scaling (Figure 3).
Discussion
Absolute quantification is possible with an accelerated MRSI scan without water suppression and an acquisition time of 2:07min or even a gradient echo imaging sequence of only ~2s if the global scaling differences are resolved. These may arise from different acquisition times, but further investigation needs to be done. However GRE imaging can replace the additional MRSI acquisition without water suppression and provide reliable metabolic ratios to water in institutional units.
In simulation we investigated the impact of inaccurate values of T1 relaxation times on correction factors which appeared to be much larger than the impact of spatial flip angle variances. In order to obtain absolute concentration of metabolites this has to be considered carefully.
Conclusion
Signal of tissue water as a concentration reference for proton magnetic resonance spectroscopic imaging does not need to be acquired in additional MRSI scan. For this purpose a gradient echo imaging of ~2s integrated into the MRSI sequence can be used, however providing concentrations of metabolites in mM values still requires more acquaintance.Acknowledgements
This study was supported by the Austrian Science Fund (FWF): KLI-61 and the FFG Bridge Early Stage Grant #846505.References
1. Gasparovic C et al. MRM 2006;55:1219-26.
2. Bogner et al. NMR in Biomed. 2012;25(6):873-82.
3. Hangel G et al. ISMRM 24 (2016):0387 and NeuroImage 2016, doi: 10.1016/j.neuroimage.2016.10.043.
4. Strasser et al. MRM 2016, early view
5. Strasser et al. NMR in Biomed 2013; 26(12): 1796-805.
6. Považan et al., Proc. Intl. Soc. MRM 23 (2015): 1973.
7. Xin et al. MRM 2013;69:931-6.
Figures
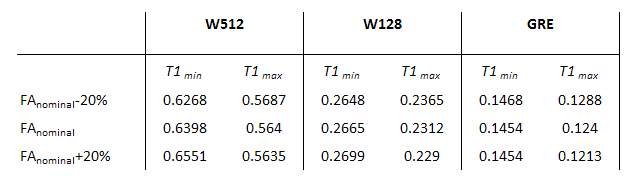
Table 1. Simulations for different T1 values of water (1.2-2s) and metabolites (1.5-1.9s) and different values of FA (±20%) showed larger effect of T1 variability on resultant relaxation attenuation factor than spatial FA variations.