5475
Spectral-Dephasing based Non-Local Means for Spatially Adaptive Denoising in 3D-MRSI1Technical University of Munich, Garching, Germany, 2GE Global Research, Munich, Germany
Synopsis
We present a data-driven technique for denoising 3D Magnetic Resonance Spectroscopic Imaging (MRSI) data. Our proposed method involves a novel spectral de-phasing and re-phasing approach which increases the phase dimension of the spectra to deal with the arbitrary complex phase in the data. This is coupled with an anisotropic non local means (NLM) filter-based pattern-recognition across the multi-slice data to select similar spectra patches having a similar phase for denoising. We show that our method leads to a mean SNR improvement by an average factor of 4.5 while preserving the spectral resolution of the metabolites.
PURPOSE
Magnetic Resonance Spectroscopic Imaging (MRSI) is a clinical imaging tool which is used for generating metabolic maps of tissues in-vivo. However, long acquisition times, poor SNR and low spatial resolution often lead to poor metabolic quantification. Conventional denoising-methods such as apodization, wavelet transforms4 and NLM1,3 do not work effectively as they induce smoothing artifacts and do not account for the arbitrary complex-phase induced in the spectra during acquisition. This work proposes a spatially-adaptive denoising of 3D-MRSI data by using a frequency-phase NLM1,3 technique. A multi-slice data, having not more than 3 successive slices to avoid significant changes in the MR spectra data, would increase the redundant spectral information available as compared to a single-slice data. The main contributions of our method are: 1) robustness to arbitrary phase-shifts as the phase-angles range from $$$[0,2\pi]$$$ for all spectral signals, and 2) adaptive to the multi-slice imaging-data as the spectra are denoised by relying on similar signals with a similar phase instead of pre-defined prior assumptions.METHODS
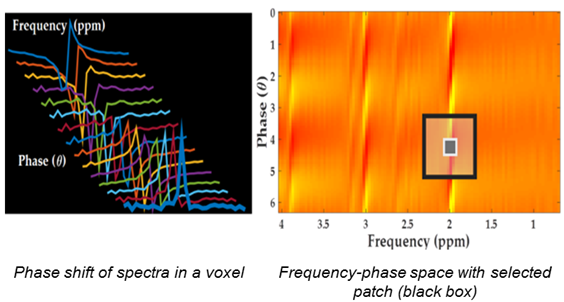
Spectral Dephasing: The complex spectra in each voxel underwent a phase-shift by a pre-defined set of phase-angles $$$[0,2\pi]$$$. This increased the phase-dimension of the spectra thereby generating a 2D frequency-phase space (Figure 1). Spectral patches from this space were then extracted for denoising.
$$S^\Theta(\omega) = \mathcal{F}(S(t)*e^{-i\Theta})$$
Anisotropic NLM: An anisotropic variant of the NLM1,3 was used to search spatially for similar spectral-patches with similar phase across the 3-slices but for a specific metabolite-frequency. The patch-size used was: $$$1\times1\times1$$$ and $$$3\times3\times3$$$, with the search region size: $$$\forall$$$ voxels x $$$\forall$$$ angles x $$$\forall$$$ slices. A weighted average of all similar patches was taken to give a denoised patch – a patch with higher similarity was assigned a higher weight.
$$S_1^\Theta(\omega) =NLM(S^\Theta(\omega))$$
Spectral Rephasing: After obtaining the denoised frequency-phase spectral space for each voxel, an inverse phase-shift was performed to reverse the effects of dephasing. The spectra generated were then averaged to obtain a single, complex denoised spectra.
$$S_1^\Theta(t) =\mathcal{F}^{-1}(S_1^\Theta(\omega))$$
$$\hat{S}(\omega) = \mathcal{F}(S_1^\Theta(t)*e^{i\Theta}),\forall\Theta$$
Data acquisition: We tested our method on a 3D brain MRSI data of a healthy human volunteer using a 3T-750w system (GE-Healthcare) with a 12-channel head receive coil. PRESS localization, CHESS water suppression and EPSI readout were used as part of the sequence. The acquisition parameters used were: FOV = $$$220\times220\times80$$$ mm3, voxel size = $$$10\times10\times10$$$ mm3, TE/TR = 144/1000 ms and spectral bandwidth = 1kHz and 8 slices. The acquired data was zero-filled and reconstructed to generate a grid of $$$40\times40$$$ voxels and 400 spectral points. The test data used were: single-slice 2D and three successive slices of the 3D data with 3 averages.
RESULTS
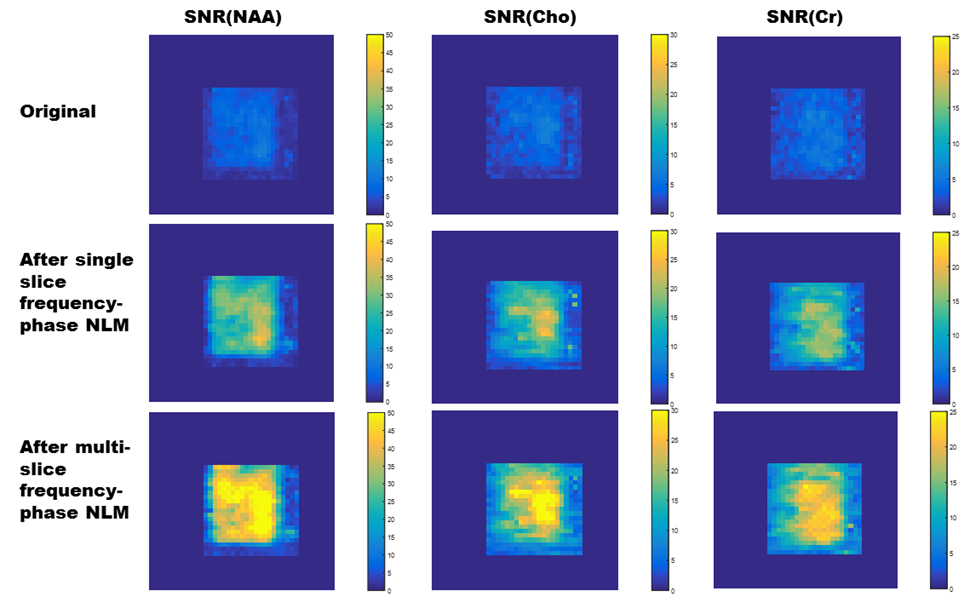
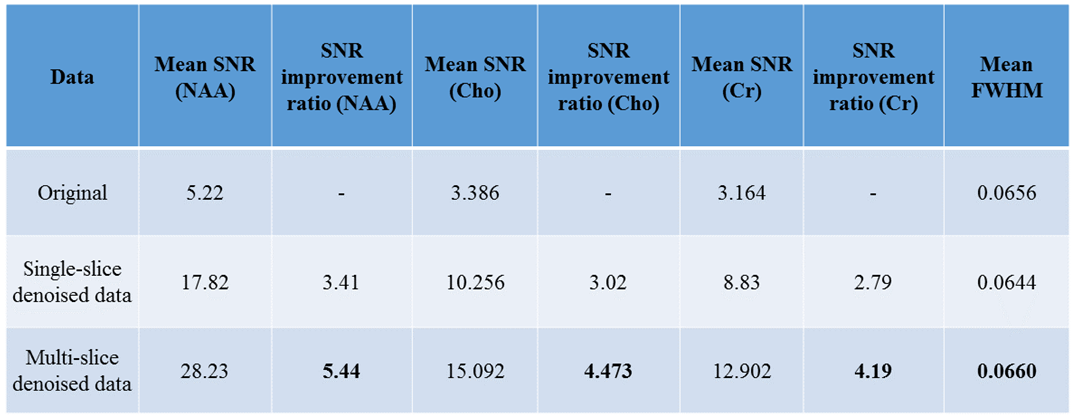
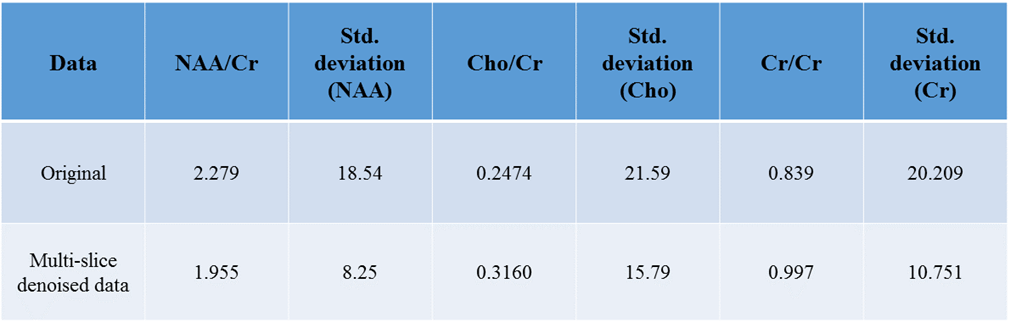
The SNR of the different metabolites was calculated as the ratio between the maximum value of the real metabolite peak respectively, versus the standard deviation of the noise signal at the negative end of the ppm-scale after baseline correction. The spectral-resolution (measured by calculating the Full-Width Half Maximum (FWHM) of the water peak) and concentration-estimates of the metabolites were measured using the LCModel2. Figure 3 shows the SNR maps for the original, the single slice and multi-slice data post-frequency-phase NLM while Table 1 shows the corresponding SNR values. Table 2 evidences the improvement in concentration estimates and reduction in standard-deviation error after applying our method.DISCUSSION
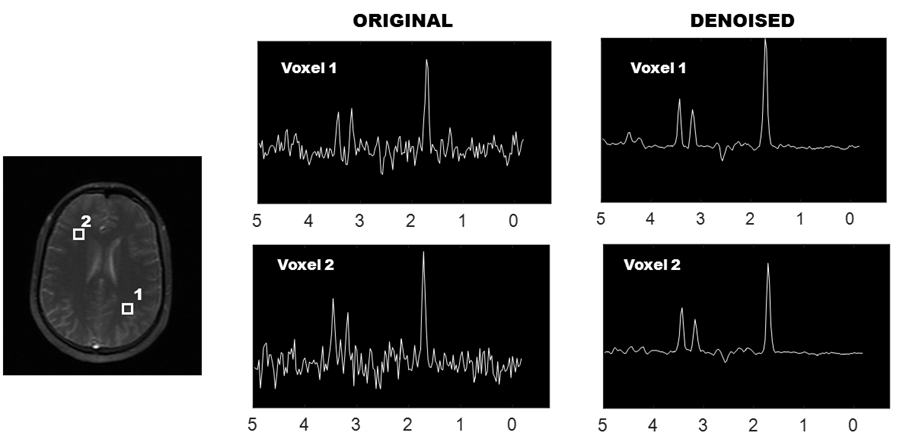
We account for different spectral phase-angles and apply the proposed method to denoise the data. While there may be a risk of incorporating spectra from other slices, our pattern-recognition method successfully avoids this by assigning higher weights to similar-spectra. This is evident by the lack of contamination in the CSF or any abnormal increase in concentration-estimates. Figure 2 shows the original and denoised spectra for sample voxels using the proposed method while Figure 3 shows the SNR-maps for NAA, Cho and Cr. The multi-slice data exhibits a higher improvement in SNR than the single-slice data due to more redundant spectral information available from multiple-slices. The improvement in mean-SNR for all major metabolites while preserving the FWHM (Table 1) indicates a consistent performance by our method. Table 2 shows an improvement in concentration-estimates for NAA, Cho and Cr and a reduced standard deviation-error after applying frequency-phase NLM.CONCLUSIONS
We propose a denoising method for multi-slice 3D-MRSI data using anisotropic-NLM and show the added benefit of incorporating complex phase information in the patches and using redundant information from successive slices for denoising. This enables a mean-SNR improvement of approximately 4.5 while retaining spectral-resolution and improving the concentration-estimates of the metabolites. Further improvements would involve using computationally-efficient methods to improve the implementation speed and quantify lower-concentration metabolites.Acknowledgements
The research leading to these results has received funding from the European Union's H2020 Framework Programme (H2020-MSCA-ITN-2014) under grant agreement no. 642685 MacSeNet.References
[1] Buades et al. “A non local algorithm for image denoising”. CVP 2005.
[2] Provencher et al. “Estimation of metabolite concentrations from localized in vivo proton NMR spectra”. Magn Reson Med 1993.
[3] Coupe et al. “ An optimized blockwise nonlocal means denoising filter for 3-D magnetic resonance images”. IEEE Trans Med Imaging 2011.
[4] Nguyen et al. “Denoising MR Spectroscopic Imaging Data With Low-Rank Approximations”. IEEE Trans Biomed Eng 2013.
Figures