5474
Prior-Knowledge Quantitation of Glutamate, Glutamine, GABA, and Glutathione using Covariance J-resolved spectroscopy1Radiological Sciences, University of California - Los Angeles, Los Angeles, CA, United States
Synopsis
The two dimensional J-resolved spectroscopy technique is capable of resolving many metabolites in vivo from a volume of interest. However, the spectral resolution along the indirect dimension is generally very poor in these acquisitions. One solution is to apply a covariance transformation along the indirect dimension to yield a resulting Covariance J-resolved (CovJ) spectrum with high spectral resolution. While spectral resolution is enhanced, currently there are no methods available to fit the non-linear aspects of the covariance reconstruction. Here, we have developed a non-linear fitting algorithm capable of yielding Glutamate, Glutamine, GABA, and Glutathione concentrations in vivo using CovJ spectra.
Introduction
Magnetic resonance spectroscopy (MRS) is a powerful tool capable of discerning biochemical changes in several pathologies1. One technique capable of disentangling important overlapping metabolic signals is the two-dimensional (2D) J-resolved spectroscopy (JPRESS) sequence2-4. Due to the long acquisition times, the JPRESS indirect spectral dimension has very poor spectral resolution. A covariance transformation5 can be used to improve spectral resolution along this dimension, but there are currently no means to quantify high resolution Covariance J-resolved (CovJ) spectra. A novel prior-knowledge based fitting algorithm, termed Covariance Spectral Evaluation of 1H Acquisitions using Representative prior-knowledge (Cov-SEHAR), was developed in order to determine the concentrations of key metabolites in vivo: Glutamate (Glu), Glutamine (Gln), $$$\gamma$$$-Aminobutyric acid (GABA), and Glutathione (GSH).Methods
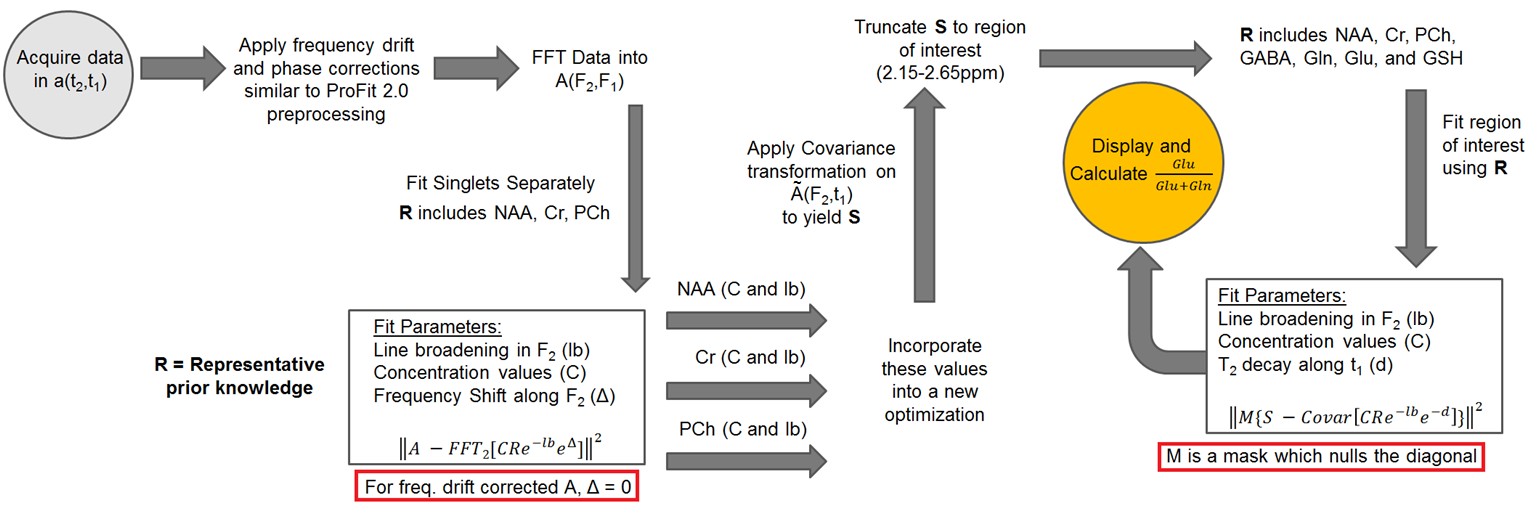
Processing: From a JPRESS experiment4, an acquired data set is stored as a 2D matrix, $$$a(t_2,t_1)$$$, where $$$t_2$$$ and $$$t_1$$$ are the directly and indirectly sampled temporal dimensions, respectively. JPRESS data were processed as previously discussed3. CovJ spectra were produced by applying the covariance transformation in the mixed spectral-temporal domain, $$$\widetilde{A}(F_2,t_1)$$$, where $$$F_2$$$ is the direct spectral domain. The resulting CovJ spectrum, $$$S$$$, can be found using5: $$S = [Re(\widetilde{A}) \cdot Re(\widetilde{A}^T)]^{\frac{1}{2}} + [Im(\widetilde{A}) \cdot Im(\widetilde{A}^T)]^{\frac{1}{2}}$$ $$$Re(\widetilde{A})$$$ and $$$Im(\widetilde{A})$$$ are the real and imaginary parts of $$$\widetilde{A}$$$, respectively. $$$S$$$ is a square matrix and the indirect CovJ spectral dimension, $$$F_1’$$$, has the same spectral bandwidth and spectral resolution as $$$F_2$$$.
Cov-SEHAR algorithm: A diagram explaining the fitting process can be seen in Figure 1. Corrections are applied to the acquired data using ProFit 2.0 preprocessing for phasing and frequency drifts6,7. First, the algorithm fits the concentrations and line-broadening of the JPRESS singlet resonances of N-acetyl aspartate (NAA), Creatine 3.0 (Cr3.0), and Phosphocholine (PCh). The second fit uses these values and a specific part of the CovJ spectrum, the 2.15 – 2.65ppm region, to evaluate Glu, Gln, GABA, and GSH. Since the cross-peaks are most interesting for this evaluation, the diagonal signals are nulled using a spectral mask. The second fit also assigns each metabolite a damping factor, or $$$T_2$$$* value, along the $$$t_1$$$ dimension. The objective functions in Figure 1 are minimized by using a built-in, non-linear MATLAB solver, lsqnonlin. Finally, scaling factors accounting for proton numbers are utilized to give Glu, Gln, GABA, and GSH values with respect to the total signal in that area (Glu+Gln+GABA+GSH).
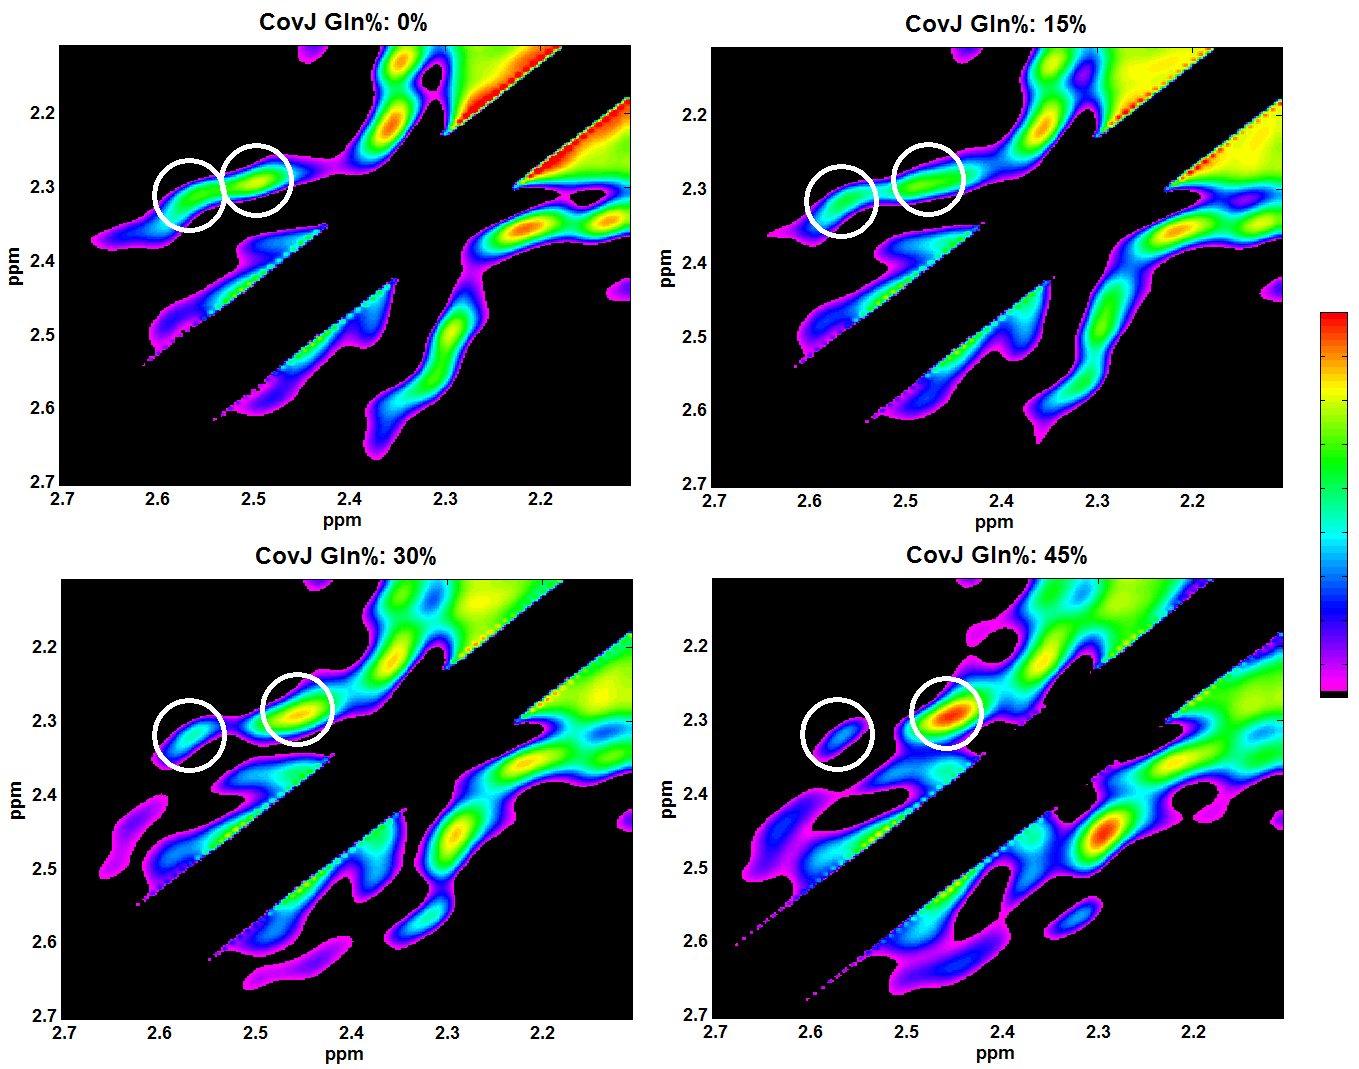
Simulations: Maximum-echo sampled4 J-resolved prior-knowledge for NAA, Cr3.0, PCh, Glu, Gln, GABA, and GSH were simulated using the GAMMA library8. These were simulated with TE = 30ms, direct spectral bandwidth = 2000Hz, indirect spectral bandwidth = 1000Hz, and $$$(t_2,t_1)$$$ points = (2048,100). These metabolites were scaled to typical in vivo concentrations for gray matter9. In addition, Glu+Gln (Glx) was added with varying Gln/Glx percentages to produce 4 unique spectra with 0%, 15%, 30%, and 45% Gln/Glx concentrations.
In Vivo Acquisitions: A total of 24 healthy volunteers (mean age = 65 years old) were consented and scanned on a Siemens 3T Trio scanner (Siemens Healthcare, Erlangen, Germany). The scan parameters are listed above, and the voxel was placed on the medial frontal gray matter for all volunteers using a voxel size of 2.5x2.5x2.5cm$$$^3$$$ and a TR=2500ms. All subjects were evaluated using Cov-SEHAR and statistical analysis was performed to yield mean, standard deviation, and correlation to Glu values for all metabolites.
Results
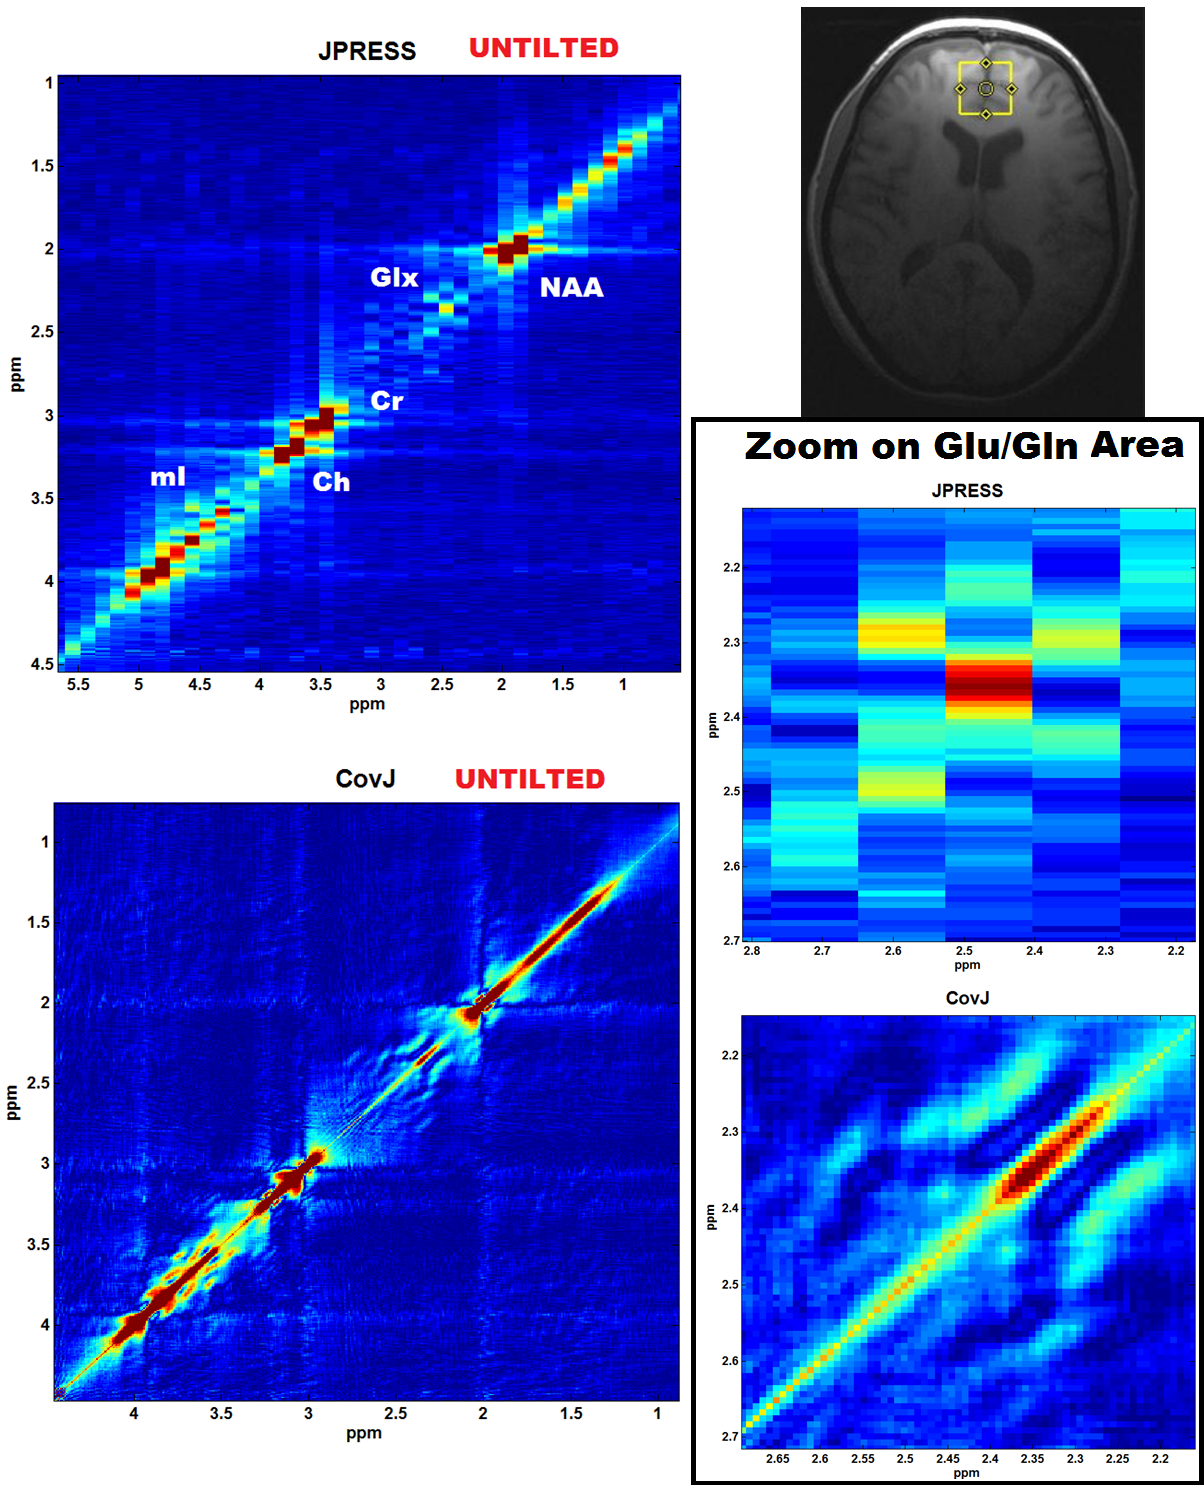
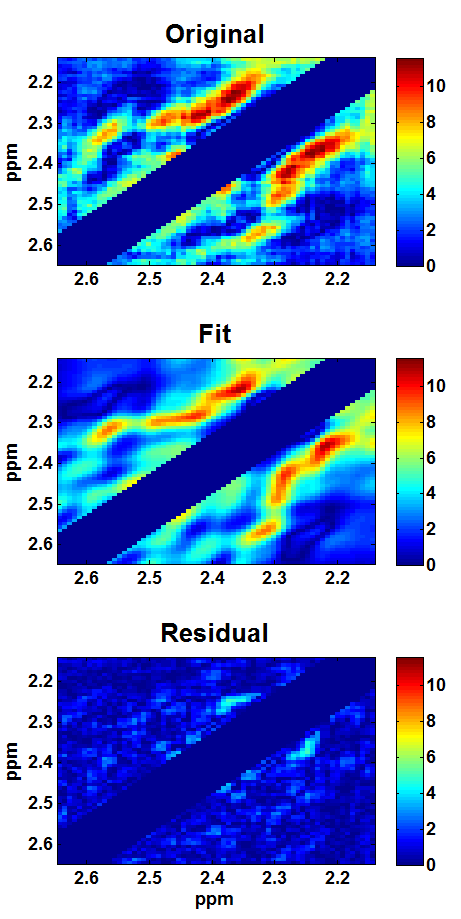
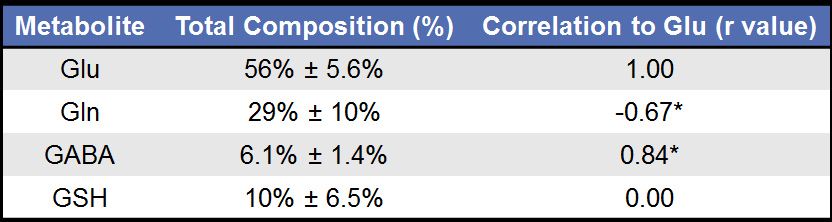
Figure 2 shows the simulated CovJ spectrum between 2.15-2.65ppm, whereas Figure 3 shows a JPRESS and CovJ spectrum from in vivo. The same voxel shown in Figure 3 is fit using Cov-SEHAR, and the fit and residual are shown in Figure 4. The results of applying this method in 24 healthy volunteers are shown in Table 1, which displays mean, standard deviation, and correlation to Glu values.Discussion and Conclusion
Using Cov-SEHAR, it is possible to quantify the concentration values for important neuro-metabolites from high resolution CovJ spectra. The mean values for Glu and Gln, as well as the correlation values presented in Table 1, are consistent with literature values9. Cov-SEHAR may be particularly useful when investigating pathologies where GABA or Glu/Gln concentrations vary, such as in bipolar disorder10. It is important to note that while only 4 metabolites are highlighted in this study (Glu, Gln, GABA, and GSH), this quantitation method can easily be extended to yield quantitative results for many more metabolites. Future studies will focus on comparing this novel method to 1D fitting11 and JPRESS Prior-knowledge fitting6,12 in order to determine which methods, or combination of methods, are most consistent for quantifying these important biochemicals.Acknowledgements
The authors would like to acknowledge the UCLA Dissertation Year Fellowship (2016-2017) and the NIH R21 grant (NS080649-02).References
1. Bottomley PA. Spatial localization in NMR spectroscopy in vivo. Annals of the New York Academy of Sciences 1987;508:333-348.
2. Kreis R, Boesch C. Spatially Localized, One-and Two-Dimensional NMR Spectroscopy and in Vivo Application to Human Muscle. Journal of Magnetic Resonance, Series B 1996;113:103- 118.
3. Thomas MA, Ryner LN, Mehta MP, et. al. Localized 2D J-resolved H MR spectroscopy of human brain tumors in vivo. Journal of Magnetic Resonance Imaging 1996;6:453-459.
4. Schulte RF, Lange T, Beck J, et. al. Improved two-dimensional J-resolved spectroscopy. NMR in Biomedicine 2006;19:264-270.
5. Brüschweiler R, Zhang F. Covariance nuclear magnetic resonance spectroscopy. The Journal of chemical physics 2004;120:5253-5260.
6. Fuchs A, Boesiger P, Schulte RF, Henning A. ProFit revisited. Magnetic Resonance in Medicine 2014;71:458-468.
7. Iqbal Z, Wilson NE, Thomas MA. 3D spatially encoded and accelerated TE-averaged echo planar spectroscopic imaging in healthy human brain. NMR in Biomedicine 2016;DOI:10.1002/nbm.3469.
8. Smith S, Levante T, Meier BH, Ernst RR. Computer simulations in magnetic resonance. An object-oriented programming approach. Journal of Magnetic Resonance, Series A 1994;106:75-105.
9. Pouwels PJ, Frahm J. Regional metabolite concentrations in human brain as determined by quantitative localized proton MRS. Magnetic Resonance in Medicine 1998;39:53-60.
10. Soeiro-de Souza MG, Henning A, Machado-Vieira R, et. al. Anterior cingulate Glutamate-Glutamine cycle metabolites are altered in euthymic bipolar I disorder. European Neuropsychopharmacology 2015;25:2221-2229.
11. Wilson M, Reynolds G, Kauppinen RA, et. al. A constrained least-squares approach to the automated quantitation of in vivo 1H magnetic resonance spectroscopy data. Magnetic Resonance in Medicine 2011;65:1-12.
12. Schulte RF, Boesiger P. ProFit: two-dimensional prior-knowledge fitting of J-resolved spectra. NMR in Biomedicine 2006;19:255-263.
Figures