5472
Probing In Vivo Metabolite Relaxation by Linear Quantification of RF Driven Steady States1National Institute of Mental Health, National Institute of Health, Bethesda, MD, United States
Synopsis
A driven steady states technique for brain metabolite relaxation measurement is proposed. Multiple steady states driven by long pulse train were used to quantify T2 of brain metabolites in vivo. The proposed technique does not need to vary echo time of the measuring sequence such as PRESS. A simple linear equation for quantification of driven steady state spectra was derived using Bloch equations. The derived equation was verified by Bloch simulations, phantom and in-vivo experiments.
Introduction:
Tissue signal at steady states driven by pulse trains are frequently utilized in imaging techniques for modeling different components of tissue water relaxation [1, 2]. It is well known that different relaxation weighting techniques sensitize the biological processes and environments differently. For example, in vivo metabolite T2 measured by PRESS and CMPG-type sequences differ significantly [3]. In this work, we propose a method for probing metabolite relaxation under steady states generated by a train of rapid RF pulses. The proposed technique relies on effects of T2 weighting on the longitudinal magnetization of steady states. It does not need to vary echo time (TE) of the measuring sequence such as PRESS, allowing less TE associated interferences, such as diffusion, macromolecule[4], and J-coupling modulation. A linear equation relating longitudinal magnetization and metabolite relaxation (T2/T1) was derived from Bloch equations. This new method was demonstrated by Bloch simulations, phantom and in-vivo experiments.Theory:
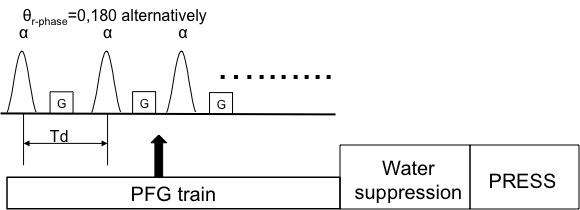
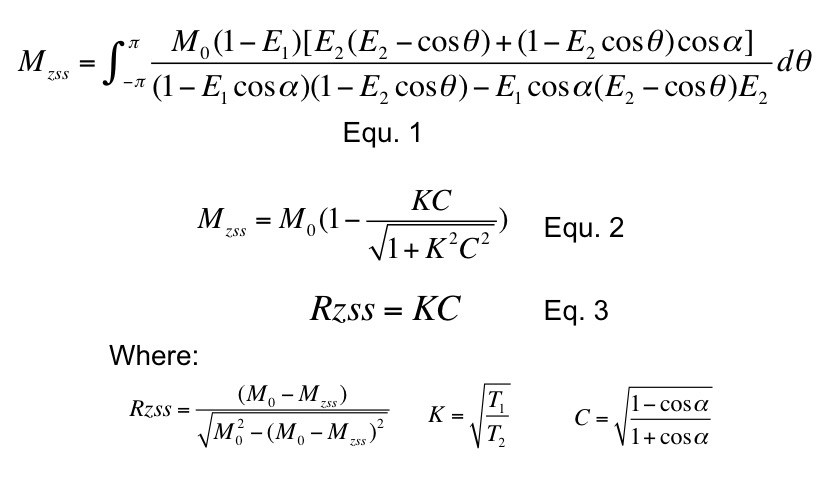
For a train of RF pulses with interspersing field gradient (PFG; see Fig. 1) the steady state magnetization (Mzss) is given by integral of longitudinal Bloch equation [4].
Equation 1 was shown in Fig. 2
where E1=exp(-Td/T1), E2 = exp(-Td/T2), a is the flip angle of a single RF pulse and M0 is the signal intensity with driven flip angle zero. Because Td, the interpulse deley time, is much shorter than the metabolite T1 and T2, E1=1-Td/T1 and E2 =1-Td/T2. θ is the position-dependent linear phase angle induced inside the voxel by the applied field gradient. For Eq. 1 to be valid, the gradient amplitude G in Fig. 1 must be substantially greater than 2π/(γdG Δr), where g is the gyromagnetic ratio, dG is the duration of the applied gradient, and Δr is the voxel size. The above integral yields a closed-form expression for Mzss:
Equation 2 was shown in Fig. 2
Eq. 2 can be rearranged into a linear equation:
Equation 3 was shown in Fig. 2
Eq. 3 suggests T1/T2 of metabolites can be calculated by linear fitting.
Method:
All scans were acquired using a 32-channel head coil at 7T and a Siemens scanner. A standard MRS phantom was used for sequence test. Written informed consent was obtained from 2 healthy volunteers (2 females, 24 and 35 years old). The PFG preparation module in Fig. 1 consists of 500 sinc-Gauss pulses with gradient G interspersed between the RF pulses. The duration of each RF pulse is 4 ms with frequency offset of 2.2 ppm and a constant interpulse delay Td of 10ms. The phase of the PFG RF pulses was inverted alternatively. The flip angle (FA) of individual RF pulses in the PFG module was incremented by 10° from 0° to 60° for a total of seven measurements. Gradient amplitude and duration were 2mT/m and 5ms, respectively. A shortened water suppression module were applied. All the RF pulses in water suppression module are set to 9 ms duration with 12 ms interpulse delay time. The PRESS sequence used isotropic voxel (2 cm x 2 cm x 2 cm), a repetition time (TR) of 8.5 s with TE1 = 69 ms and TE2= 37 ms. 2048 data points were acquired. Phantom and in-vivo data were acquired with 4 averages. The total scan time for measuring T1/T2 using seven FAs was approximately 4 min. Conventional standard inversion recovery was implemented for separate T1 determination. Multi-TE spin echo technique for T2 quantification was also implemented for comparison. The metabolite signal amplitude was measured by integration at the half-height.
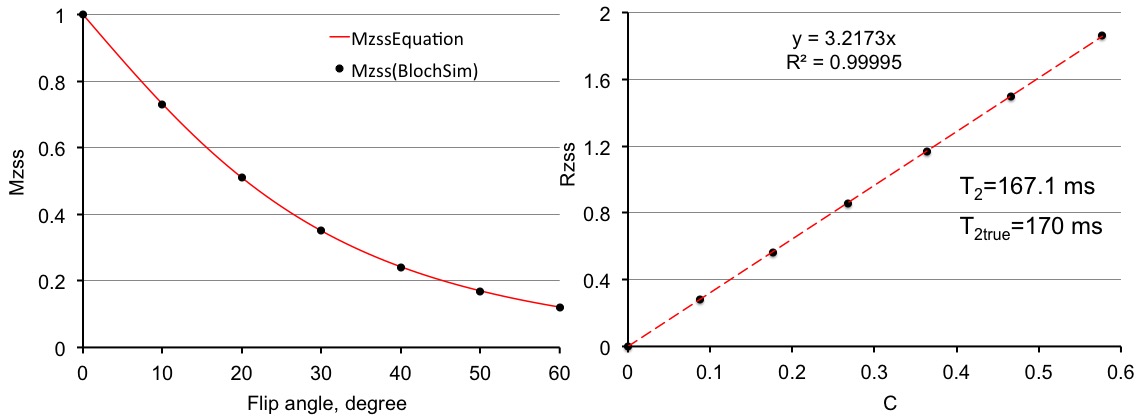
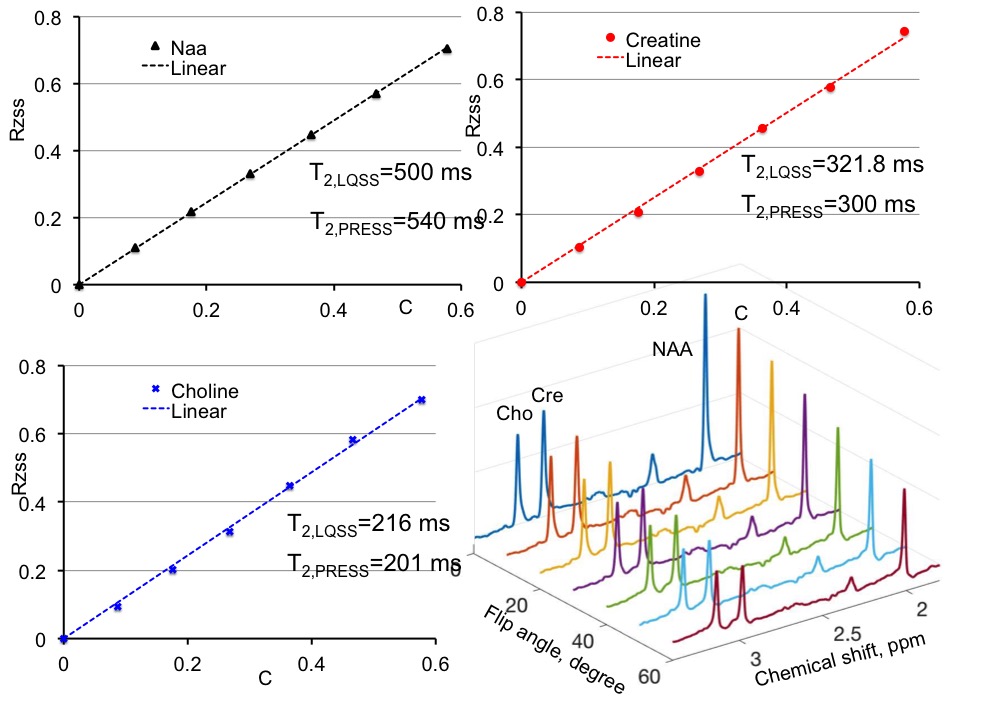
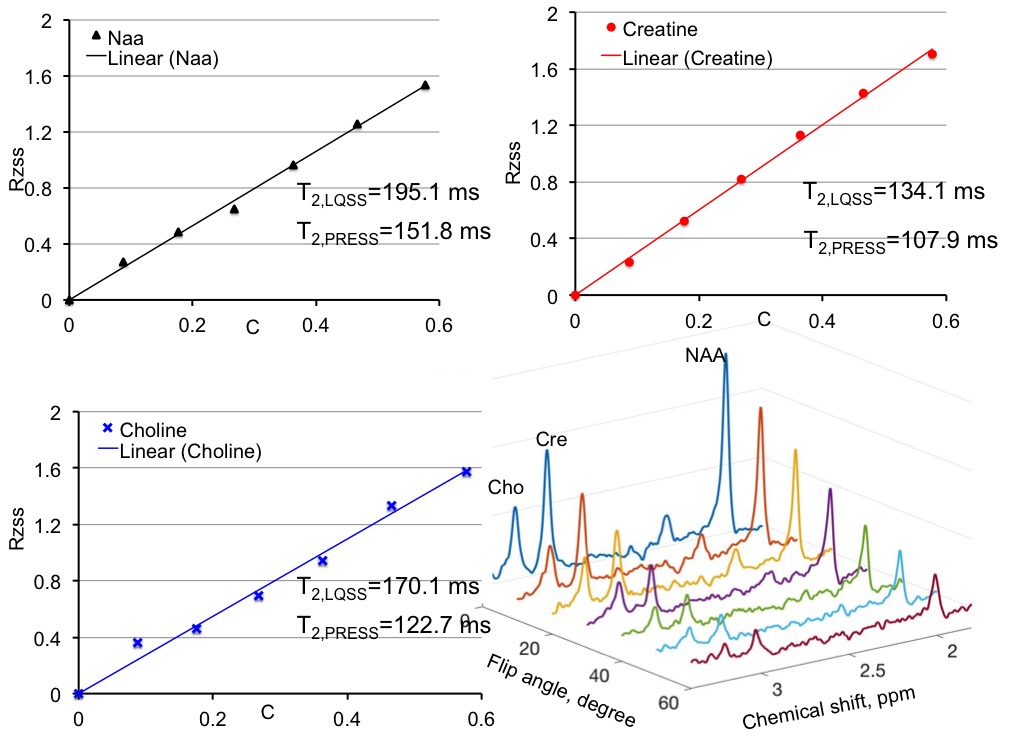
Results and Discussion:Fig. 3 used numerical simulation to validate Eq. 3. For the ground truth values of T2=170 ms with T1 set to 1730 ms, linear fitting using Eq. 3 gives T2=167.1 ms. In phantom experiment, as shown in Fig. 4, the T2 measurements agree well with T2 by multi-TE spin echo measurements. Since many factors (e.g., unintended diffusion weighting) affect the relaxation process exact agreement between the two methods should not be expected. In-vivo results are given in Fig. 5. Both phantom and in vivo results show the high degree linearity predicted by Eq. 3. The RF-driven steady states method, when used for T2 measurements, is affected by errors associated with T1 measurement.
Conclusion:
RF-driven steady states can be used to probe in vivo metabolite relaxation using a linear relationship described by Eq. 3, displayed in Fig. 2. This new method does not require varying echo time when used to measure metabolite T2.Acknowledgements
This work was supported by the intramural research program of National Institute of Mental Health.References
1. Li, Linqing, et al. "Black-blood multicontrast imaging of carotid arteries with DANTE-prepared 2D and 3D MR imaging." Radiology 273.2 (2014): 560-569. (Supplementary part)
2. Deoni, Sean CL, Terry M. Peters, and Brian K. Rutt. "High-resolution T1 and T2 mapping of the brain in a clinically acceptable time with DESPOT1 and DESPOT2." Magnetic resonance in medicine 53.1 (2005): 237-241.
3. Deelchand, Dinesh Kumar, Pierre-Gilles Henry, and Malgorzata Marjanska. "Effect of carr-purcell refocusing pulse trains on transverse relaxation times of metabolites in rat brain at 9.4 Tesla." Magnetic resonance in medicine 73.1 (2015): 13-20.
4. Ceckler, Toni L., et al. "Dynamic and chemical factors affecting water proton relaxation by macromolecules." Journal of Magnetic Resonance (1969) 98.3 (1992): 637-645.
5. Freeman, Ray, and H. D. W. Hill. "Phase and intensity anomalies in Fourier transform NMR." Journal of Magnetic Resonance (1969) 4.3 (1971): 366-383.
Figures