5471
MR Spectroscopy shows that high fat diet changes composition and distribution of mammary gland fat in a transgenic mouse model of breast cancer1Radiology, The University of Chicago, Chicago, IL, United States, 2Medicine, Adult and Pediatric Endocrinology, Diabetes, and Metabolism, The University of Chicago, Chicago, IL, United States, 3Pathology, The University of Chicago, Chicago, IL, United States, 4Biochemistry & Molecular Biology, The University of Chicago, Chicago, IL, United States, 5Medicine, Hematology and Oncology, The University of Chicago, Chicago, IL, United States
Synopsis
Epidemiological studies show increased risk of breast cancer associated with Western diets containing high animal fat. The aim of this study was to evaluate changes in mammary fat composition due to a high animal fat diet (HAFD), compared to a low fat diet (LFD), in a mouse model of breast cancer. Localized MR spectroscopy and high spectral and spatial resolution (HiSS) MRI data were acquired at 9.4T. The saturated fat fractions increased and the polyunsaturated bond component decreased significantly in HAFD mice compared to LFD mice. Fat images obtained from HiSS demonstrated increased mammary fat concentration in HAFD mice than LED mice.
Purpose
Western diets, e.g., diets high in animal fat, increase risk of aggressive subtypes of breast cancer. Therefore, it is important to quantitatively determine changes in fat content and fatty acid composition in the breast/mammary gland due to high animal fat diets (HAFD). Here we used proton spectroscopy and spectroscopic imaging to study effects of an HAFD on mammary glands of SV40Tag transgenic mice – a well-established model of triple negative human breast cancer. These mice do not become obese on this diet – and this allows evaluation of changes in mammary gland fat content in the absence of systemic effects of obesity.Methods
We studied female SV40Tag transgenic mice (n=8) on a control low fat diet (LFD; n=4) and a high animal fat diet (HAFD; n=4). The mice started different diets at 4 weeks age and were imaged at 12 weeks age. The protocol was approved by University of Chicago's Animal Care and Use Committee. MRI was performed on a 9.4T Bruker scanner. Two interleaved sets of axial multi-slice RARE T2-weighted (T2W) images (TR/TEeffective=4000/20.3 ms, FOV=25.6×19.2 mm, array size=256×192, slice thickness=0.5 mm) with fat suppression and respiratory gating were acquired to identify the mouse inguinal mammary gland. Based on T2W imaging, two 1 mm3 voxels with no cancers, lymph nodes, or lymph ducts were selected for localized 1H-MRS acquired with a PRESS pulse sequence with no water suppression (TR/TE=4000/11.8 ms, data points=1024, spectral width=6009.6 Hz, spectrum resolution=2.9 Hz). Nine slices were selected for high spectral and spatial resolution (HiSS) imaging acquired using a multi-gradient echo pulse sequence with in-plane spatial resolution the same as T2W imaging (in-plane resolution=0.1 mm2, slice thickness=1 mm, spectral resolution=62.9 Hz). To accurately calculate the area under each peak for the 1H-MRS data, each spectral peak (s) was fitted by a combination of Gaussian and Lorentz functions: $$$s(f)=\sum_{n=1}^{10}\alpha_{n}G_{n}(f)+(1-\alpha_{n})L_{n}(f) $$$, where f is frequency, α is constant, G(f) is Gaussian function, and L(f) is Lorentz function. The area under each peak was calculated based on the fitted spectrum. To estimate mammary fat composition, peak area (PA) ratio indices [1] were calculated as follows: (i) The mammary lipid quantity: PA1.3ppm/(PA1.3ppm+PA4.7ppm); (ii) Saturated lipid fraction: PA1.3ppm/PA0.9ppm; (iii) Total unsaturated fatty acid fraction: PA2.0ppm/PA0.9ppm; (iv) Polyunsaturated fraction: PA2.8ppm/PA0.9ppm. Finally, water and fat peak height images were generated from the HiSS data. Mann-Whitney tests were performed to determine whether there was a significant difference between calculated parameters in mice on the LFD vs. HFD. A p-value <0.05 was considered significant.Results
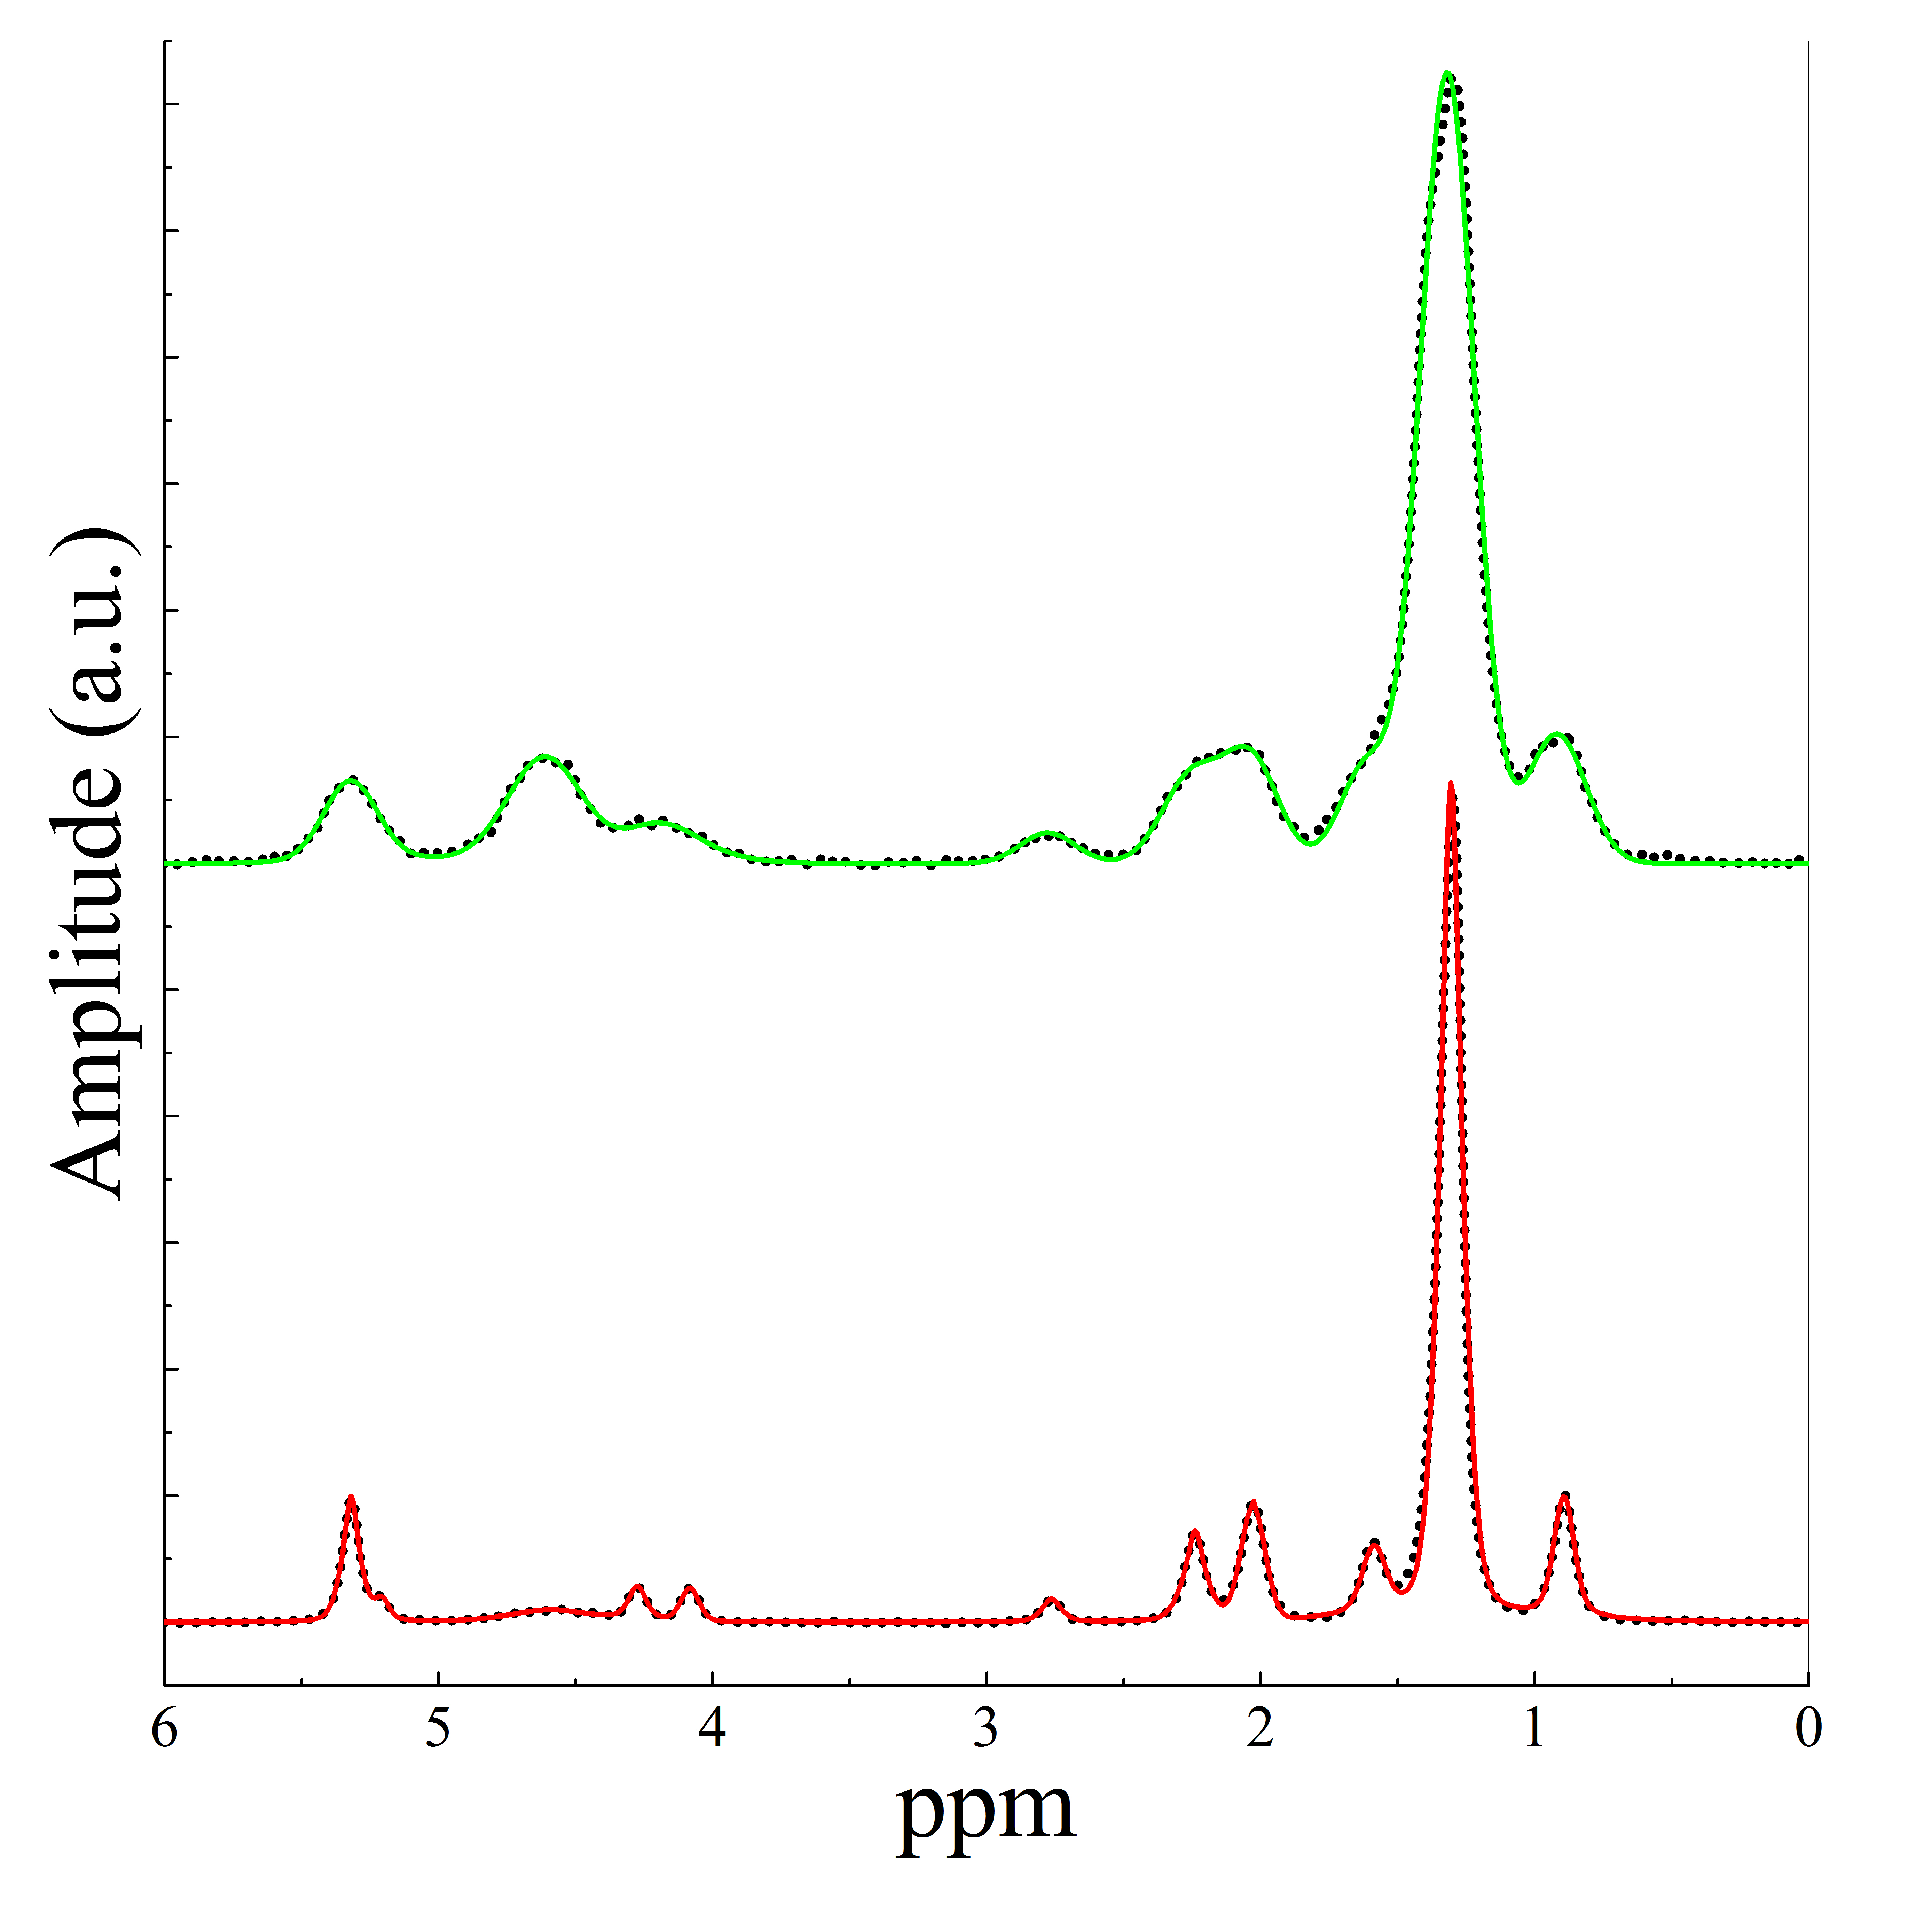
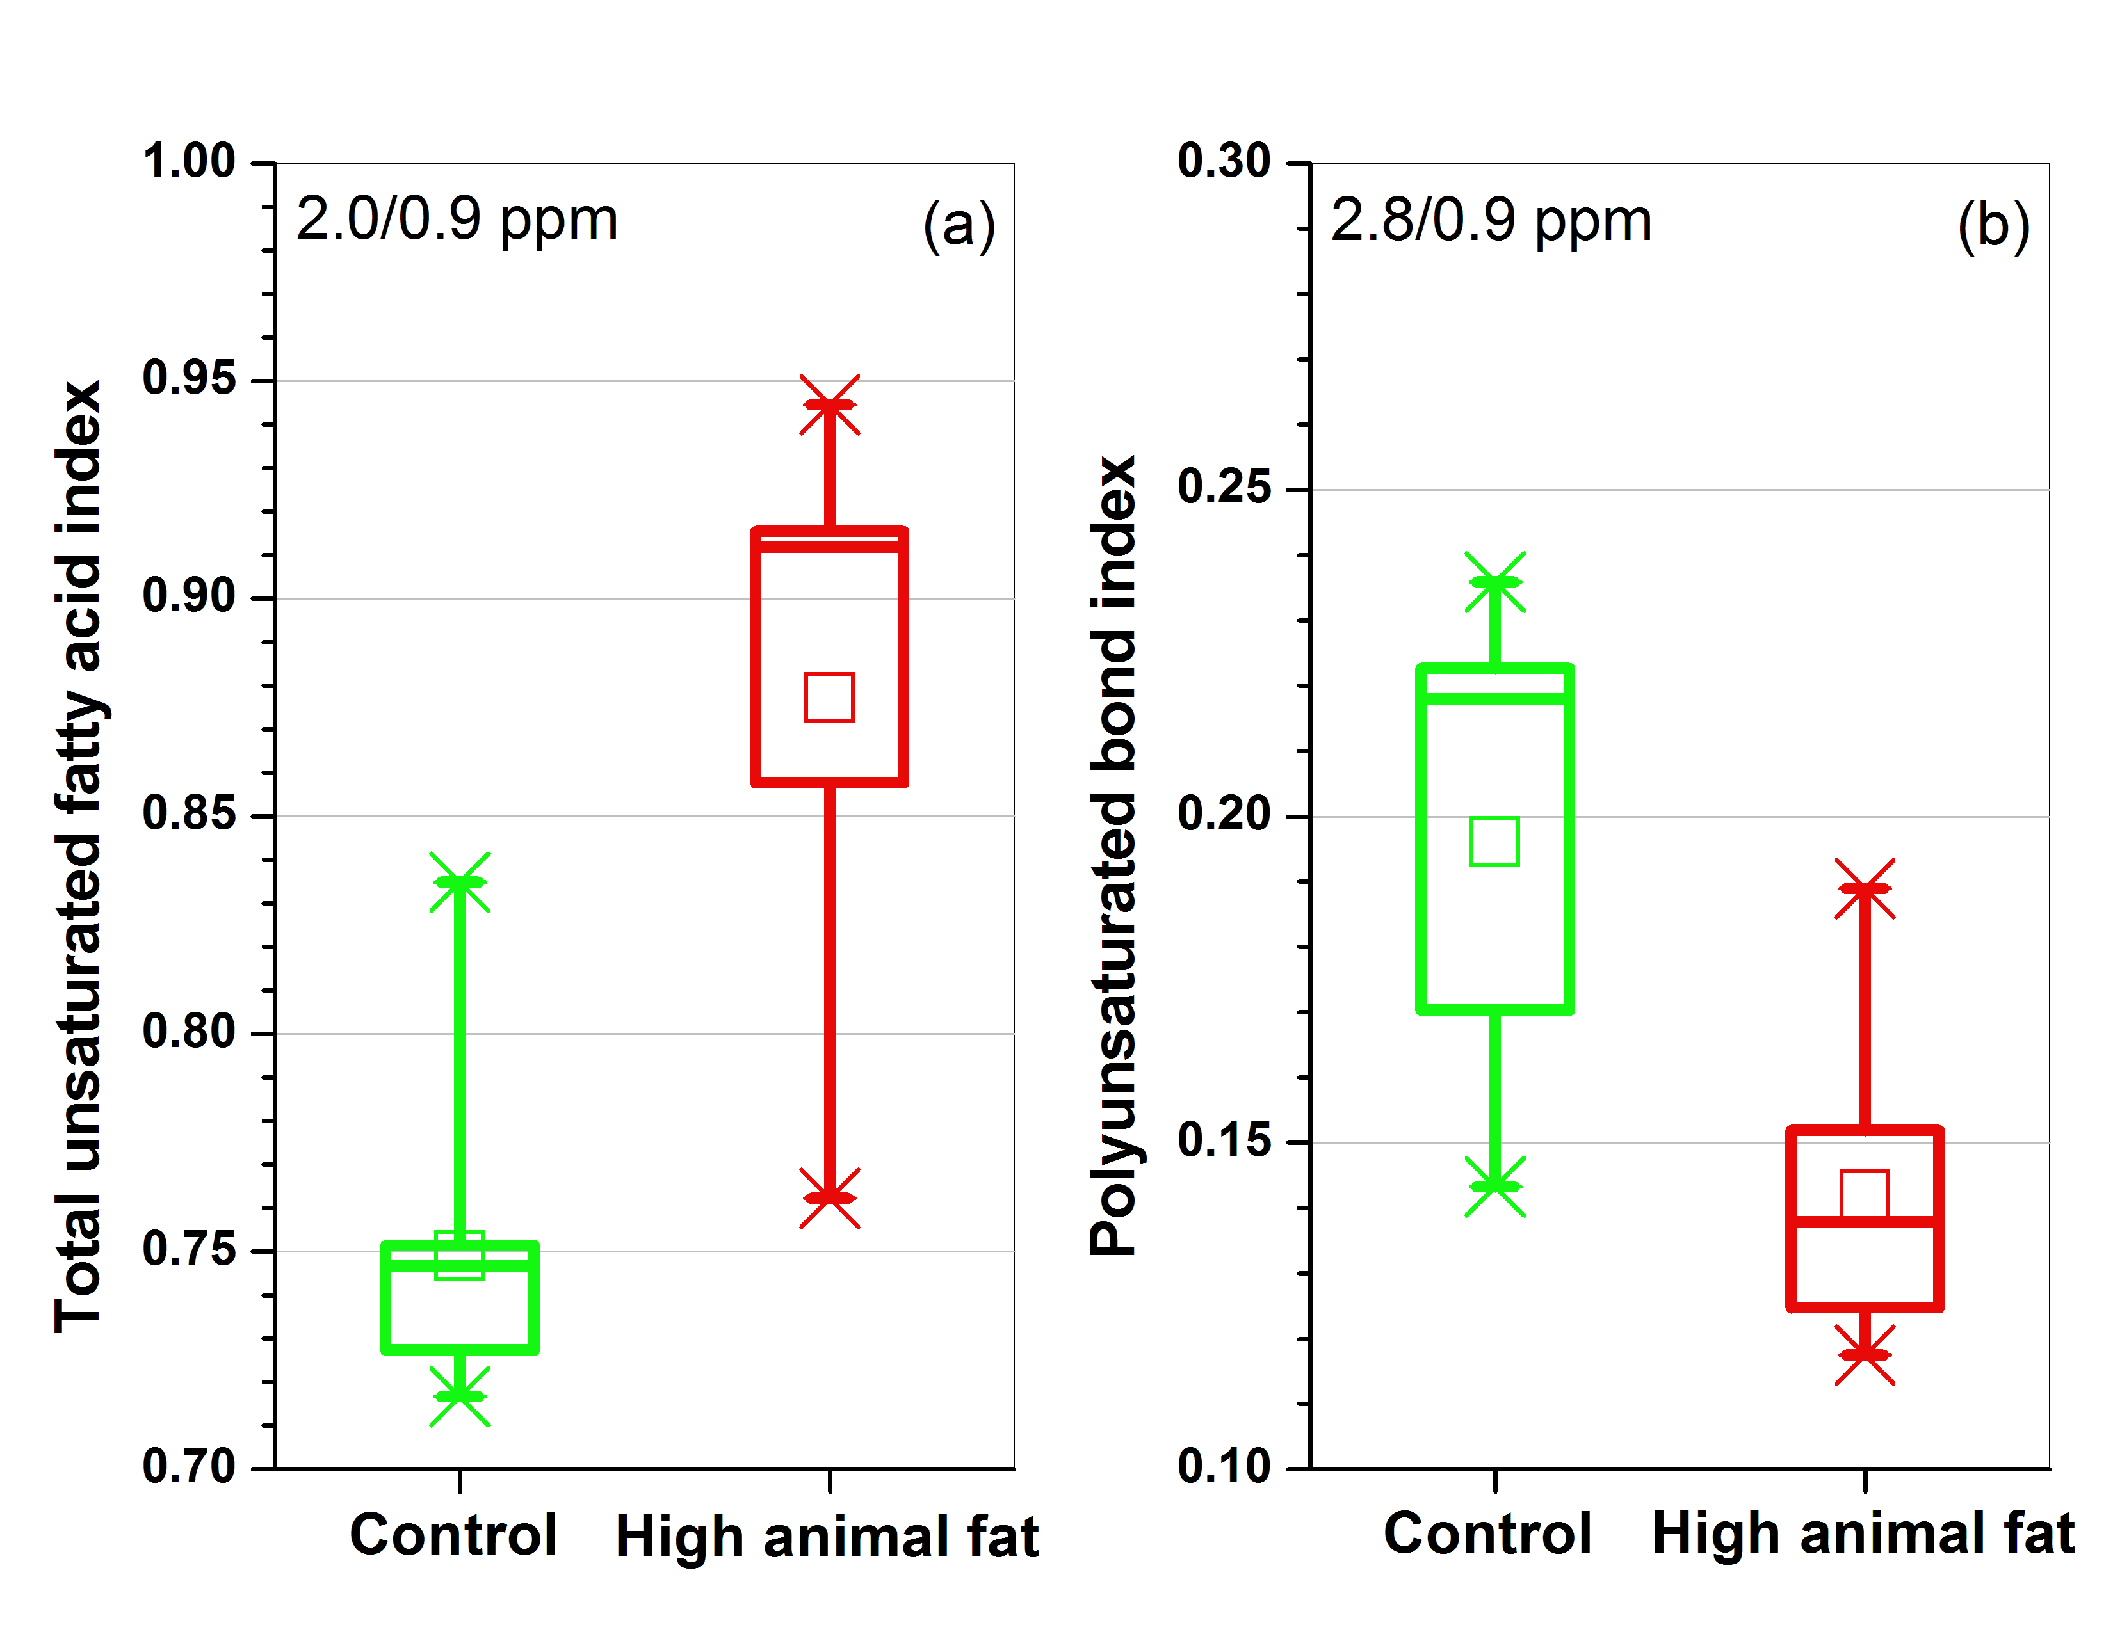
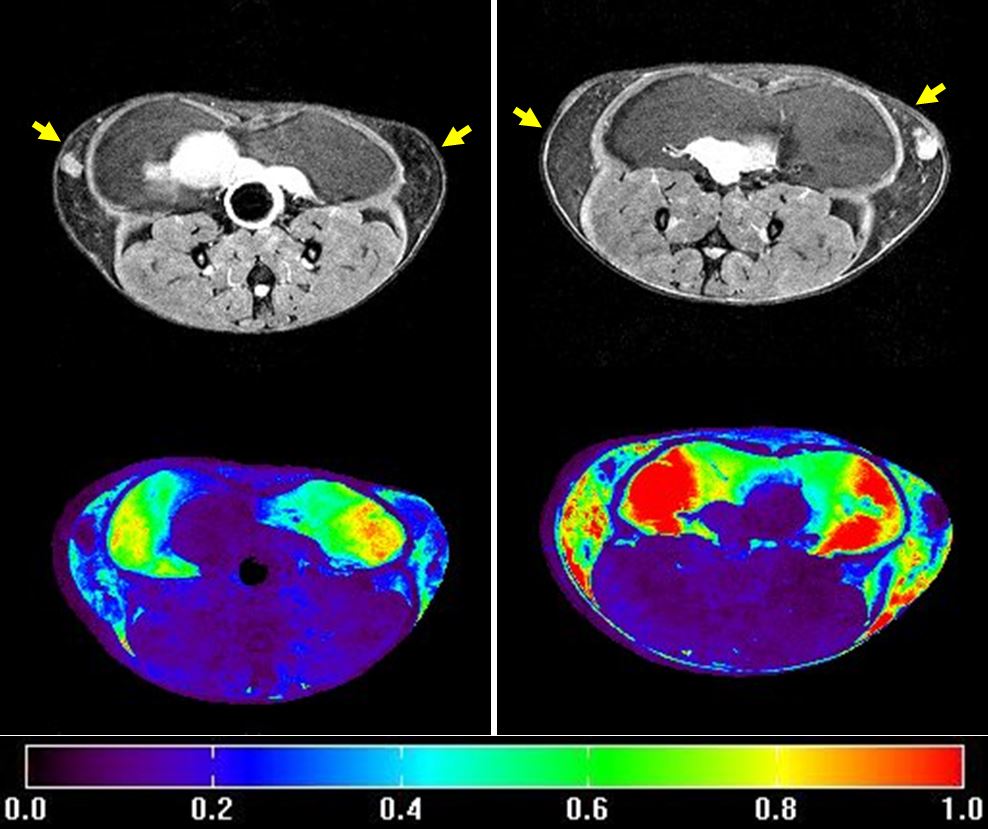
Spectra (Figure 1) from mammary glands of LFD (green) and HAFD (red) mice were clearly different. The full width at half maximum of the methylene peak (1.3 ppm) in LFD mice (0.21±0.038 ppm) was significantly (p< 0.002) broader than in HAFD mice (0.12±0.026 ppm). This is consistent with histology of mouse mammary glands; brown adipose tissue (BAT) predominates in LFD mice and mature white adipose tissue (WAT) is highly abundant in HAFD mice [2]. HAFD mice had significantly (p< 0.02) higher mammary lipid quantity and saturated fat fraction index than LFD mice (Figures 2a and 2b, respectively). HAFD mice had significantly (p< 0.002) higher (a) total unsaturated fatty acid, but significantly (p< 0.007) lower polyunsaturated bond index (Figure 3). Fat images (Figure 4) generated from HiSS data showed more MRI-detectable mammary gland fat in HAFD mice compared to LFD mice. The average fat signal intensity over the mammary glands (normalized by water signal in muscle) was 0.50±0.1 in HAFD and 0.32±0.07 in LFD mice.Discussion
On average, saturated fatty acid was significantly (10%) higher in HAFD mouse vs. LFD mice, and polyunsatured fat was significantly (25%) lower in HAFD mice compared to LFD mice. Overall fat content of mammary glands was higher in mice on HAFD while water content was higher in mice on LFD. This is consistent with the higher BAT found on histology in mice on the HAFD; BAT has higher water content [3] and may reduce T2* due to metabolic activity [4]. It has been shown that n-3 fatty acids, polyunsaturated fatty acids, are important in normal metaboloism [5]. There is evidence that marine n-3 polyunsaturated fatty acids reduce the risk of breast cancer [6,7]. This study demonstrated that localized 1H-MRS and HiSS detect significant changes in mammary glands due to HAFD, and these changes may be indicators of cancer risk. Serial studies using these MRI methods could improve understanding of the effects of diet on cancer incidence and progression. In addition, similar methods could be used in women to assess cancer risk.Acknowledgements
This research is supported by grants from the National Institutes of Health (R01-CA133490 and R01-CA167785) and the University of Chicago Comprehensive Cancer Center.References
[1] Corbin IR, Furth EE, Pickup S, Siegelman ES, Delikatny EJ. In vivo assessment of hepatic triglycerides in murine non-alcoholic fatty liver disease using magnetic resonance spectroscopy. Biochim Biophys Acta. 2009; 1791:757-63.
[2] Hu HH. Magnetic Resonance of Brown Adipose Tissue: A Review of Current Techniques. Crit Rev Biomed Eng. 2015; 43:161-81.
[3] Osculati F, Leclercq F, Sbarbati A, Zancanaro C, Cinti S, Antonakis K. Morphological identification of brown adipose tissue by magnetic resonance imaging in the rat. Eur J Radiol. 1989; 9:112-4.
[4] van Rooijen BD, van der Lans AA, Brans B, Wildberger JE, Mottaghy FM, Schrauwen P, Backes WH, van Marken Lichtenbelt WD. Imaging cold-activated brown adipose tissue using dynamic T2*-weighted magnetic resonance imaging and 2-deoxy-2-[18F] fluoro-D-glucose positron emission tomography. Invest Radiol. 2013; 48:708-14.
[5] "Omega-3 Fatty Acids and Health: Fact Sheet for Health Professionals". US National Institutes of Health, Office of Dietary Supplements. 2005. Retrieved 12 April 2014.
[6] Zheng JS, Hu XJ, Zhao YM, Yang J, Li D. Intake of fish and marine n-3 polyunsaturated fatty acids and risk of breast cancer: meta-analysis of data from 21 independent prospective cohort studies. BMJ. 2013; 346:f3706.
[7] Heinze VM, Actis AB. Dietary conjugated linoleic acid and long-chain n-3 fatty acids in mammary and prostate cancer protection: a review. Int J Food Sci Nutr. 2012; 63:66-78.
Figures