5470
Quantitative MRI of In Vivo Water and Lipid Concentrations with the ERETIC Method1Advanced Imaging Research Center, Oregon Health & Science University, Portland, OR, United States, 2Department of Physical Therapy, University of Florida, Gainesville, FL, United States
Synopsis
A synthetic radio-frequency (RF) signal, which is received along with the 1H magnetic resonance (MR) signal in magnetic resonance imaging (MRI), is used to determine absolute tissue water and lipid quantities. We show application of this ERETIC method (electronic reference to access in vivo concentration) to musculoskeletal imaging, with the potential to better track disease progression in Duchenne Muscular Dystrophy (DMD), and other muscle pathologies.
Purpose
The ERETIC technique (electronic reference to access in vivo concentration)1 is a convenient and advantageous alternative to other MRI receiver calibration methods such as phantom replacement or coincident fiducial phantoms. In this study, we demonstrate the capabilities of ERETIC in the quantification of the water and lipid components of leg muscle. Such calibration could improve existing biomarkers that rely upon detection of relative differences between endogenous compounds, such as the measure of muscle fat-fraction in Duchenne Muscular Dystrophy (DMD).2Introduction
All magnetic resonance imaging (MRI) involves the transmission and reception of radio frequency (RF) signals. While RF transmission is carefully calibrated to ensure a nominal flip angle of the magnetization is achieved across the sample, receiver parameters are not typically subject to the same level of scrutiny. Internal and external reference samples with known concentrations have been routinely employed for calibration in both MRI and MR spectroscopy.3 Phantom replacement is problematic because receiver gain and digital scaling factors are often modified automatically between scans, and coil loading will be different, such that the replacement phantom calibration becomes invalid. Coincident fiducial phantom methods solve this problem but are constrained by the geometry of the coil arrangement and image coverage. Coincident phantom techniques are also poorly suited for single voxel spectroscopy (SVS) acquisitions.
With the ERETIC method, an initial calibration step is required, during which a phantom with known concentrations is imaged with the ERETIC signal acquired along with the MR signal from the phantom. The amplitude ratio between the ERETIC signal and the per-voxel MRI signal is constant for a given pulse sequence, set of relaxation times (T1 and T2), and molar concentration. The pulse sequences used for the study must match those used in the calibration step. Relaxation times can either be matched between phantom and subject, or T2 and T1 maps can be generated to correct for relaxation time differences.
Methods
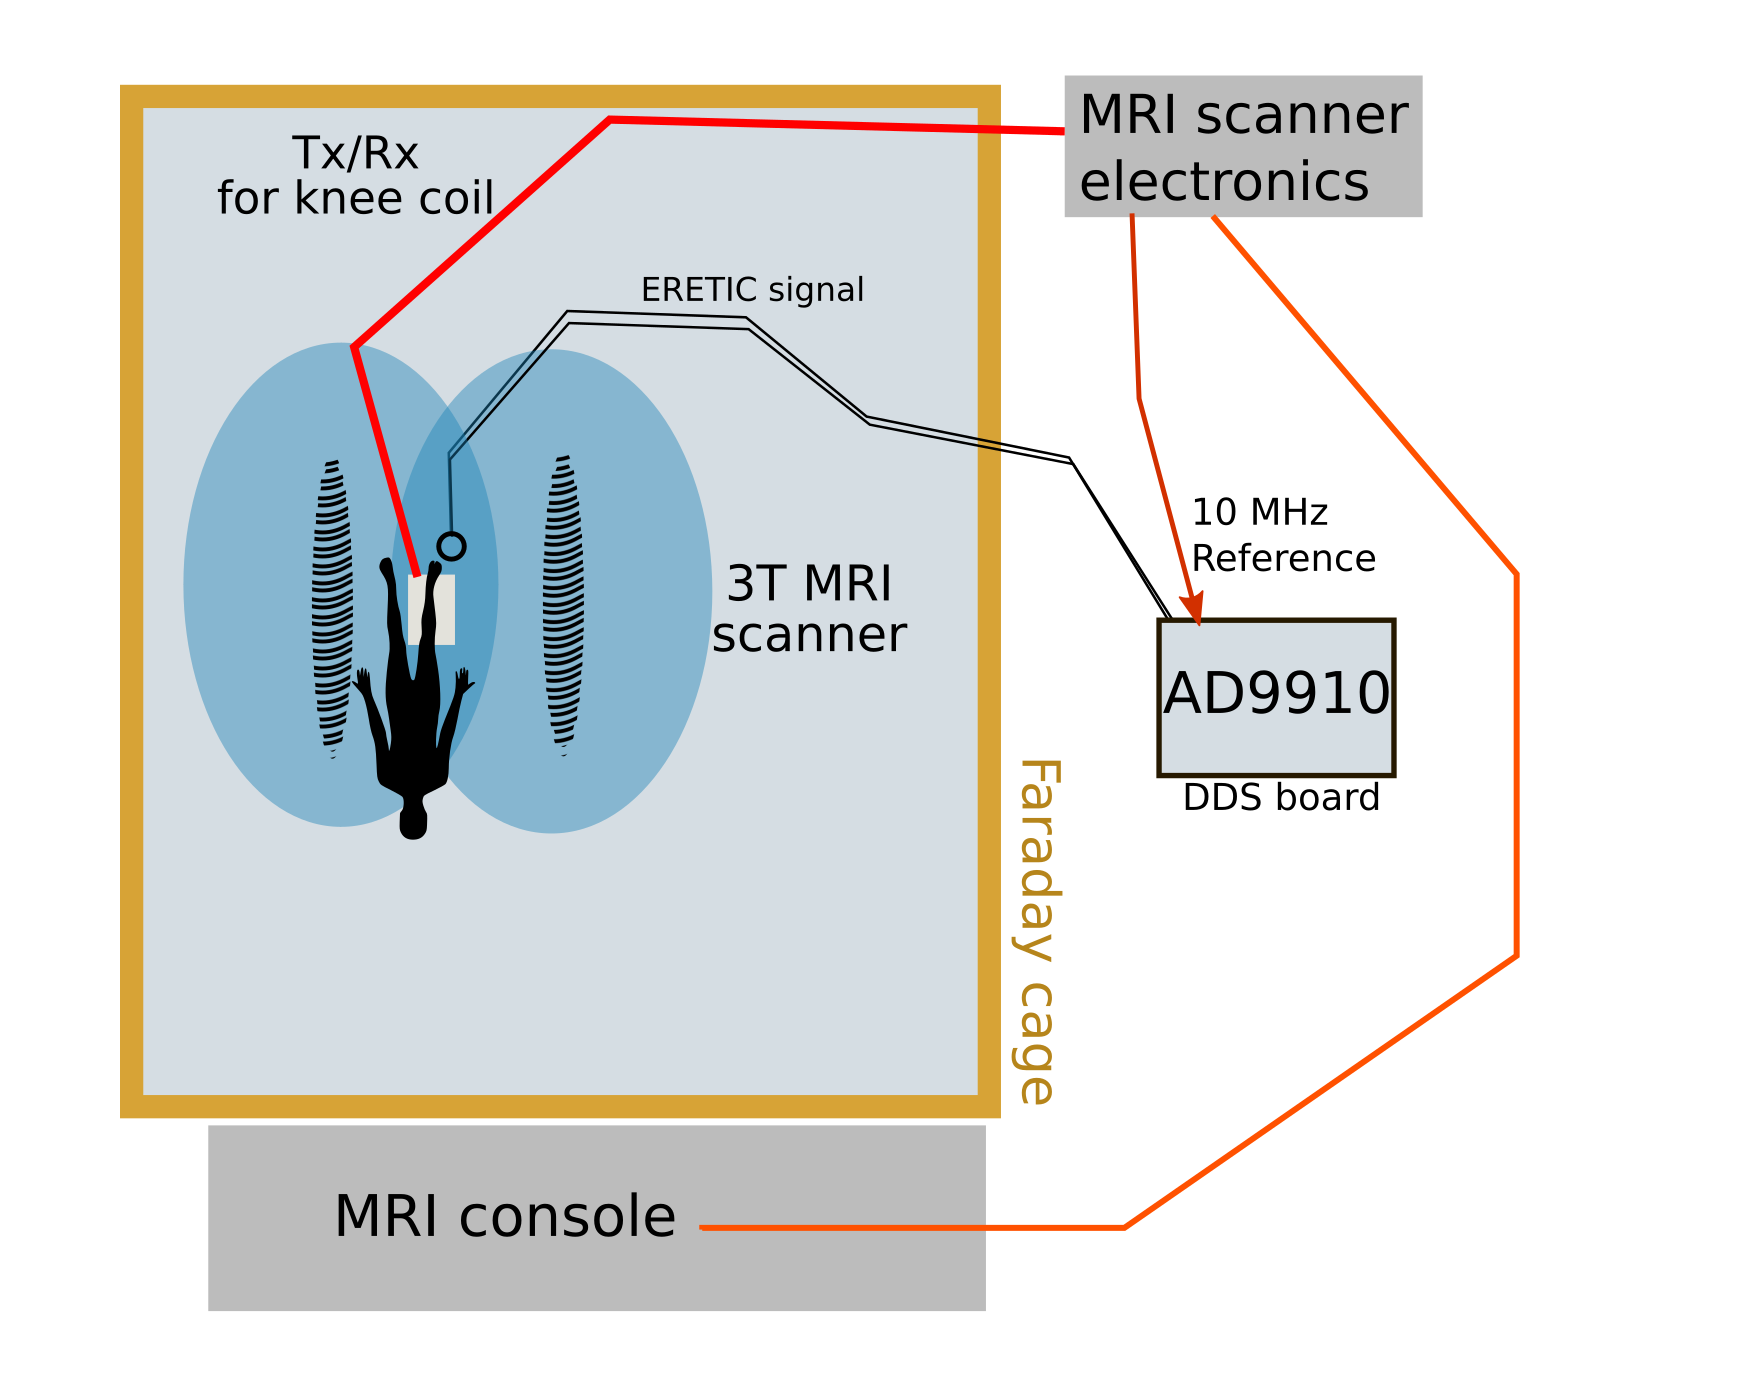
All MR data were acquired on a 3-Tesla Siemens TIM Trio MRI scanner (Erlangen, Germany). The ERETIC signal was generated using a direct digital frequency synthesis (DDS) board (AD9910 evaluation board, Analog Devices, Norwood, MA). The frequency and amplitude of the ERETIC signal are adjustable with provided software. A diagram of the setup is presented in Figure 1. A 250-mL Florence-flask filled with deionized water with 5mM Gadoteridol in solution was used as a calibration phantom.
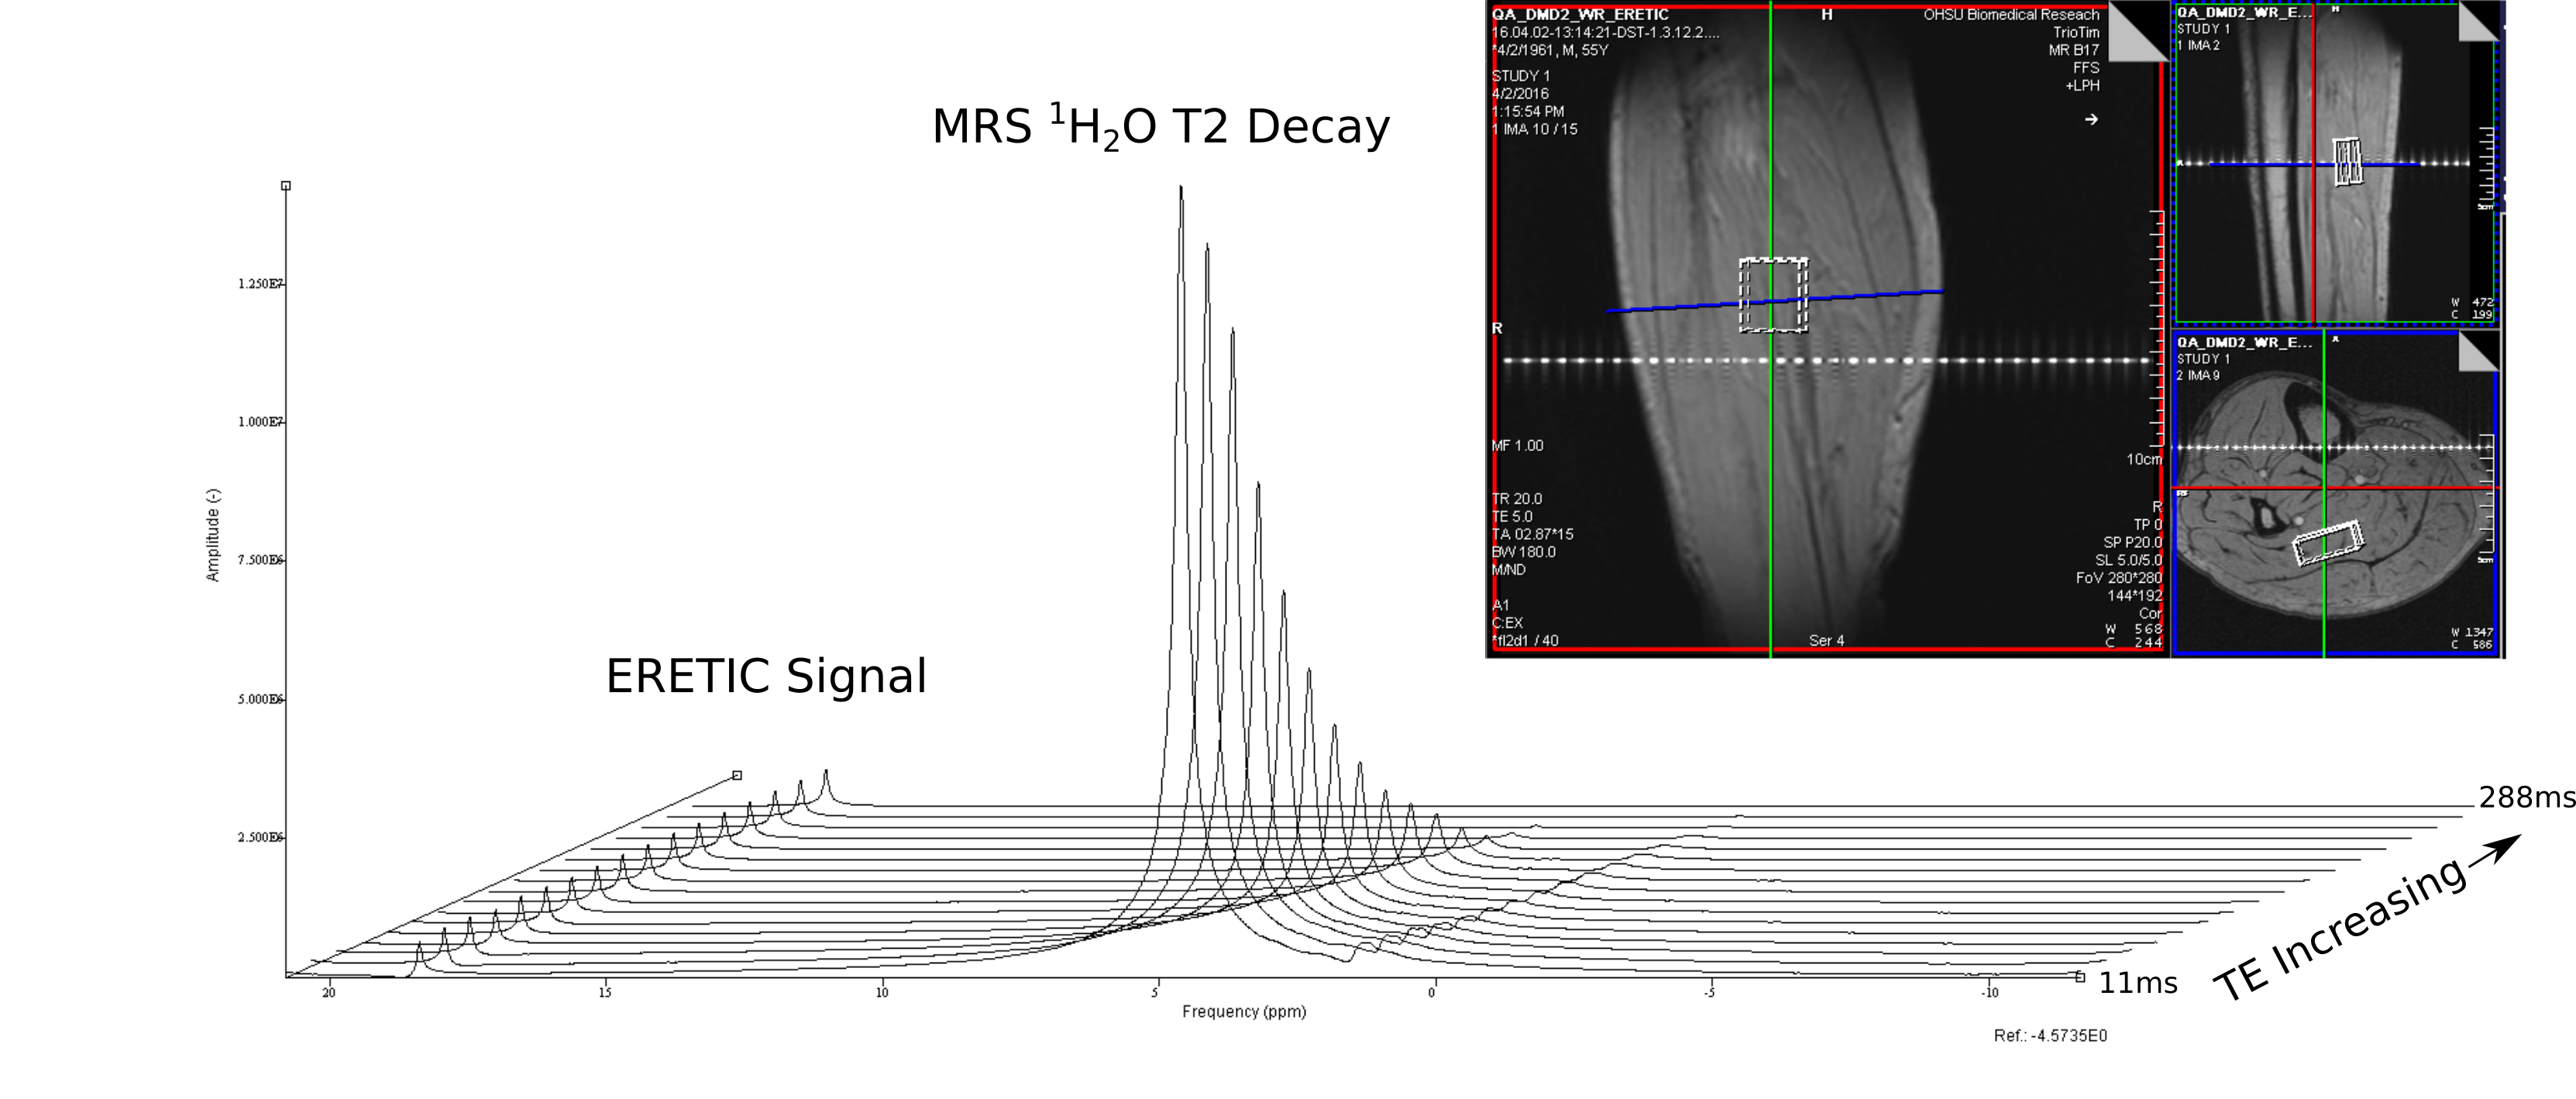
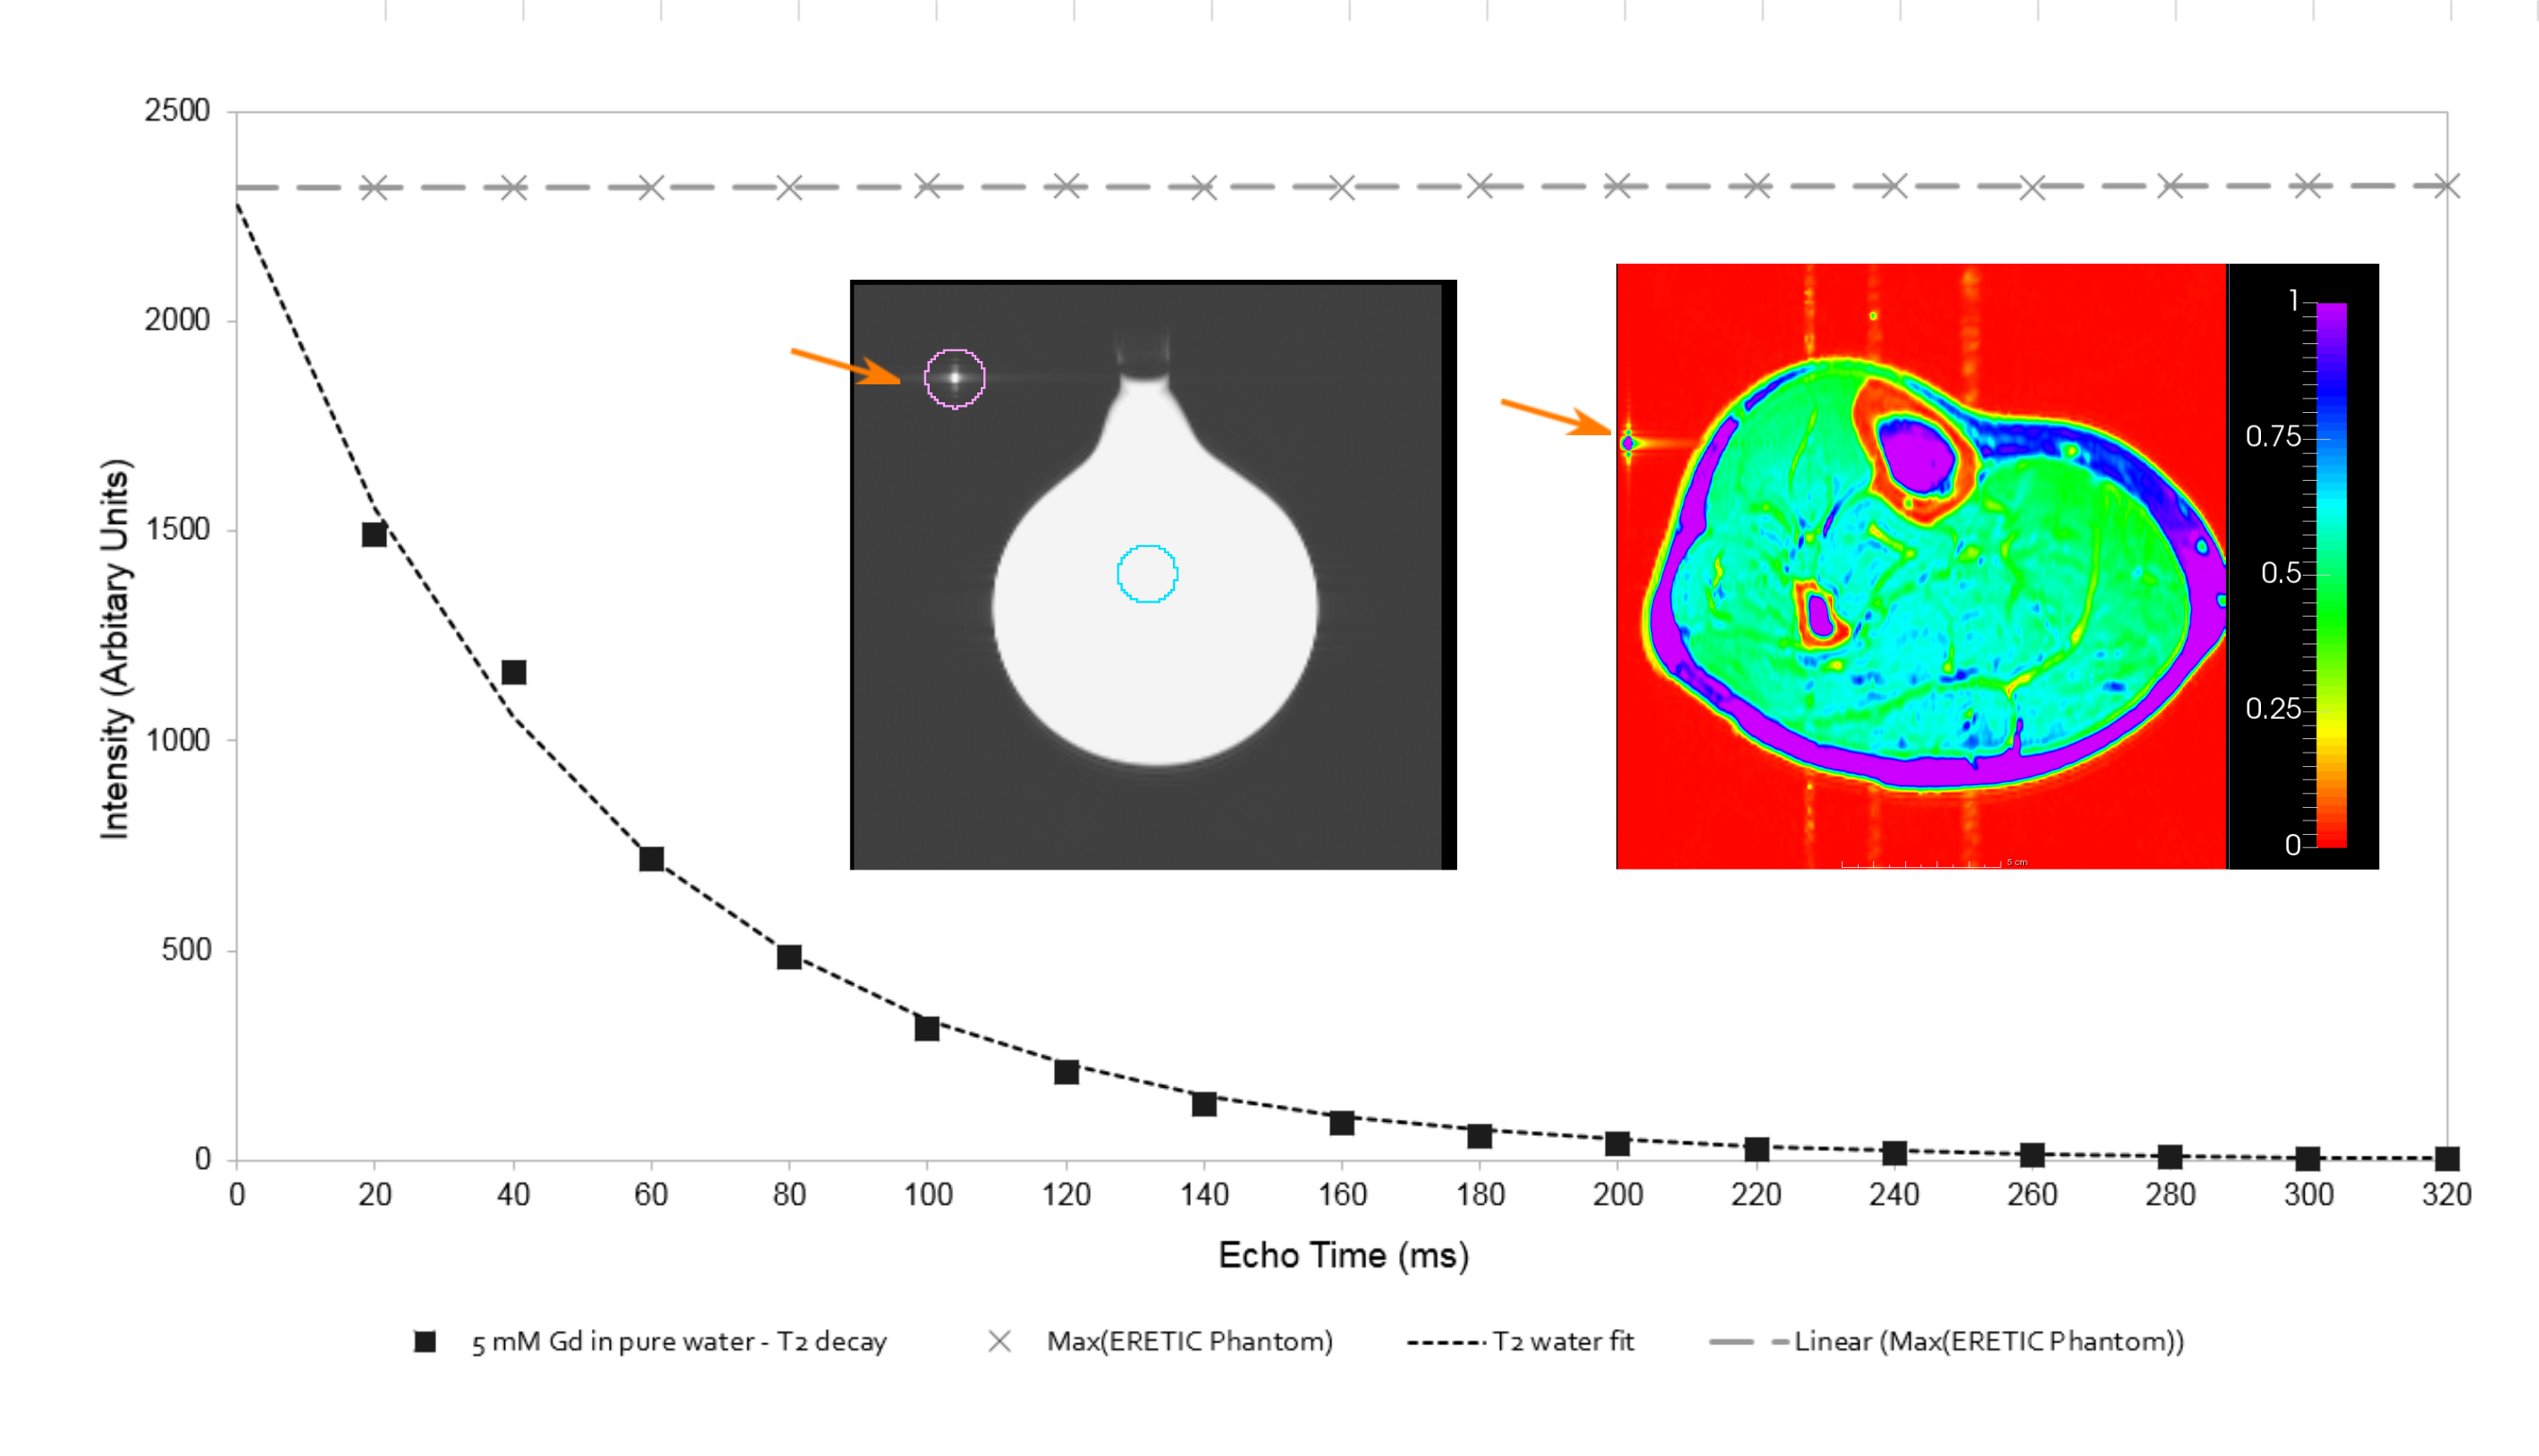
Two MR acquisitions were used for analysis: a spin-echo multi-echo (SE-ME) imaging sequence with 16 echo-times (20 – 320 ms) and a 3000 ms repetition time (TR) and a single-voxel spectroscopy acquisition with 16 echo-times (STEAM, TE = 11 – 288 ms, TR = 9000 ms).
The ERETIC signal was frequency modulated to appear at 18.5 ppm in the SVS acquisition and at the corner of the field-of-view in the SE-ME sequence.
Results
SVS data were acquired for two healthy male adults. The 1H MRS data were used to determine the water content (g/cm3) of the voxel, placed in the soleus muscle of the lower leg. After integration of the signals and correction for temperature and spectral baseline effects, water content values were 0.729 g/cm3 and 0.709 g/cm3 (Figure 2). This compares favorably to literature values for muscle water content.4
For the multi-echo MRI acquisitions, we demonstrate the generation of a proton-density map with values referenced to the water phantom (Figure 3). In soleus muscle, the mean value was 0.790 with standard deviation of 0.079. Use of the M0 map derived from T2 fitting is an advantage of this approach.
Discussion
The determination of water concentrations by spectroscopy with the use of the ERETIC method for calibration was quite successful. Amplitude stability of the ERETIC signal was excellent. If the stability of the ERETIC signal is comparable or better than the scanner transmit stability, then the receiver signal intensity can be calibrated to within the overall variance of the system taken as a whole.
This application of the ERETIC method has potential to better track changes in muscle and other tissue where absolute quantification of compounds such as water and fat is confounded by changes in the amount of material that is not readily detectable with MRI. In the case of DMD, for example, fibrotic tissue with very short T2 values may replace muscle tissue and confound absolute measures of water and lipid. The ERETIC technique provides the ability to routinely quantify MR signals without cumbersome and error prone phantom approaches and has the potential to add considerable value to the MR exam.
Acknowledgements
Grant
support:
NIH
R01 AR056973, NIH R01
AR065943, NIH
R01 NS040801, NIH S10OD018224, UL1
RR024140-04S1
References
1. Akoka S, Barantin L, Trierweiler M. Concentration Measurement by Proton NMR Using the ERETIC Method. Anal Chem 1999; 71: 2554-2557.
2. Triplett, W. T. et al. Chemical shift-based MRI to measure fat fractions in dystrophic skeletal muscle: MR Measurements of Fat Fraction in Dystrophic Muscles. Magn Reson Med 2014; 72: 8–19.
3. de Graaf RA . In Vivo NMR Spectroscopy. John Wiley & Sons, Ltd, 2007, pp 466-472.
4. Ward, S.R., Lieber, R.L. Density and hydration of fresh and fixed human skeletal muscle. J Biomech 2005; 38: 2317–2320.
5. Franconi F, Chapon C, Lemaire L, Lehmann V, Barantin L, Akoka S. Quantitative MR renography using a calibrated internal signal (ERETIC). Magn Reson Imaging 2002; 20: 587-592.
6. Michel N, Akoka S. The application of the ERETIC method to 2D-NMR. J Magn Reson 2004; 168: 118-123.
7. Le Grand F, George G, Akoka S. How to reduce the experimental time in isotopic 2H NMR using the ERETIC method. J Magn Reson 2005; 174: 171-176.
8. Marro KI, Lee D, Shankland EG, Mathis CM, Hayes CE, Amara CE, Kushmerick MJ. Synthetic signal injection using inductive coupling. J Magn Reson 2008; 194: 67-75.
9.
Desal H, Pineda Alonso N, Akoka S. Electronic reference for absolute
quantification of brain metabolites by1H-MRS on clinical whole-body
imaging. J Neuroradiol 2010; 37: 292-297.
Figures