5469
Association of NAA Resonance Frequency with Axonal Orientation1Radiology, University of Miami, Miami, FL, United States
Synopsis
The resonance frequencies of tissue metabolite are affected by cellular-level variations in magnetic susceptibility and the compartmentation of each metabolite. One prominent finding for 1H MRS studies of the brain is differences of the N-Acetylaspartate (NAA) resonance frequency in white matter, which is hypothesized to reflect the inter-axonal localization of this metabolite and susceptibility variations that are dependent on the orientation of the major axonal bundles relative to the applied magnetic field. In this study, the dependence of the NAA frequency on axonal orientation was evaluated using voxel-based analysis of a whole-brain MRSI and diffusion-tensor imaging.
PURPOSE
Two recent studies have demonstrated that individual metabolite resonance frequencies can vary independently from those of other metabolites, with a range on the order of 10 ppb 1,2, and that these variations are independent of the previously reported differences in the resonance frequency of water that occurs between different tissue types 3,4. It is hypothesized that these changes reflect cellular-scale magnetic susceptibility variations and the different compartmentation of each metabolite. A prominent finding is differences of the N-Acetylaspartate (NAA) resonance frequency in white matter, relative to those of creatine (Cre) and choline (Cho), which is believed to reflect the inter-axonal localization of this metabolite and susceptibility variations that are dependent on the orientation of the major axonal bundles relative to the applied B0 magnetic field. In this study the axonal orientation dependence of the metabolite frequency differences between NAA and creatine and NAA and choline were evaluated by combining voxel-based analysis results from a whole-brain MRSI measurement with diffusion-tensor imaging measures of the axonal orientation.METHODS
Volumetric brain MRSI (TE=70 ms), and DTI data (TE=80 ms, 12 directions with b=1000 s/mm2,) were obtained for 20 healthy subjects. The MRSI reconstruction included spectral analysis of the singlet resonances for NAA, Cre, and Cho, with measurement of individual resonance frequencies. All maps were then spatially registered using non-linear spatial transformation 5 at 1 mm isotropic resolution, which used the reference brain corresponding to the Type II white-matter tract atlas 6. Maps of the mean value across all subjects for each of the metabolite resonance frequencies were then generated using a spectral quality filter to exclude voxels with a spectral linewidth greater than 8 Hz. Maps of the mean frequency differences were then generated for NAA and Creatine, ΔNAA-Cre, NAA and Cho, ΔNAA-Cho, and Cre and Cho, ΔCre-Cho.
DTI data were reconstructed using DTIStudio 7. The diffusion tensor was then spatially normalized using LDDMM 8 using the reference MRI for the Type II white-matter tract atlas at 1 mm isotropic resolution 6, and the principal eigenvector, v1, and corresponding color maps representing the diffusion orientation were calculated in atlas space. A map of the angle of v1 relative to the applied B0 magnetic field, θ(x,y,z), was then calculated, with values from 0o (parallel to B0) to 90o (perpendicular to B0). This map was then averaged across all subjects to obtain the mean value of this angle, θ’, in addition to obtaining the mean value of the diffusion direction color map generated from v1. Maps of the metabolite frequency difference and the angle of the primary diffusion vector to the B0 field were then visually compared and locations of notable features identified from the white-matter tract atlas.
RESULTS AND DISCUSSION
In Figure 1 are shown images from two axial slices and a coronal slice for a) the mean DTI color map; b) mean ΔNAA-Cho; c) the mean angle, θ’, for which darker values are oriented closer to the direction of the B0; and d) the reference MRI used for spatial normalization. The ΔNAA-Cho map shows two prominent bilateral dark regions, indicating a smaller frequency difference between NAA and Cho, that are spatially coincident with the darker regions on the θ’ map that correspond to the internal capsule and the superior corona radiata, which are white-matter tracts that are approximately aligned along the direction of B0. These structures are identified in each image using the blue arrows in Fig. 1. Brighter regions can also be seen to correspond to the splenium and the thalamic radiations, as indicated by the green arrows, which are structures that are aligned perpendicular to the direction of the B0. The appearance of the map for ΔNAA-Cre was similar to that shown for ΔNAA-Cho, while that of ΔCre-Cho showed a different pattern of variations that were not strongly associated with any anatomic structures. Smaller regions that have a small angle to the B0 direction can also be seen in Fig. 1.ii.c that do not have corresponding features on the metabolite frequency difference map. In addition to being relatively small in comparison to the MRSI resolution these regions are also of limited extent in the inferior-superior direction. Therefore, orientation dependence of metabolite frequencies is most strongly demonstrated for larger axonal bundles that have a relatively slowly varying structure. This study provides further evidence for spatially-variant changes in metabolite resonance frequencies, with that of NAA being most strongly altered in the internal capsule and corona radiate, which are larger white-matter tracts that are roughly oriented along the direction of the B0 magnetic field.Acknowledgements
This work was supported by NIH grants R01EB016064 and R01CA172210.References
1. Maudsley AA, Goryawala MZ, Sheriff S. Effects of tissue susceptibility on brain temperature mapping. Neuroimage 2016, Sep 28. http://dx.doi.org/10.1016/j.neuroimage.2016.09.062.
2. Chadzynski GL, Bender B, Groeger A, Erb M, Klose U. Tissue specific resonance frequencies of water and metabolites within the human brain. J Magn Reson 2011;212(1):55-63.
3. He X, Yablonskiy DA. Biophysical mechanisms of phase contrast in gradient echo MRI. Proc Natl Acad Sci USA 2009;106(32):13558-13563.
4. Duyn JH, van Gelderen P, Li TQ, de Zwart JA, Koretsky AP, Fukunaga M. High-field MRI of brain cortical substructure based on signal phase. Proc Natl Acad Sci USA 2007;104(28):11796-11801.
5. Maudsley AA, Domenig C, Govind V, Darkazanli A, Studholme C, Arheart K, Bloomer C. Mapping of brain metabolite distributions by volumetric proton MR spectroscopic imaging (MRSI). Magn Reson Med 2009;61(3):548-559.
6. Oishi K, Faria A, Jiang H, et al. Atlas-based whole brain white matter analysis using large deformation diffeomorphic metric mapping: application to normal elderly and Alzheimer's disease participants. Neuroimage 2009;46(2):486-499.
7. Jiang H, van Zijl PC, Kim J, Pearlson GD, Mori S. DtiStudio: resource program for diffusion tensor computation and fiber bundle tracking. Comput Methods Programs Biomed 2006;81(2):106-116.
8. Ceritoglu C, Oishi K, Li X, Chou MC, Younes L, Albert M, Lyketsos C, van Zijl PC, Miller MI, Mori S. Multi-contrast large deformation diffeomorphic metric mapping for diffusion tensor imaging. Neuroimage 2009;47(2):618-627.
Figures
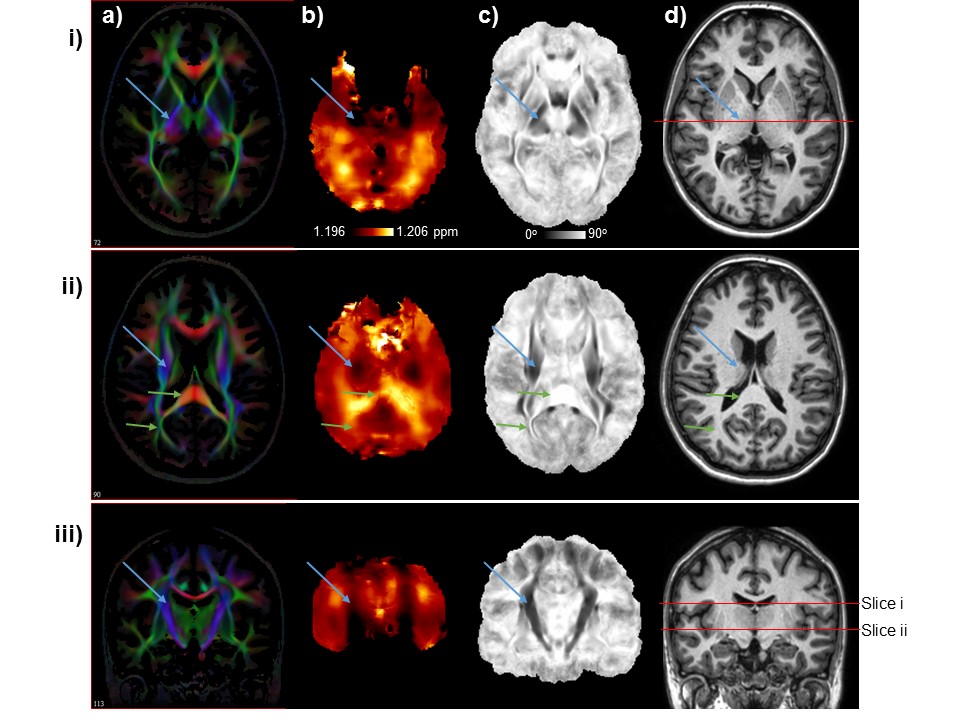
Images are shown for two axial slices (rows i and ii) and a coronal section (row iii) for: a) the mean DTI color map; b) mean ΔNAA-Cho; c) the mean value of the angle of the principal diffusion vector to the B0, for which darker values are oriented closer to the direction of the B0; and d) the reference MRI used for spatial normalization. Blue and green arrows mark the same regions on images within each row.