5468
Quantitative analysis of in vivo MEGA-PRESS spectra in mice at 9.4T1Department of Biomedical Engineering, Columbia University, New York, NY, United States, 2Department of Medicine, Columbia University, New York, NY, 3Bruker BioSpin, Billerica, MA, 4Departments of Neurology, Radiology or Psychiatry, Columbia University, New York, NY, 5Departments of Biomedical Engineering or Radiology and Biomedical Imaging, Yale University, New Haven, CT
Synopsis
As of yet J-difference editing methods such as MEGA-PRESS have not been applied to in vivo mouse studies due to low sensitivity and the lack of an automated program to analyze the data. To overcome the obstacles, a fully automated software toolkit MRSMouse was developed for the quantitative analysis of MEGA-PRESS data of the mouse brain. With MRSMouse, we demonstrated the feasibility and reproducibility of MEGA-PRESS for detection of GABA in the mouse brain using a Bruker BioSpec 94/20 9.4T system. During anesthesia, significant decreases of mouse thalamic GABA levels caused by isoflurane were noticed in vivo for the first time.
INTRODUCTION
The application of J-editing approaches to measure GABA in mice has been limited due to low sensitivity and the lack of an automated program to analyze the data. The purpose of this study is to describe the MRSMouse toolkit and to demonstrate its feasibility for quantifying Meshcher–Garwood point resolved spectroscopy (MEGA-PRESS) in the mouse brain at 9.4T.METHODS
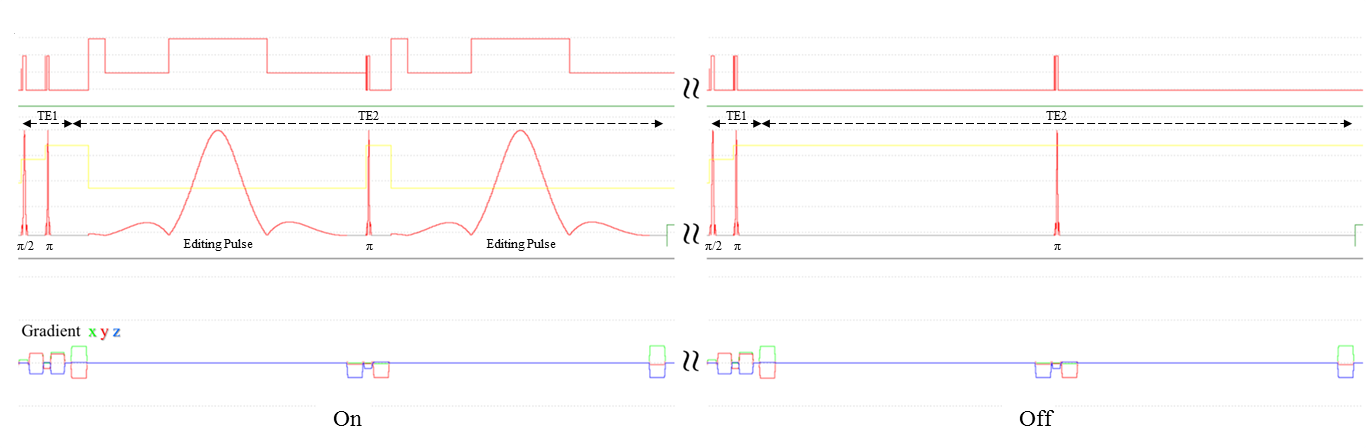
A Bruker BioSpec 9.4T system with ParaVision6.0.1 was used with a 23mm 1H circularly-polarized transmit/receive capable mouse head volume coil. MEGA-PRESS pulse sequence was implemented in ParaVision6.0.1 using standard acquisition parameters (Figure-1).
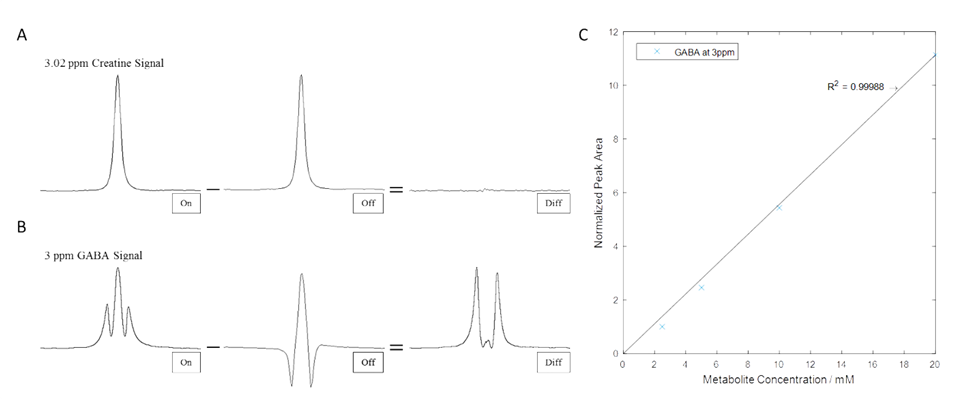
To verify the performance of the sequence, a series of in vitro samples of creatine (Cr) or GABA in Gadolinium doped water were prepared at 4 concentrations.
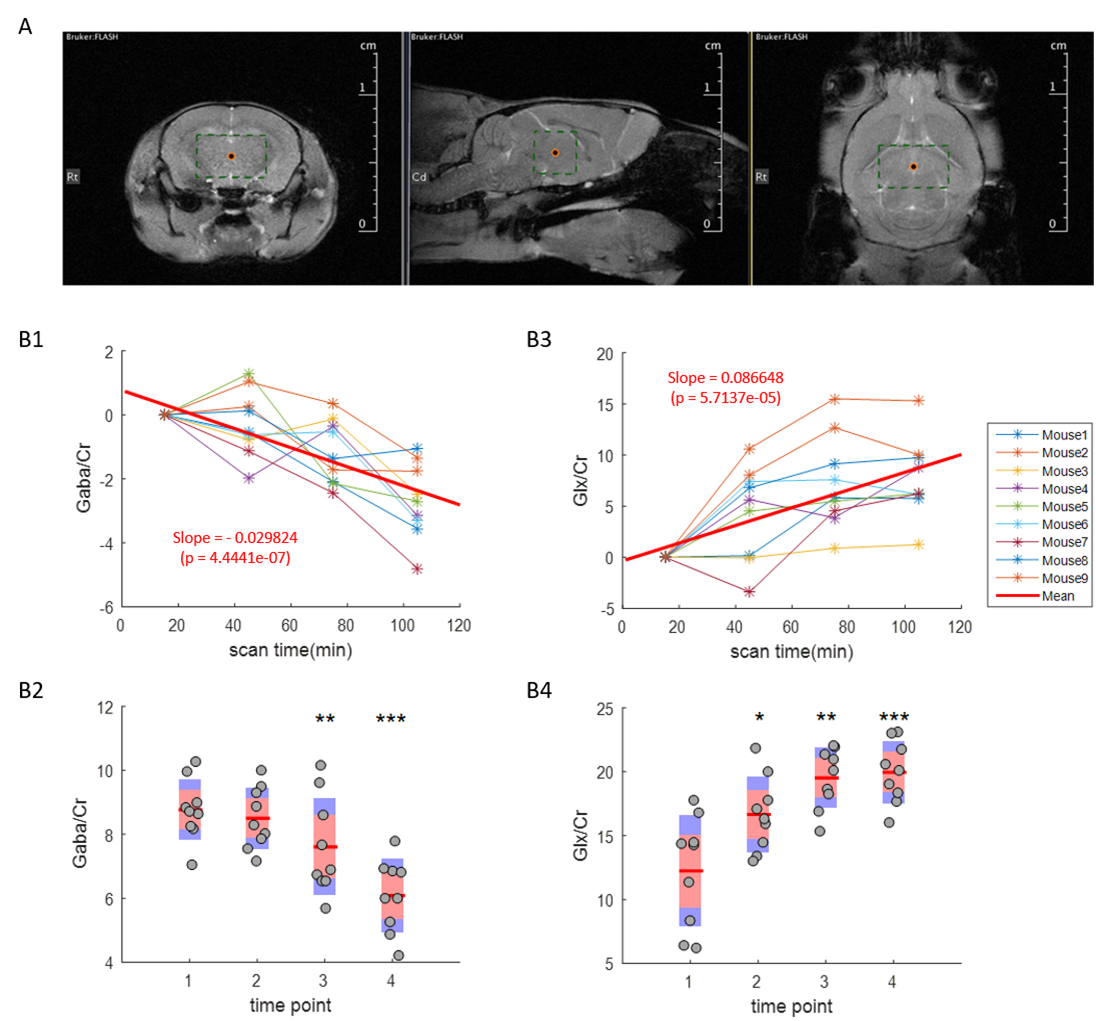
During animal study, four scans per mouse were acquired at the thalamus in a 2-hour time-course for 9 male wild-type C57BL/6J mice with isoflurane.
All datasets were analyzed by MRSMouse which has two modules: MRSMouseLoad and MRSMouseFit. MRSMouse was implemented in Matlab2015 and will be distributed under the GPL license.
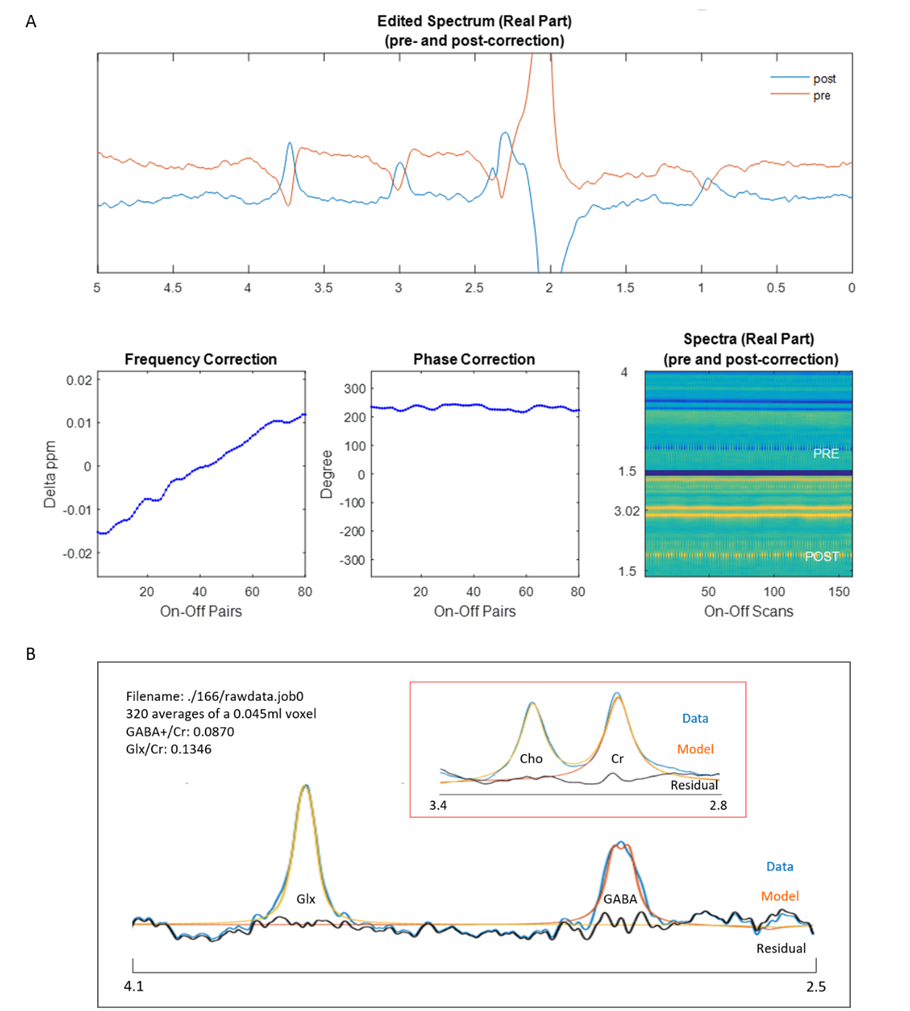
Bruker time-domain data was loaded by MRSMouseLoad. After correction for the digitization group delay, 0.03 ppm line broadening and zero-filling to 215 points were applied. A major limitation in all J-editing pulse sequences is that small changes in spectra frequency and phase will distort the edited spectrum. In our framework, the frequency correction was achieved by aligning the power spectrum of each ‘Off’ shot to their median spectrum by maximizing the cross-correlation over 0-4.3ppm. We implemented this method using icoshift1. To achieve accurate phase correction given the lower S/N available, we achieved phase correction for each frequency aligned ‘Off’ using ACME2, to get the optimal spectral form by minimizing a Shannon-type objective function. The same corrections were applied to its corresponding ‘On’/’Off’ spectrum. Time-resolved spectra were excluded before time averaging on the basis of being greater than three standard deviations from the mean in anyone of the following metrics: cross-correlations to the median spectrum, frequency shifts and zero-order phases. Rejections were applied in a pairwise manner. After corrections and outlier exclusions, time averaging was performed and the difference spectrum calculated.
Spectral fitting was done by MRSMouseFit with the principle that a measured 1H NMR spectrum can be approximated as a sum of the individual constituent metabolite 1H NMR spectra. GABA and Glx concentrations were determined by fitting the edited ‘Diff’ spectrum with simulated edited GABA and Glx spectra at 2.5-4.1ppm. Cr and choline concentrations were determined by fitting the ‘Off’ spectrum with simulated Cr and choline spectra at 2.8-3.4ppm. Simulated basis set was generated by NMRWizard3. The nonlinear fitting problem was solved using VARPRO4.
With MRSMouse, we investigated the sensitivity and reproducibility of the GABA measurement to validate the successful implementation and quantification of MEGA-PRESS in mice. We also assessed the use of isoflurane as an anesthetic given the fact that previous study has shown GABA level was significantly decreased by isoflurane in the rat or cat brain5,6.
RESULTS
In vitro phantom results are demonstrated in Figure-2 with expected spectra shapes and good agreement with known concentrations.
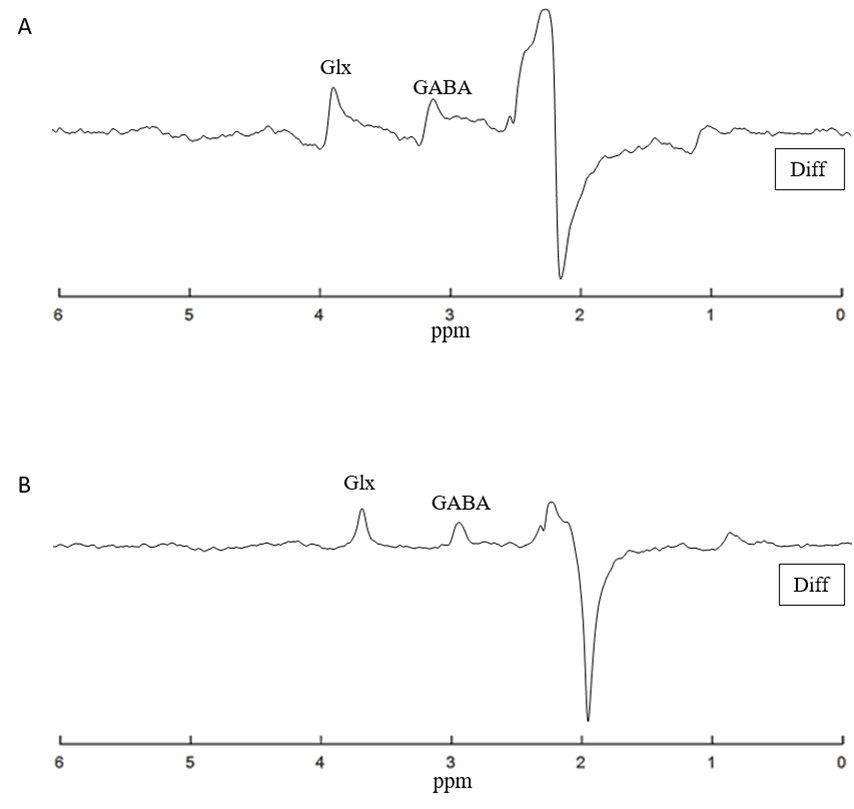
Detection and quantification of thalamic GABA levels were successfully obtained. Figure-3 summarizes the reports of MRSMouse. Figure-4 compares the performance between Gannet7 (modified by us to work with Bruker data) and MRSMouse. MRSMouse has better performance, revealing that the approaches we chose are more robust when dealing with in vivo mouse data with reduced S/N.
Figure-5 shows the time-course of thalamic GABA levels during anesthesia. The coefficient-of-variation across subjects was 10.90% for the initial GABA/Cr ratios. Isoflurane caused a significant decrease in GABA levels.
DISCUSSION
For in vivo MEGA-PRESS data of mouse brain, the limited S/N puts the standard Cr based phase and frequency correction approach at a disadvantage. In the present study we use ‘whole’ spectrum (without the residual water) based frequency and phase correction methods which we demonstrated perform well even at low S/N levels at which per scan Cr correction algorithms fail.
GABA levels can be quantified either relative to NAA, unsuppressed water or Cr.
It is also important to note that the GABA value reported in this study includes co-edited MM contributions and therefore should be interpreted as GABA+.
CONCLUSION
We present a new tool, MRSMouse, designed for automated analysis of MEGA-PRESS spectra of mouse brain. With Bruker raw data supported, our toolkit is fully automated and rater-independent and is specifically designed to deal with low S/N spectra. Mouse thalamic GABA levels decreased significantly by isoflurane. We anticipate that it will be a useful method for the adoption of GABA editing studies in transgenic mice.Acknowledgements
No acknowledgement found.References
1. Savorani F, Tomasi g, Engelsen SB. icoshift: A versatile tool for the rapid alignment of 1D NMR spectra. J Magn Reson 2010;202(2):190-202.
2. Chen L, Weng ZQ, Goh LY, Garland M. An efficient algorithm for automatic phase correction of NMR spectra based on entropy minimization. J Magn Reson 2002;156:164-168.
3. de Graaf RA, Chowdhury GMI, Behar KL. Quantification of high-resolution 1H-[13C] NMR spectra from rat brain extracts. Anal Chem 2014;86(10):5032–5038.
4. O’Leary DP, Rust BW. Variable projection for nonlinear least squares problems. Comput Optim 2013;54:579.
5. Vanini G, Wathen BL, Lydic R, Baghdoyan HA. Endogenous GABA levels in the pontine reticular formation are greater during wakefulness than during REM sleep. J Neurosci 2011;31(7):2649-2656.
6. Watson CJ, Lydic R, Baghdoyan HA. Sleep duration varies as a function of glutamate and GABA in rat pontine reticular formation. J Neurochem 2011;118:571–580.
7. Edden RA, Puts NA, Harris AD, Barker PB, Evans CJ. Gannet: a batch-processing tool for the quantitative analysis of gamma-aminobutyric acid-edited MR spectroscopy spectra. J Magn Reson Imaging 2014;40(6):1445-52.
Figures