5467
A Subspace Approach to Spectral Quantification1Department of Electrical and Computer Engineering, University of Illinois at Urbana-Champaign, Urbana, IL, United States, 2Beckman Institute for Advanced Science and Technology, University of Illinois at Urbana-Champaign, Urbana, IL, United States
Synopsis
This work presents a novel spectral model for spectral quantification, which represents each spectral component using a subspace instead of a parametric basis function with unknown parameters. The proposed model enables efficient and effective incorporation of both spectral and spatial prior information to improve the quantification performance. The proposed method is validated using both simulation and experimental data, demonstrating superior performance to existing methods using parametric spectral bases. This method is expected to be useful for processing noisy MRSI data.
Introduction
Spectral quantification is an important problem in MRSI data processing, for which many computational solutions have been proposed. Depending on the spectral models used, existing algorithms can be classified into three categories: 1) frequency integration methods based on Fourier spectral models; 2) linear prediction methods based on Lorentzian spectral models [1, 2] and 3) optimization methods using physics-based spectral basis [3-6]. This paper presents a brand-new spectral model for spectral quantification, which represents each spectral component using a subspace instead of a single spectral basis function with unknown spectral parameters. This new model enables effective use of both spatial and spectral priors to improve spectral quantification. Performance of the proposed method has been demonstrated using both simulation and in-vivo experimental data.Method
Subspace spectral model:
The current spectral models express the measured data from $$$L$$$ compounds (or spectral components) as
\begin{equation}s(t)=\sum^L_{l=1}C_l\phi_l(\vec{\beta},t) \tag{1}\end{equation}
where $$$\phi_l(\vec{\beta},t)$$$ is a spectral basis function generated using quantum-simulation for a particular compound and $$$\vec{\beta}$$$ are spectral parameters used to accommodate spectral variations under practical experimental conditions (e.g., lineshape, etc.). Determining the $$$\vec{\beta}$$$ often entails solving a nonlinear optimization problem. Here we propose a novel subspace model to represent the entire set of functions that are now represented by a single parametric function $$$\phi_l(\vec{\beta},t)$$$ with unknown $$$\vec{\beta}$$$. More specifically, let $$$\vec{\beta}$$$ have prior distribution $$$p(\vec{\beta})$$$ and $$$\{\phi_l(\vec{\beta_m},t)\}^M_{m=1}$$$ be the set of functions drawn according to $$$p(\vec{\beta})$$$. In practice, $$$\{\phi_l(\vec{\beta_m},t)\}^M_{m=1}$$$ often occupy a low-dimensional subspace. In other words, $$$\phi_l(\vec{\beta},t)$$$ can be expressed as
$$\phi_l(\vec{\beta},t)=\sum^{Q_l}_{q=1}a_{l,q} b_{l,q}(t) \tag{2}$$
where the basis functions $$$\{b_{l,q}(t)\}^{Q_l}_{q=1}$$$ can be determined from the eigenvectors of the following Casorati matrix,
$$ \begin{bmatrix} \phi_l(\beta_1,t_1) & \phi_l(\beta_1,t_2) & \phi_l(\beta_1,t_3) & \dots & \phi_l(\beta_1,t_n) \\ \phi_l(\beta_2,t_1) & \phi_l(\beta_2,t_2) & \phi_l(\beta_2,t_3) & \dots & \phi_l(\beta_2,t_n) \\ \vdots & \vdots & \vdots & \ddots & \vdots \\ \phi_l(\beta_M,t_1) & \phi_l(\beta_M,t_2) & \phi_l(\beta_M,t_3) & \dots & \phi_l(\beta_M,t_n) \end{bmatrix} $$
With (2), we will obtain a subspace model for $$$s(t)$$$ or for $$$s(\vec{x},t)$$$ (in the case of spectroscopic imaging) as:
$$ s(t)=\sum^L_{l=1}\sum^{Q_l}_{q=1}a_{l,q}b_{l,q}(t) \quad or \quad s(\vec{x},t)=\sum^L_{l=1}\sum^{Q_l}_{q=1}a_{l,q}(\vec{x})\cdot b_{l,q}(t) \tag{3}$$
where $$$a_{l,q}$$$ absorbs the $$$C_l$$$ in (1).
Spectral quantification with spatiospectral constraints:
The linear coefficients $$$\{a_{l,q}(\vec{x})\}$$$ are obtained by solving the following optimization problem:
$$ \{a_{l,q}\} = arg \underset{\{a_{l,q}\}}{min} ||s(\vec{x},t)-\sum_l \sum_q a_{l,q}(\vec{x})\cdot b_{l,q}(t)||_2^2+R(\{a_{l,q}(\vec{x})\}) \tag{4}$$
where $$$s(\vec{x},t)$$$ is the acquired MRSI data, $$$\{ a_{l,q}(\vec{x})\}$$$ are the desired coefficients containing concentration information, $$$\{ b_{l,q}(t)\}$$$ are the predetermined basis functions that span the subspace for the $$$l^{th}$$$ spectral component and $$$R(\cdot )$$$ is a regularization function. Here, in this work we use a weighted-L2 regularization for $$$R(\cdot )$$$.
Results
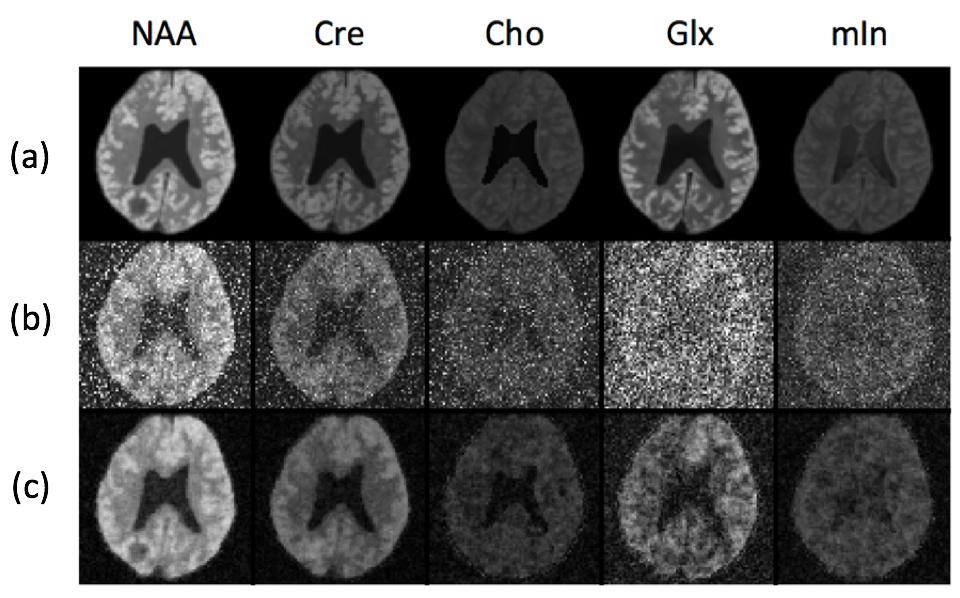
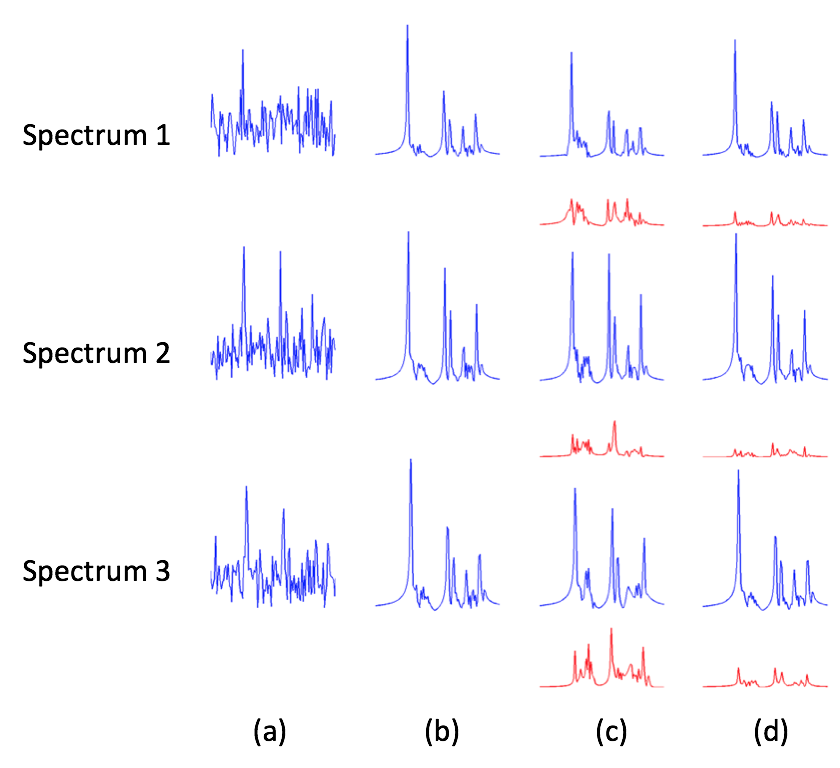
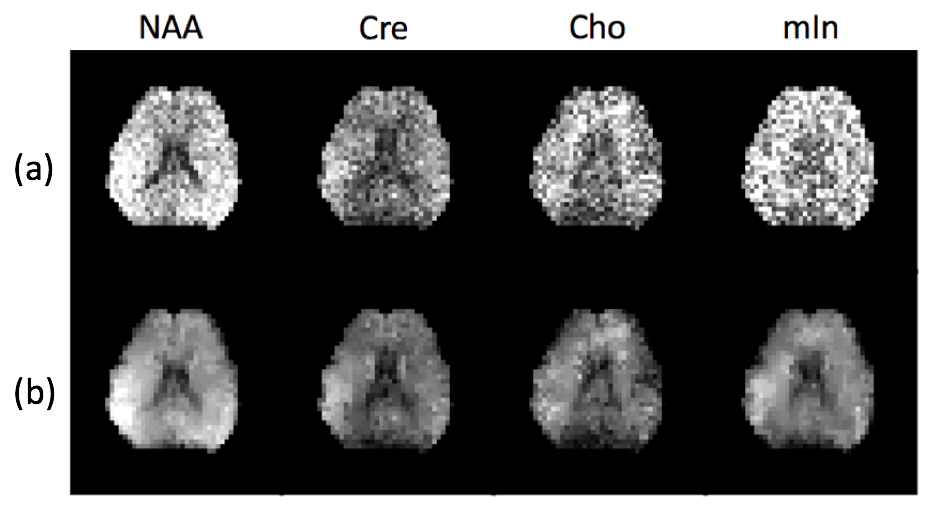
The proposed method has been evaluated using both simulation and experimental data. The simulation phantom is composed of six common metabolite signals: NAA, Cre, Cho, mIn, Glu and Gln. Their concentrations are set to be smooth within tissues of the same type but vary across them. Strong white Gaussian noise was also added to the data. Figure 1 shows the comparison of the proposed method to one of the state-of-the-art methods called QUEST [5]. Figure 2 shows the spectra from three locations comparing the quantification accuracy among different methods. As the results show, the proposed method performed better than QUEST. In-vivo data acquired from a healthy subject on a 3T scanner using an echo-planar spectroscopic imaging (EPSI) sequence were also used for evaluating the proposed method. Figure 3 shows that the concentration maps obtained using QUEST have much higher spatial variations than those obtained using the proposed method.
Conclusions
This work proposes a novel method for spectral quantification, exploiting a subspace-based model for each spectral component. Both simulation and in-vivo experimental studies show that the proposed method yields significantly improved quantification results compared to existing methods using parametric spectral basis functions. The proposed method is expected to be useful for processing noisy MRSI data.Acknowledgements
This work was supported in part by the following research grants: NIH-R21-EB021013-01and NIH-1RO1-EB013695.References
[1] Barkhuijsen, H., De Beer, R., Bovee, W. M. M. J., Creyghton, J. H. N., & Van Ormondt, D. (1985). Application of linear prediction and singular value decomposition (LPSVD) to determine NMR frequencies and intensities from the FID. Magnetic Resonance in Medicine, 2(1), 86-89.
[2] Barkhuijsen, H., De Beer, R., & Van Ormondt, D. (1987). Improved algorithm for noniterative time-domain model fitting to exponentially damped magnetic resonance signals. Journal of Magnetic Resonance, 73(3), 553-557.
[3] Vanhamme, L., van den Boogaart, A., & Van Huffel, S. (1997). Improved method for accurate and efficient quantification of MRS data with use of prior knowledge. Journal of Magnetic Resonance, 129(1), 35-43.
[4] Provencher, S. W. (1993). Estimation of metabolite concentrations from localized in vivo proton NMR spectra. Magnetic Resonance in Medicine, 30(6), 672-679.
[5] Ratiney, H., Sdika, M., Coenradie, Y., Cavassila, S., Ormondt, D. V., & Graveron-Demilly, D. (2005). Time-domain semi-parametric estimation based on a metabolite basis set. NMR in Biomedicine, 18(1), 1-13.
[6] Ning, Q., Ma, C., Lam, F., & Liang, Z. P. (2016). Spectral quantification for high-resolution MR spectroscopic imaging with spatiospectral constraints. IEEE Transactions on Biomedical Engineering, In Press.
Figures