5466
Magnetization exchange between water and downfield metabolites in human brain at 9.4T1Depts. Radiology and Clinical Research, University Bern, Bern, Switzerland, 2Institute for Biomedical Engineering, UZH and ETH Zurich, Zurich, Switzerland, 3Max Planck Institute for Biological Cybernetics, Tuebingen, Germany, 4Center for Stroke Research Berlin (CSB), Charité Universitätsmedizin Berlin, Berlin, Germany
Synopsis
Ultra-high field strengths provide higher signal to noise ratio and improved separation of metabolites in spectroscopy, allowing for more precise characterization of peaks. In particular, this improved peak resolution may be of benefit for characterization of the downfield (5-10ppm) spectrum, which is not yet well characterized; this experiment aims to improve knowledge of downfield peaks by investigating their exchange rates and T1 values at 9.4T, using inversion transfer experiments and metabolite cycling to allow for non-water suppressed acquisition.
Introduction and Purpose
Ultra-high field strengths provide higher signal to noise ratio and improved separation of metabolites in spectroscopy, allowing for more precise characterization of peaks. In particular, this improved peak resolution may be of benefit for characterization of the downfield (5-10ppm) spectrum, where peaks have lower signal intensity and are more difficult to separate at lower field strengths[1,2]. The downfield spectrum may provide information on metabolites which are not represented upfield, as well as on exchanging species, which are also of interest for chemical exchange saturation transfer experiments. However, the downfield spectrum is not yet well characterized; this experiment aims to improve knowledge of downfield peaks by investigating their exchange rates and T1 values at 9.4T, using inversion transfer experiments and metabolite-cycling to allow for non-water suppressed acquisition.Materials and Methods
Healthy volunteers were scanned using a 9.4T Siemens whole-body human MRI scanner and a home-built proton coil with 8-transmit and 16-receive channels[3]. A 40x20x15mm3 region was selected in a mostly white matter (WM) area above the ventricles for eleven volunteers; a 20x20x30mm3 region was selected in a mostly grey matter (GM) area in the visual cortex for a further ten volunteers. Second order FASTERMAP B0 shimming[4] and voxel-based power calibration[5] were used. An optimized 22 ms asymmetric adiabatic metabolite-cycling pulse was applied in the TM period of a STEAM sequence with TR/TE/TM=3000/8/45 ms[6]. Spectra without pre-inversion of water were acquired, as optimized separately for the upfield and downfield range, and an inversion transfer series was recorded for the downfield spectrum with a water inversion pulse (bandwidth 100Hz) at a range of inversion times (20, 75, 150, 300, 650, 1300, 3000ms; 96 averages each). One volunteers’ data set was removed from each of the WM and GM groups due to motion and ghosting artifacts.
The overall averaged data sets from each series were used to develop a spectral model of partially overlapping signals in FiTAID[7]; prior knowledge was defined with fourteen peaks of interest in the 5 to 9ppm region. The N-acetylaspartate (NAA) peak was defined as a binary pattern, as modeled in VESPA[8]. Homocarnosine (hCs) was modeled as 2 peaks at predefined chemical shifts[9].
Results
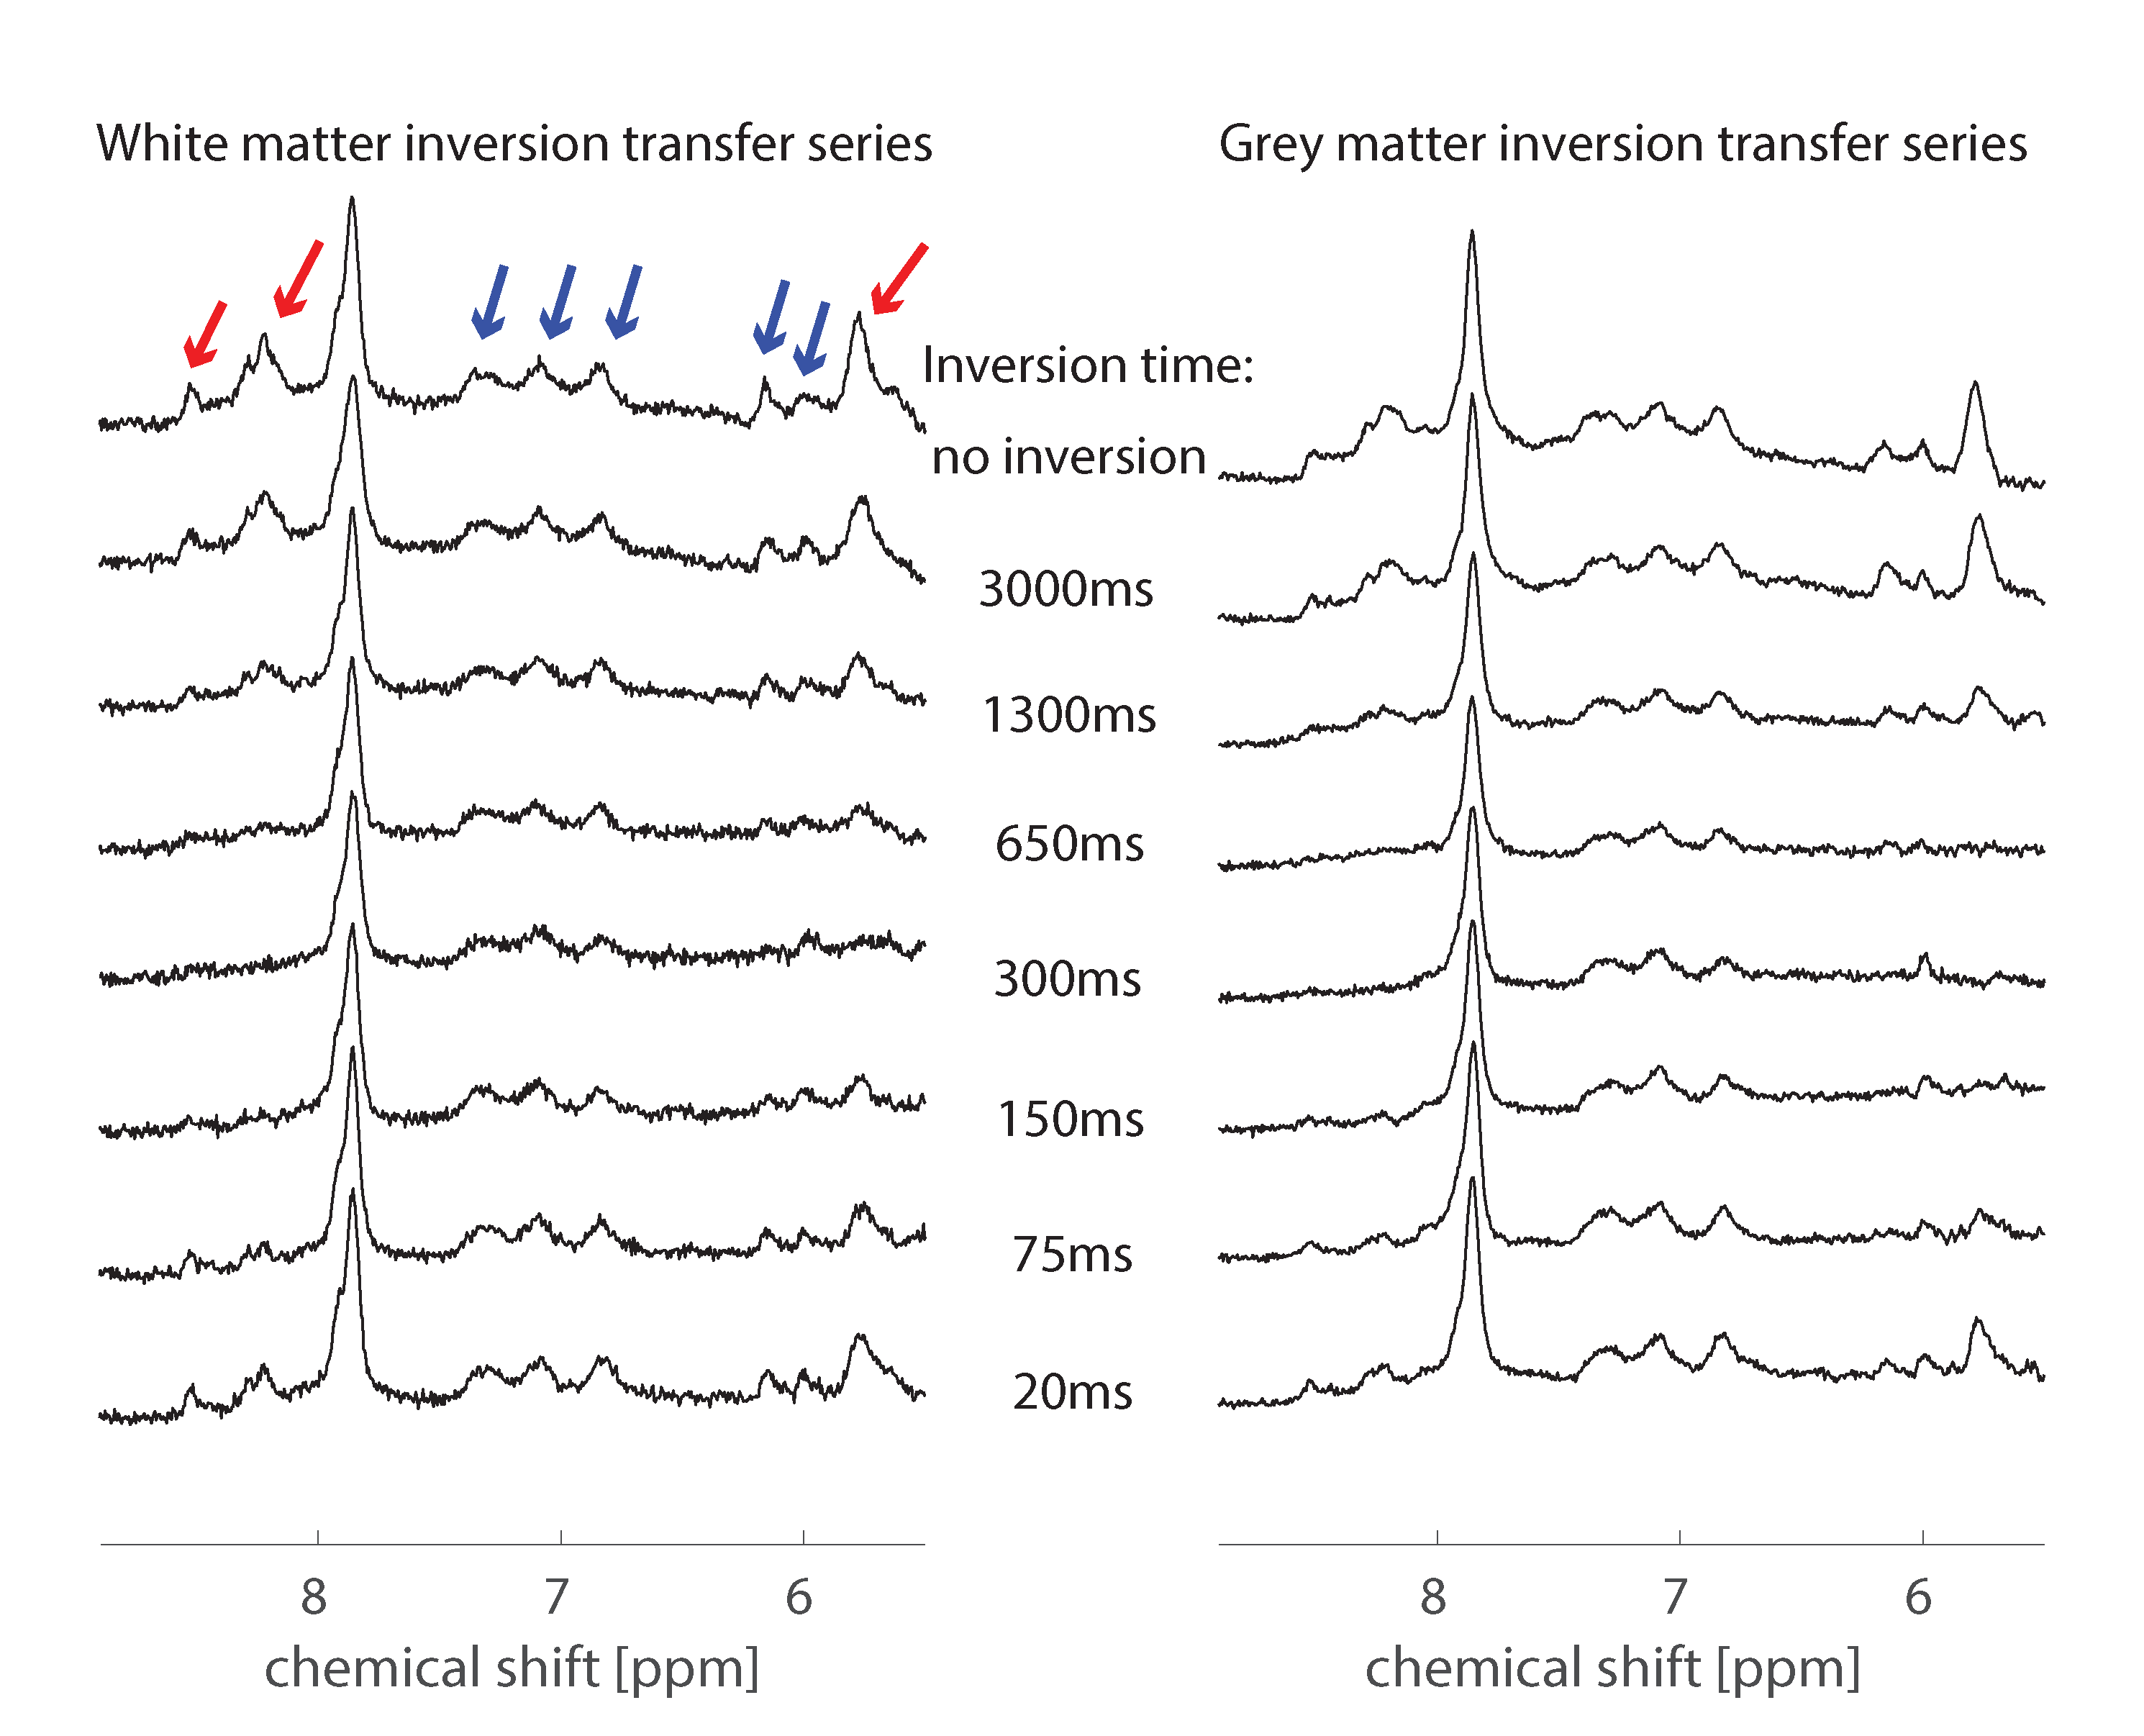
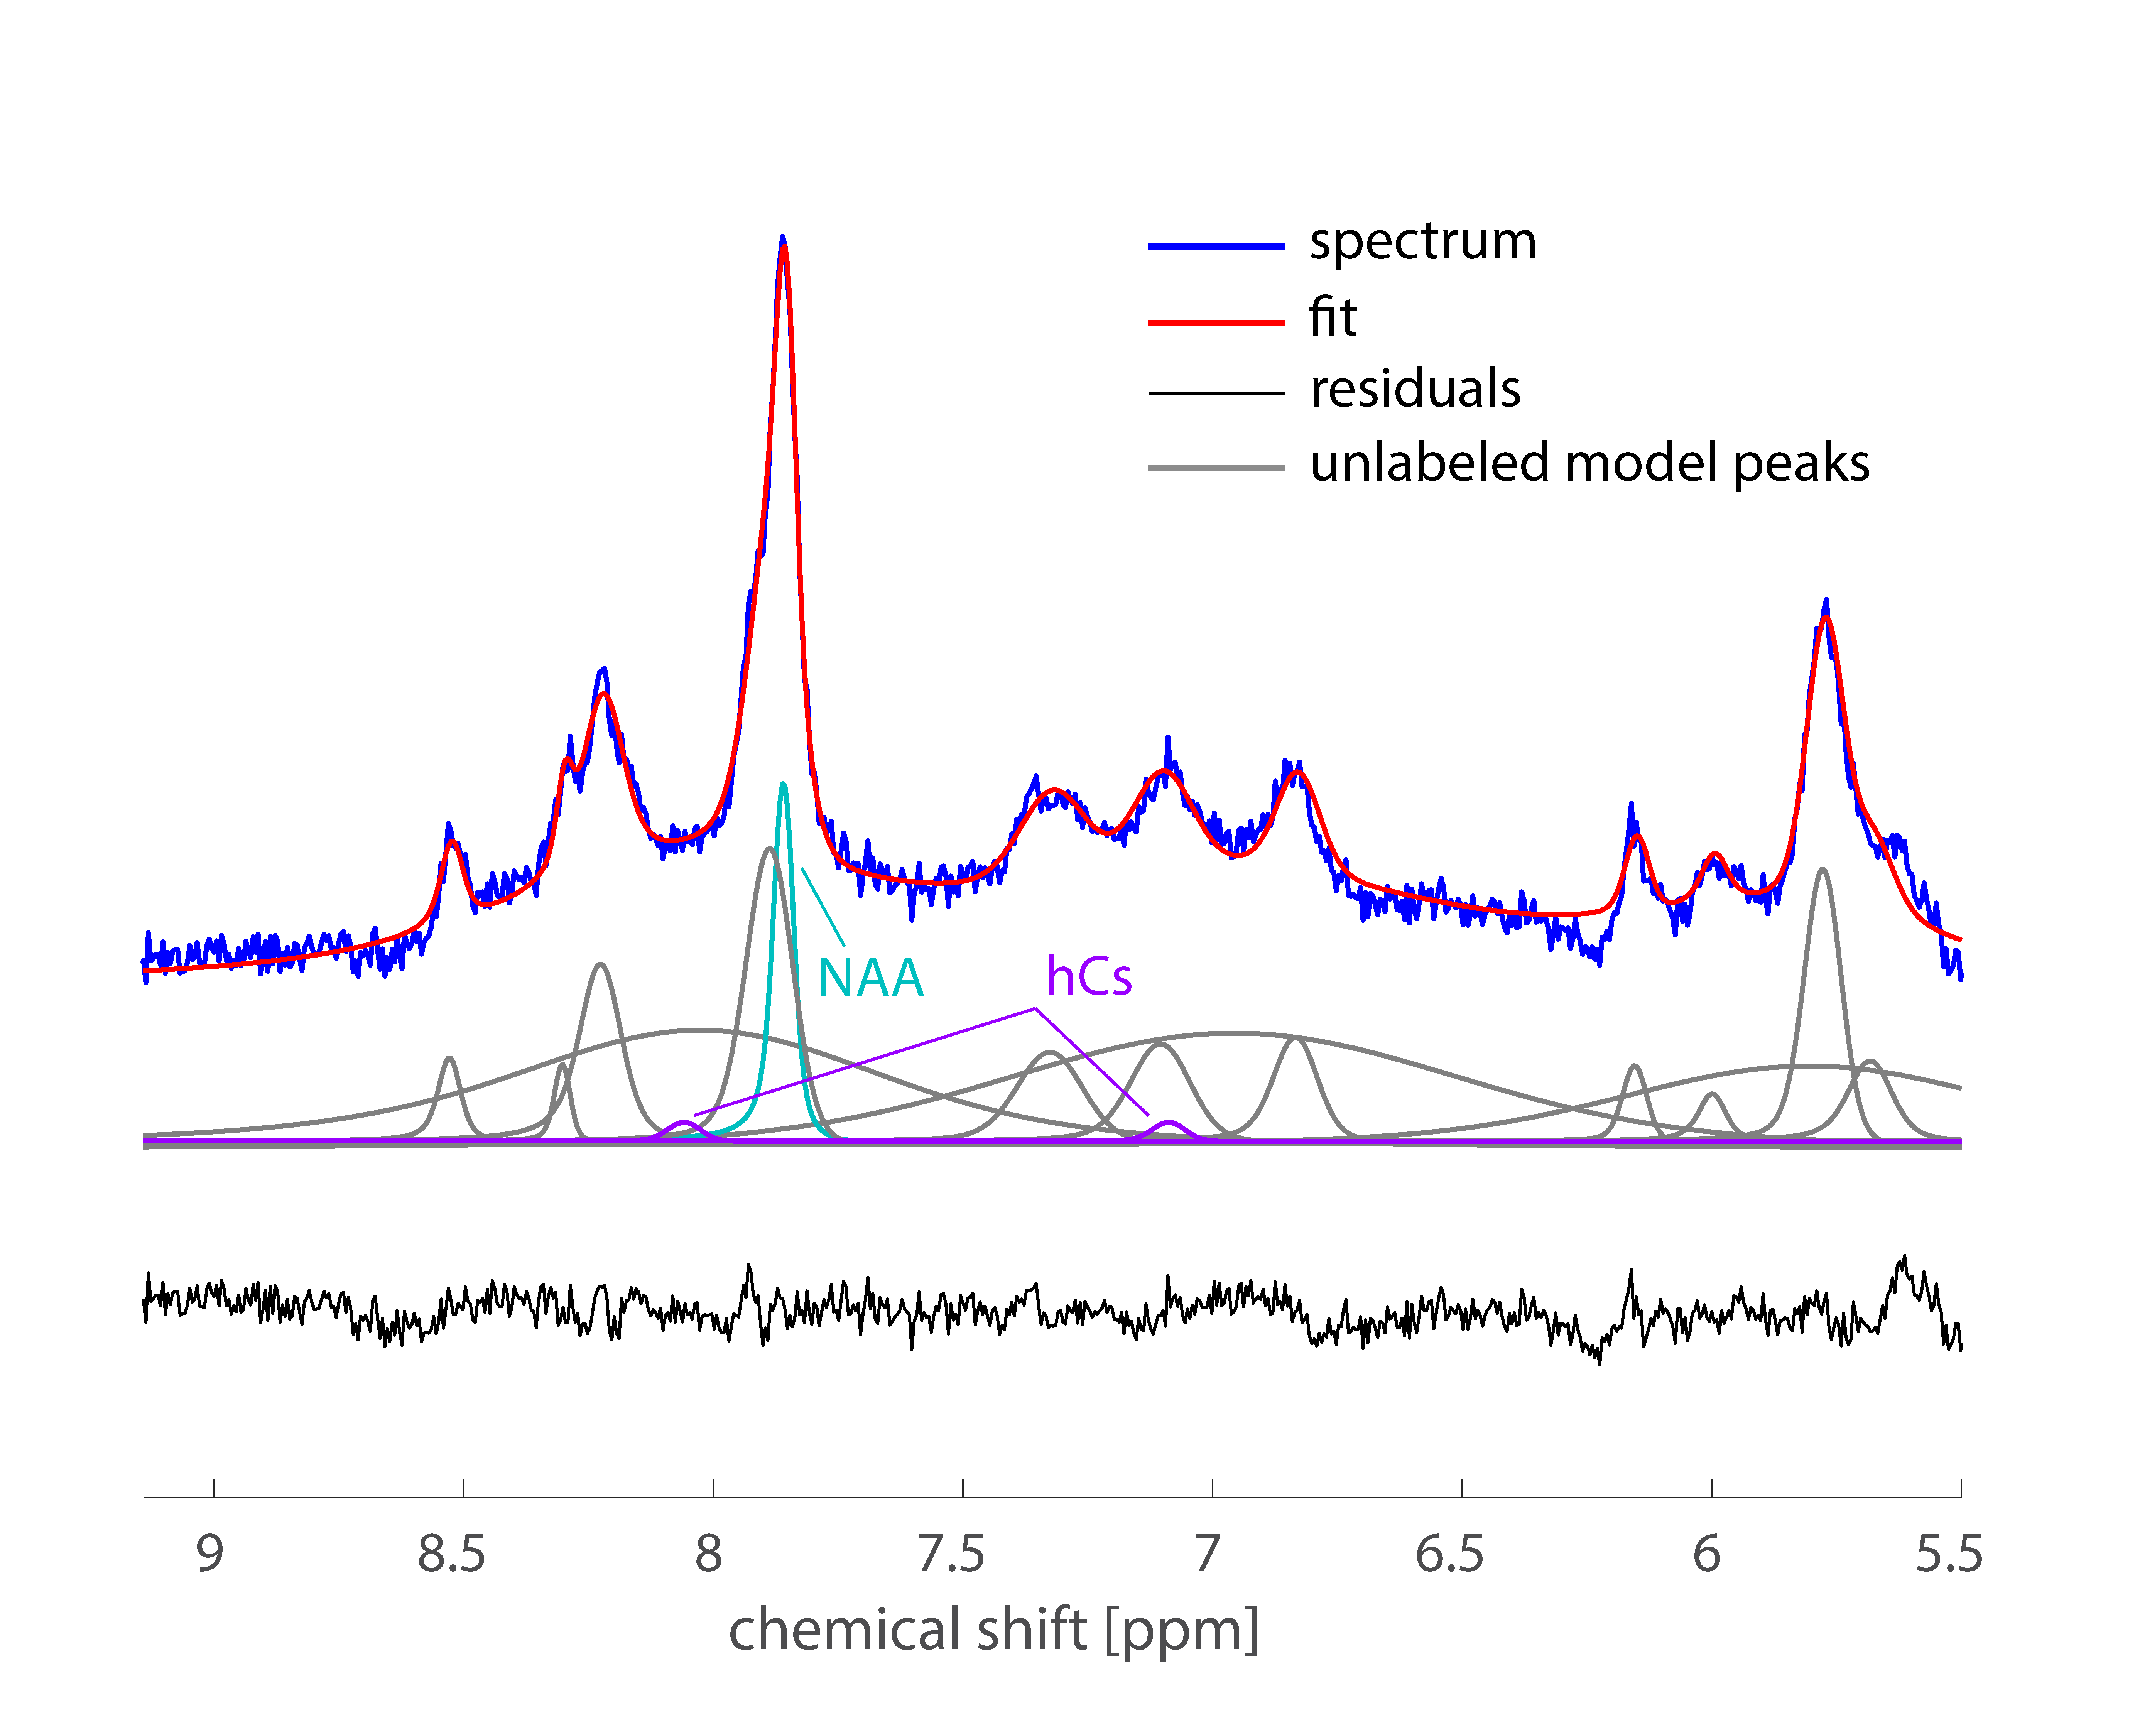
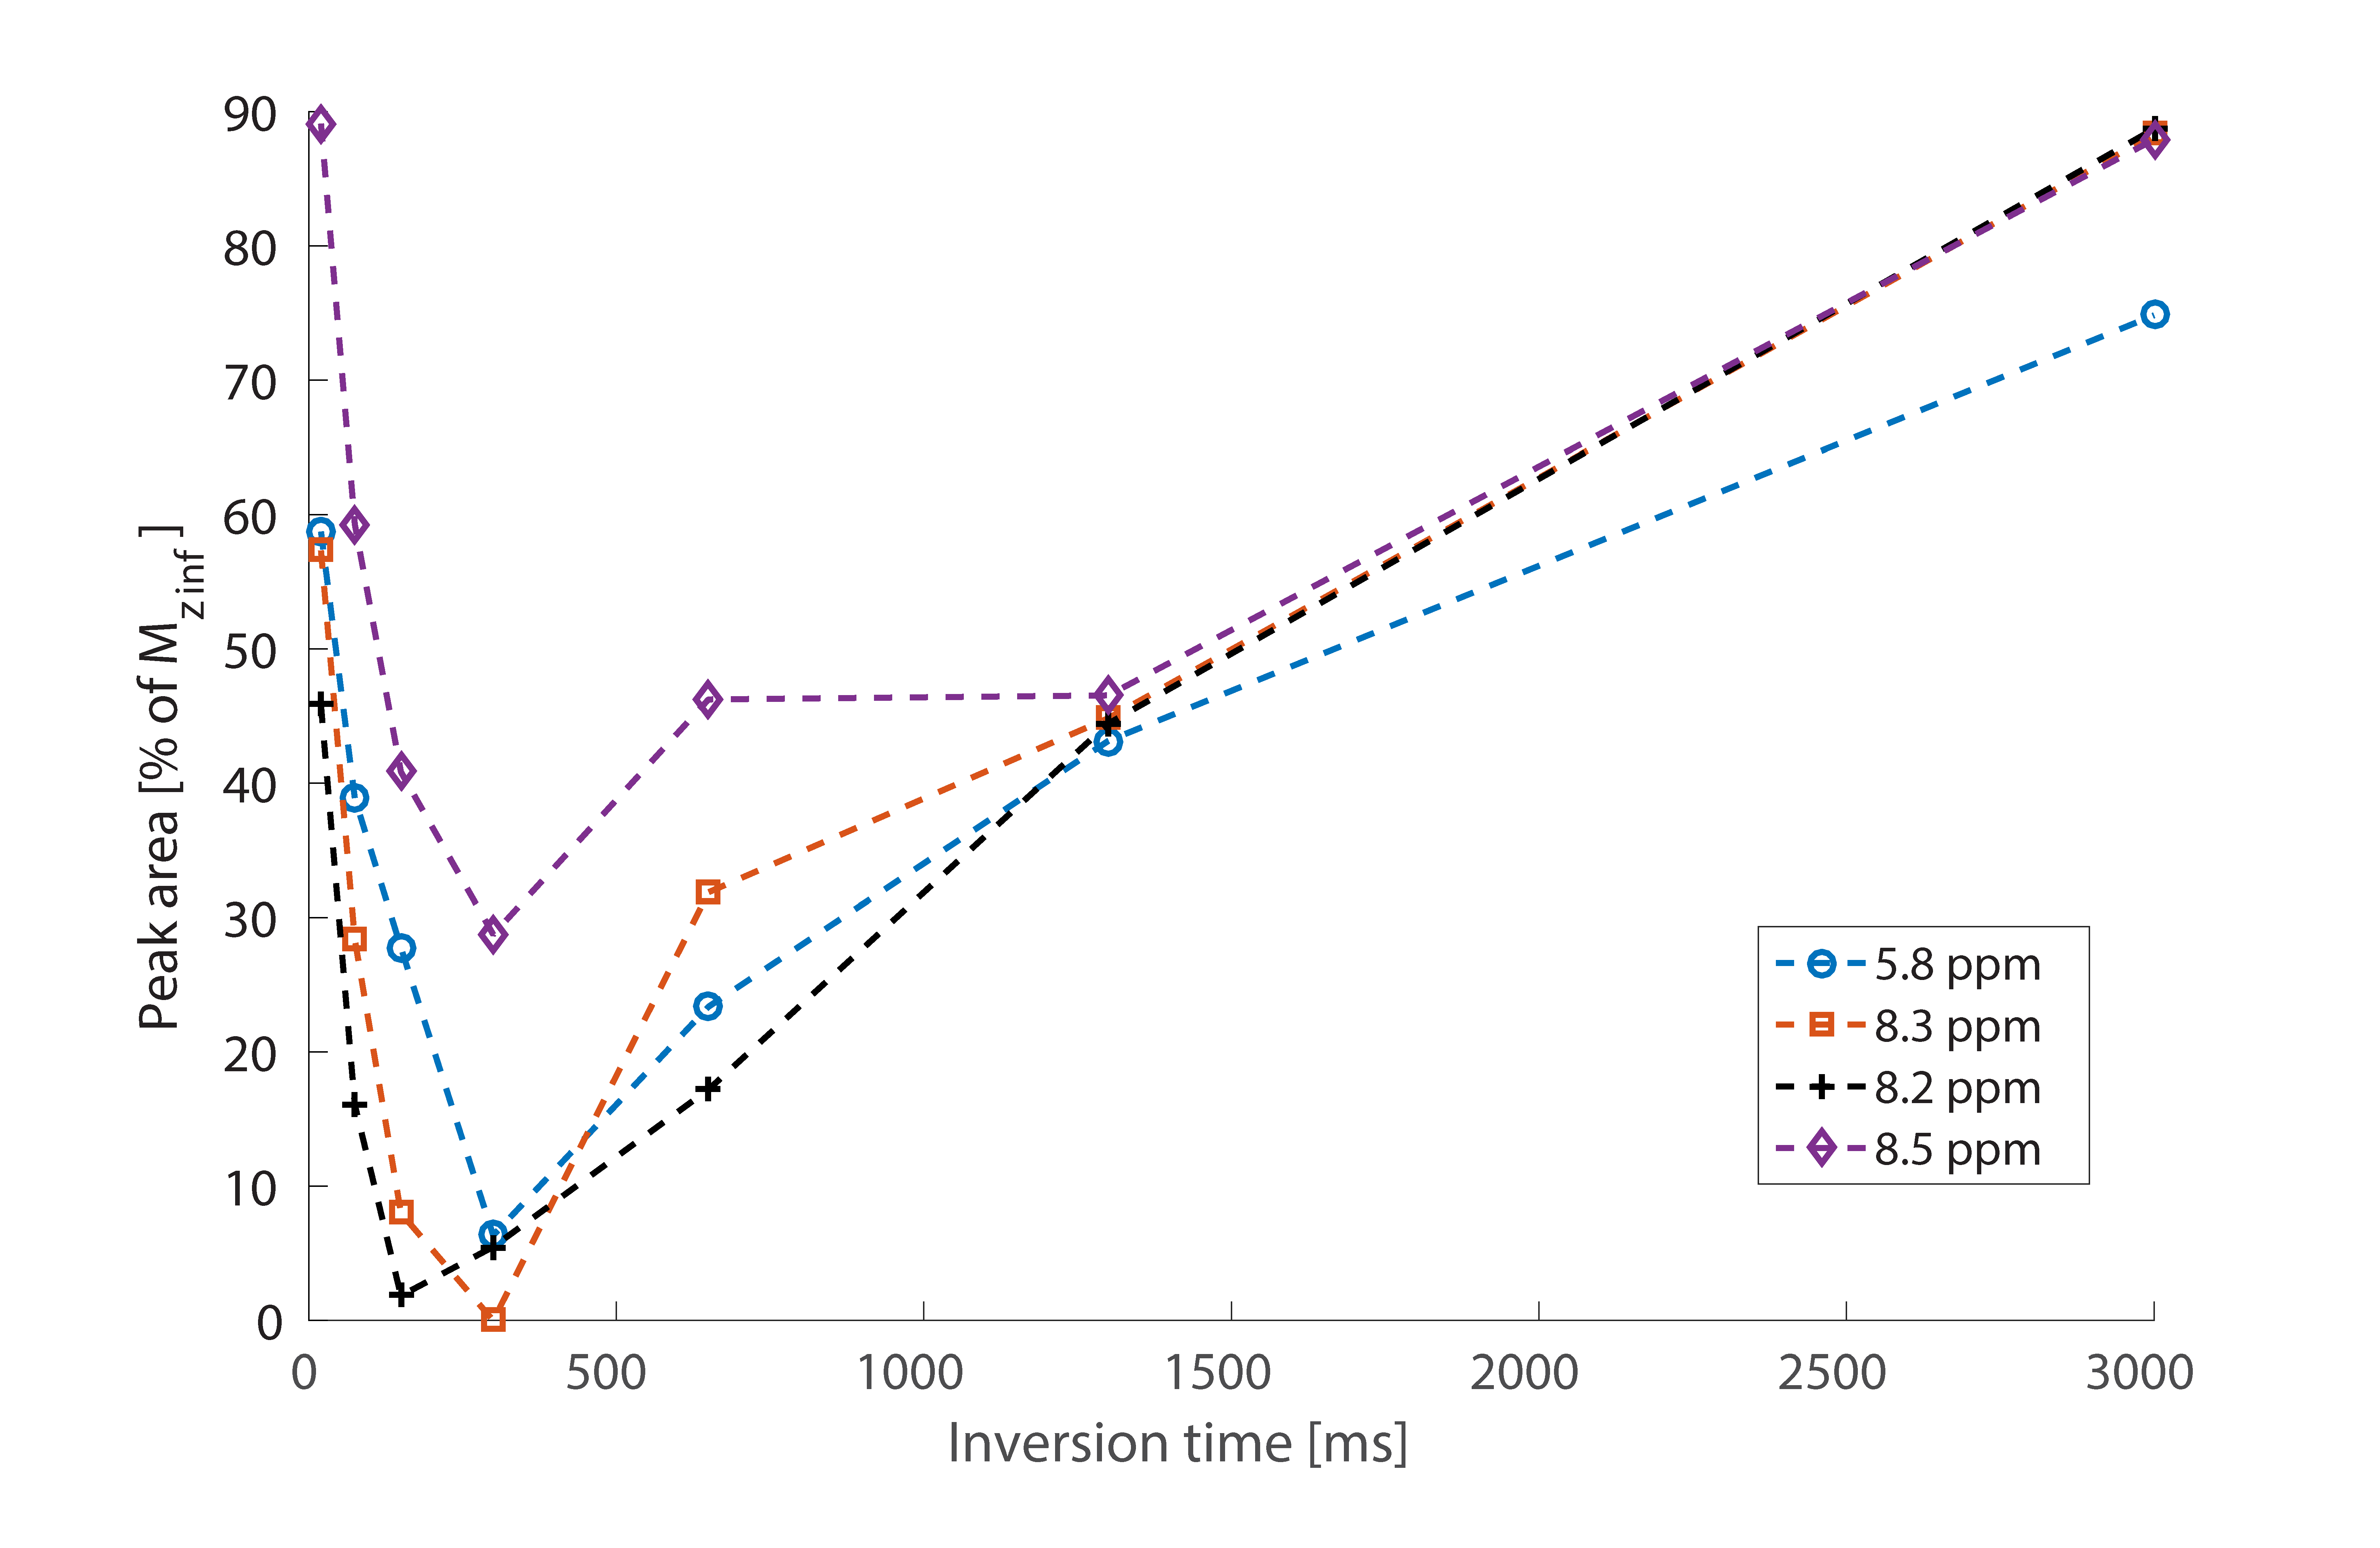
Averaged downfield spectra over all volunteers for the white and grey matter areas are shown in Fig. 1. A preliminary model for the averaged white matter downfield spectrum is shown in Fig. 2. Areas from fast exchanging peaks (as a percentage of respective peak areas from the spectrum without water inversion) as highlighted in red in Fig. 1 are plotted vs. inversion transfer time in Fig. 3.Discussion
The inversion transfer average series shown in Fig. 1 clearly visualizes peaks that are strongly modulated in intensity by exchanging magnetization with the inverted water signal. In particular, peaks highlighted by red arrows show fast exchange, leading to almost complete disappearance of the respective signals for a water inversion delay of about half a second. These peaks are assigned to amide protons in the 8.2-8.5 ppm range, while the 5.8 ppm peak has been suggested to be from urea[10]. Other peaks that are exchanging, albeit more slowly, are highlighted by blue arrows. These peaks presently remain unlabeled with potential assignments discussed in Ref. 9. NAA at 7.8ppm is also expected to exchange; however, it exchanges very slowly[1]. The WM and GM spectra are very similar, with only minor differences, such as the NAA peak, which shows a clearer shoulder in WM and the 8.2-8.5 ppm peaks that are sharper and better defined in WM.
Fig. 2 demonstrates that the preliminary fitting model captures most of the peaks very well, as confirmed by the residuals. The improved peak separation at ultra-high field has allowed for more peaks to be included in the model compared to the one used previously at 3T[1] and 7T[10]. In particular, it was possible to model more peaks closer to water for the 9.4T metabolite-cycling data than at 3T. Furthermore, the 8.2 ppm peak can be separated into two distinct peaks at 9.4T. At 7T, the model is similar; however, water suppression was used at 7T so the fast-exchanging peaks (5.8, 8.2, 8.3, and 8.5ppm) were much smaller or not visible. Hence, the 8.2-8.5 ppm region was therefore not modeled as distinct peaks at 7T[10].
The quantitative extent of difference in exchange rate and T1 between the fast and slowly exchanging peaks, as well as the first quantitative evaluation of exchange rate for urea, will be obtained by Bloch McConnell simulations in analogy to Ref. 1. In addition, quantitative comparison between upfield and downfield spectra is also under way.
Acknowledgements
This research was supported by the Swiss National Science Foundation (#320030_156952).References
1. MacMillan EL, Chong DGQ, Dreher W, Henning A, Boesch C, Kreis R. Magnetization exchange with water and T1 relaxation of the downfield resonances in human brain spectra at 3.0 T. Magn Reson Med 2011;65:1239-1246.
2. Kreis R, Boesch C, Vermathen P. Characterization of the downfield part of the human cerebral 1H MR spectrum at 3T. Proc Intl Soc Mag Reson Med 2006: 2636.
3. Avdievich N, Giapitzakis I, Pfrommer A, Henning A. Optimization of the Transceiver Phased Array for Human Brain Imaging at 9.4 T: Loop Overlapping Rediscovered. Proc Intl Soc Mag Reson Med 2016:0169.
4. Gruetter R, Tkac I. Field mapping without reference scan using asymmetric echo-planar techniques. Magn Reson Med 2000;43:319-23.
5. Versluis MJ, Kan HE, van Buchem MA, Webb AG. Improved signal to noise in proton spectroscopy of the human calf muscle at 7 T using localized B1 calibration. Magn Reson Med 2010;63:207-211.
6. Giapitzakis IA, T. S, Avdievich N, Kreis R, Henning A. Optimisation of Asymmetric Adiabatic Pulses for Single Voxel Metabolite Cycled 1H-MRS in the Human Brain at 9.4 Tesla. Proc Intl Soc Mag Reson Med 2014:2895.
7. Chong DGQ, Kreis R, Bolliger C, Boesch C, Slotboom J. Two-dimensional linear-combination model fitting of magnetic resonance spectra to define the macromolecule baseline using FiTAID, a Fitting Tool for Arrays of Interrelated Datasets. Magn Reson Mater Phy 2011;24:147-164.
8. Soher, B. J., Semanchuk, P., Todd, D., Steinberg, J., and Young, K. VeSPA: Integrated applications for RF pulse design, spectral simulation and MRS data analysis. Proc Intl Soc Mag Reson Med 2011: 1410.
9. Rothman DL, Behar KL, Prichard JW, Petroff OA. Homocarnosine and the measurement of neuronal pH in patients with epilepsy. Magn Reson Med 1997;38:924-929.
10. Fichtner ND, Henning A, Zoelch N, Boesch C, and Kreis R. Elucidation of the Downfield Spectrum of Human Brain at 7T Using Multiple Inversion Recovery Delays and Echo Times. Magn Reson Med 2016. DOI 10.1002/mrm.26343
Figures