5465
Estimating acetate extracellular fraction in the rat brain using diffusion-weighted MRS and modeling of tissue microstructure1Molecular Imaging Research Center (MIRCen), Commissariat à l'Energie Atomique, Fontenay-aux-Roses, France, 2Laboratory of Functional and Metabolic Imaging (LIFMET), Ecole Polytechnique Fédérale de Lausanne, Lausanne, Switzerland, 3Center for Biomedical Imaging (CIBM), Ecole Polytechnique Fédérale de Lausanne, Lausanne, Switzerland
Synopsis
While most brain metabolites detected by in vivo MRS are intracellular, some of them, in particular energy metabolism substrates such as glucose, lactate and acetate, are also known to be significantly present in the extracellular space. Although of high metabolic significance and of practical importance for metabolic flux quantification in labeling studies, the accurate determination of the extracellular fraction remains challenging. Here we propose to use diffusion-weighted MRS combined with modeling of tissue microstructure to estimate acetate’s extracellular fraction in the rat brain, which we find to be ~45%.
PURPOSE
While most brain metabolites detected by in vivo MRS are intracellular, some of them, in particular energy metabolism substrates such as glucose, lactate and acetate, are also known to be significantly present in the extracellular space. Although of high metabolic significance and of practical importance for labeling studies (e.g. 13C metabolic modeling), the accurate determination of the extracellular fraction (fextra) and intracellular fraction (fintra=1-fextra) remains challenging. Here we propose to use diffusion-weighted MRS combined with modeling of tissue microstructure to estimate fextra for acetate in the rat brain.METHODS
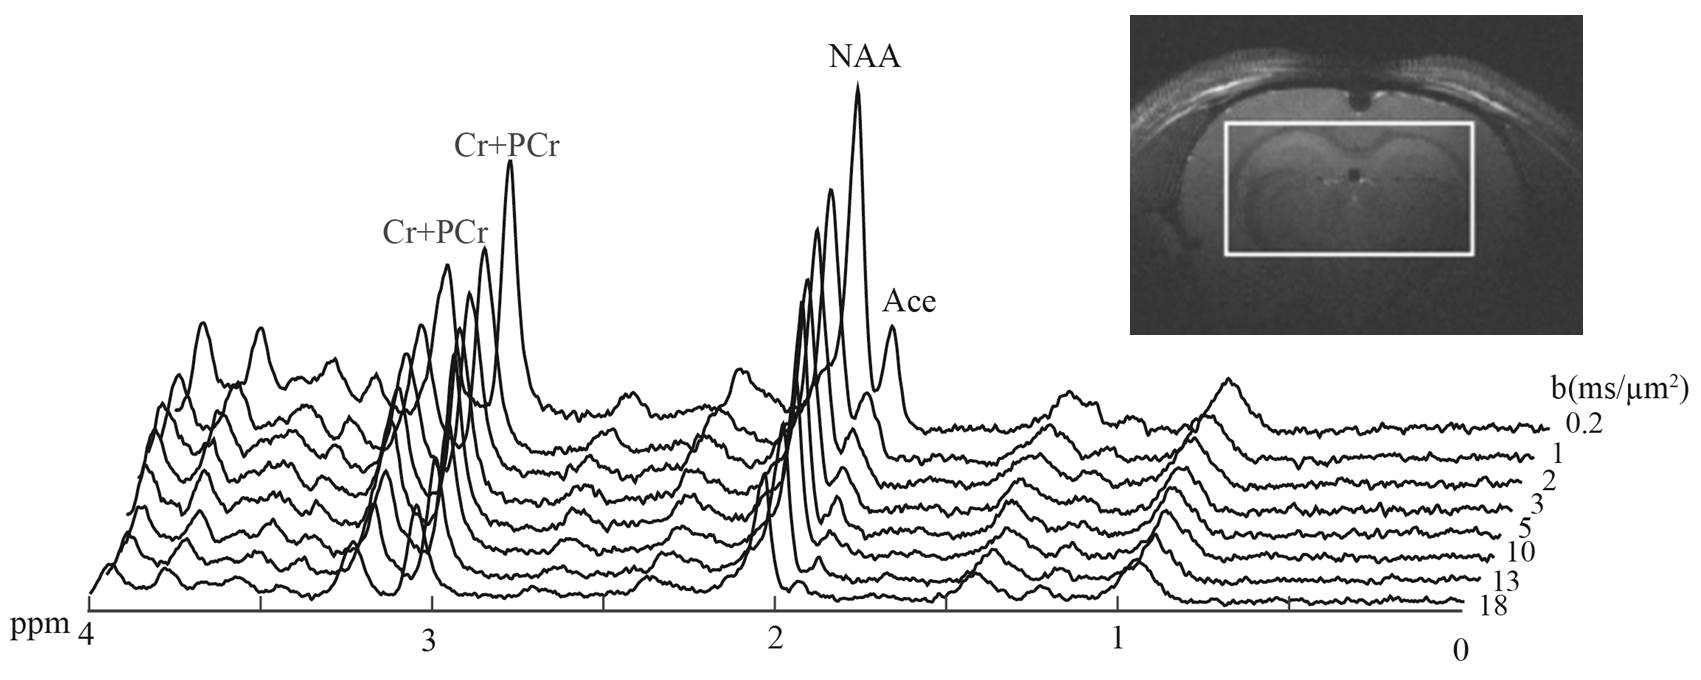
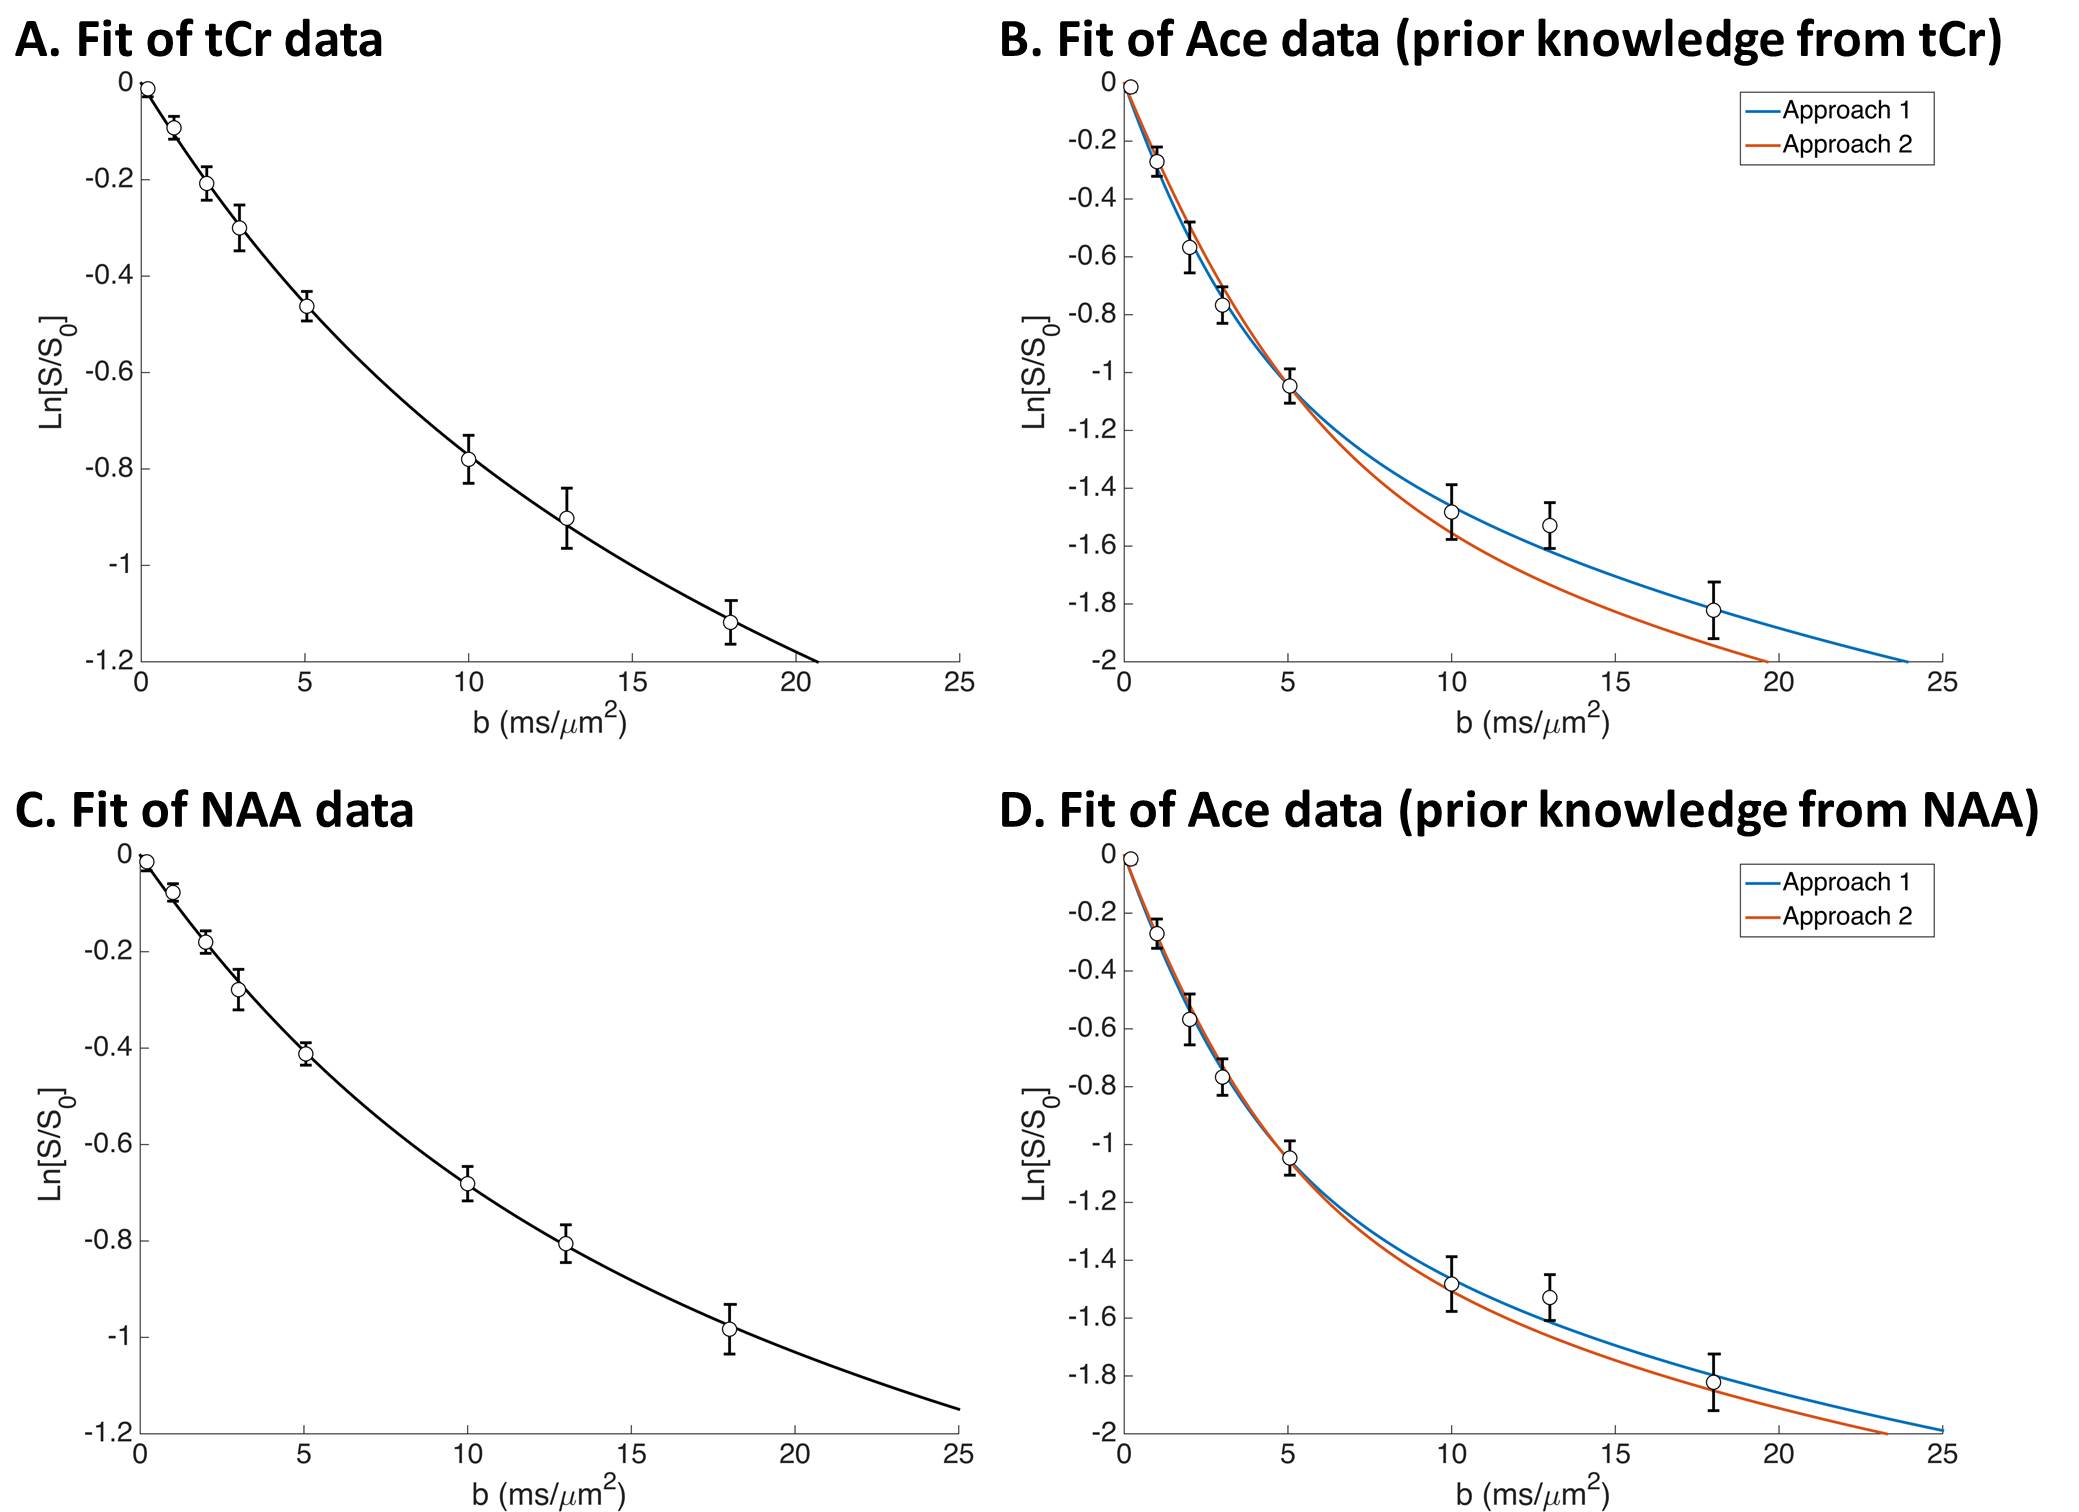
MRS: Experiments were performed on a 14.1 T Agilent scanner (400 mT/m gradients) with a home-built quadrature transceiver, using a diffusion-weighted STEAM sequence with TE/TM=50/49 ms optimized for acetate detection at 1.9 ppm (i.e. minimizing overlapping GABA), as described earlier1. Seven male Sprague–Dawley rats were anesthetized with α-chloralose, and intravenously infused with acetate to reach stable acetate concentration in plasma and brain. Spectra were then acquired for diffusion-weightings from b=0.2 to 18 ms/µm² (Fig. 1). After scan-to-scan frequency and phase correction, spectra were analyzed with LCModel. Signal could be reliably quantified (CRLB<5%) for NAA, total creatine tCr (Cr+PCr), and acetate (Ace).
Microstructure modeling: The intracellular space was modeled by a collection of isotropically oriented cylinders, corresponding to neuronal and glial processes2. Diffusion in the extracellular space was assumed to be Gaussian (monoexponential). Hence the total signal attenuation was modeled as:
S = fextra×exp(-b×Dextra) + (1-fextra)×Acyl(Dintra,d) [1]
Dextra and Dintra are the diffusivities in the extra and intracellular space (including some tortuosity), d is the cylinder diameter, and Acyl(Dintra,d) is the signal attenuation inside isotropically oriented cylinders obtained in the short gradient pulse approximation2-4. Signal attenuation of NAA or tCr, which are considered to be mainly intracellular, was used as reference for intracellular diffusion, i.e. was fitted using only Acyl to extract Dintra and d. The estimated value of d was then injected in Eq. 1 to model the intracellular signal of Ace, leaving only fextra, Dintra(Ace) and Dextra(Ace) as unknown parameters. To further stabilize the model, a fixed value for Dintra(Ace) was injected in Eq. 1 to compute Acyl, assuming Dintra(Ace)/Dintra(Ref)=Dfree(Ace)/Dfree(Ref), where Ref is the metabolite used as intracellular reference (NAA or tCr), and Dfree is the diffusion coefficient measured in a water phantom at 37°C (i.e. Ace and Ref are assumed to experience the same intracellular viscosity/tortuosity). Then, as no reference value exists for Dextra, two different approaches were used: 1) Dextra(Ace) was fitted as an unknown parameter and estimated together with fextra; 2) Dextra(Ace)=Dintra(Ace) was imposed. Errors on parameters were estimated by Monte Carlo.
RESULTS
Dfree(Ace)=1.27 µm²/ms, Dfree(tCr)=1.00 µm²/ms (for a 1:1 mix of Cr:PCr) and Dfree(NAA)=0.83 µm²/ms were measured in water at 37°C.
Fitting tCr data in vivo yielded Dintra=0.31±0.02 µm²/ms and d=2.55±0.37 µm (Fig. 2A). Using tCr as the intracellular reference then leads to Dintra(Ace)=0.40±0.03 µm²/ms, and from Ace diffusion attenuation we get Dextra(Ace)=0.54±0.03 µm²/ms and fextra=44±1% using approach 1; and fextra=51±1% using approach 2 (Fig. 2B).
To fit NAA in vivo, we need to add a small pool (2%) of non-diffusing NAA, as described elsewhere2, leading to Dintra=0.29±0.02 µm²/ms and d=1.67±0.24 µm (Fig. 2C). Using NAA as the intracellular reference then leads to Dintra(Ace)=0.46±0.05 µm²/ms, and from Ace diffusion attenuation we get Dextra(Ace)=0.55±0.04 µm²/ms and fextra=40±1% using approach 1; and fextra=44±1% using approach 2 (Fig. 2D).
DISCUSSION
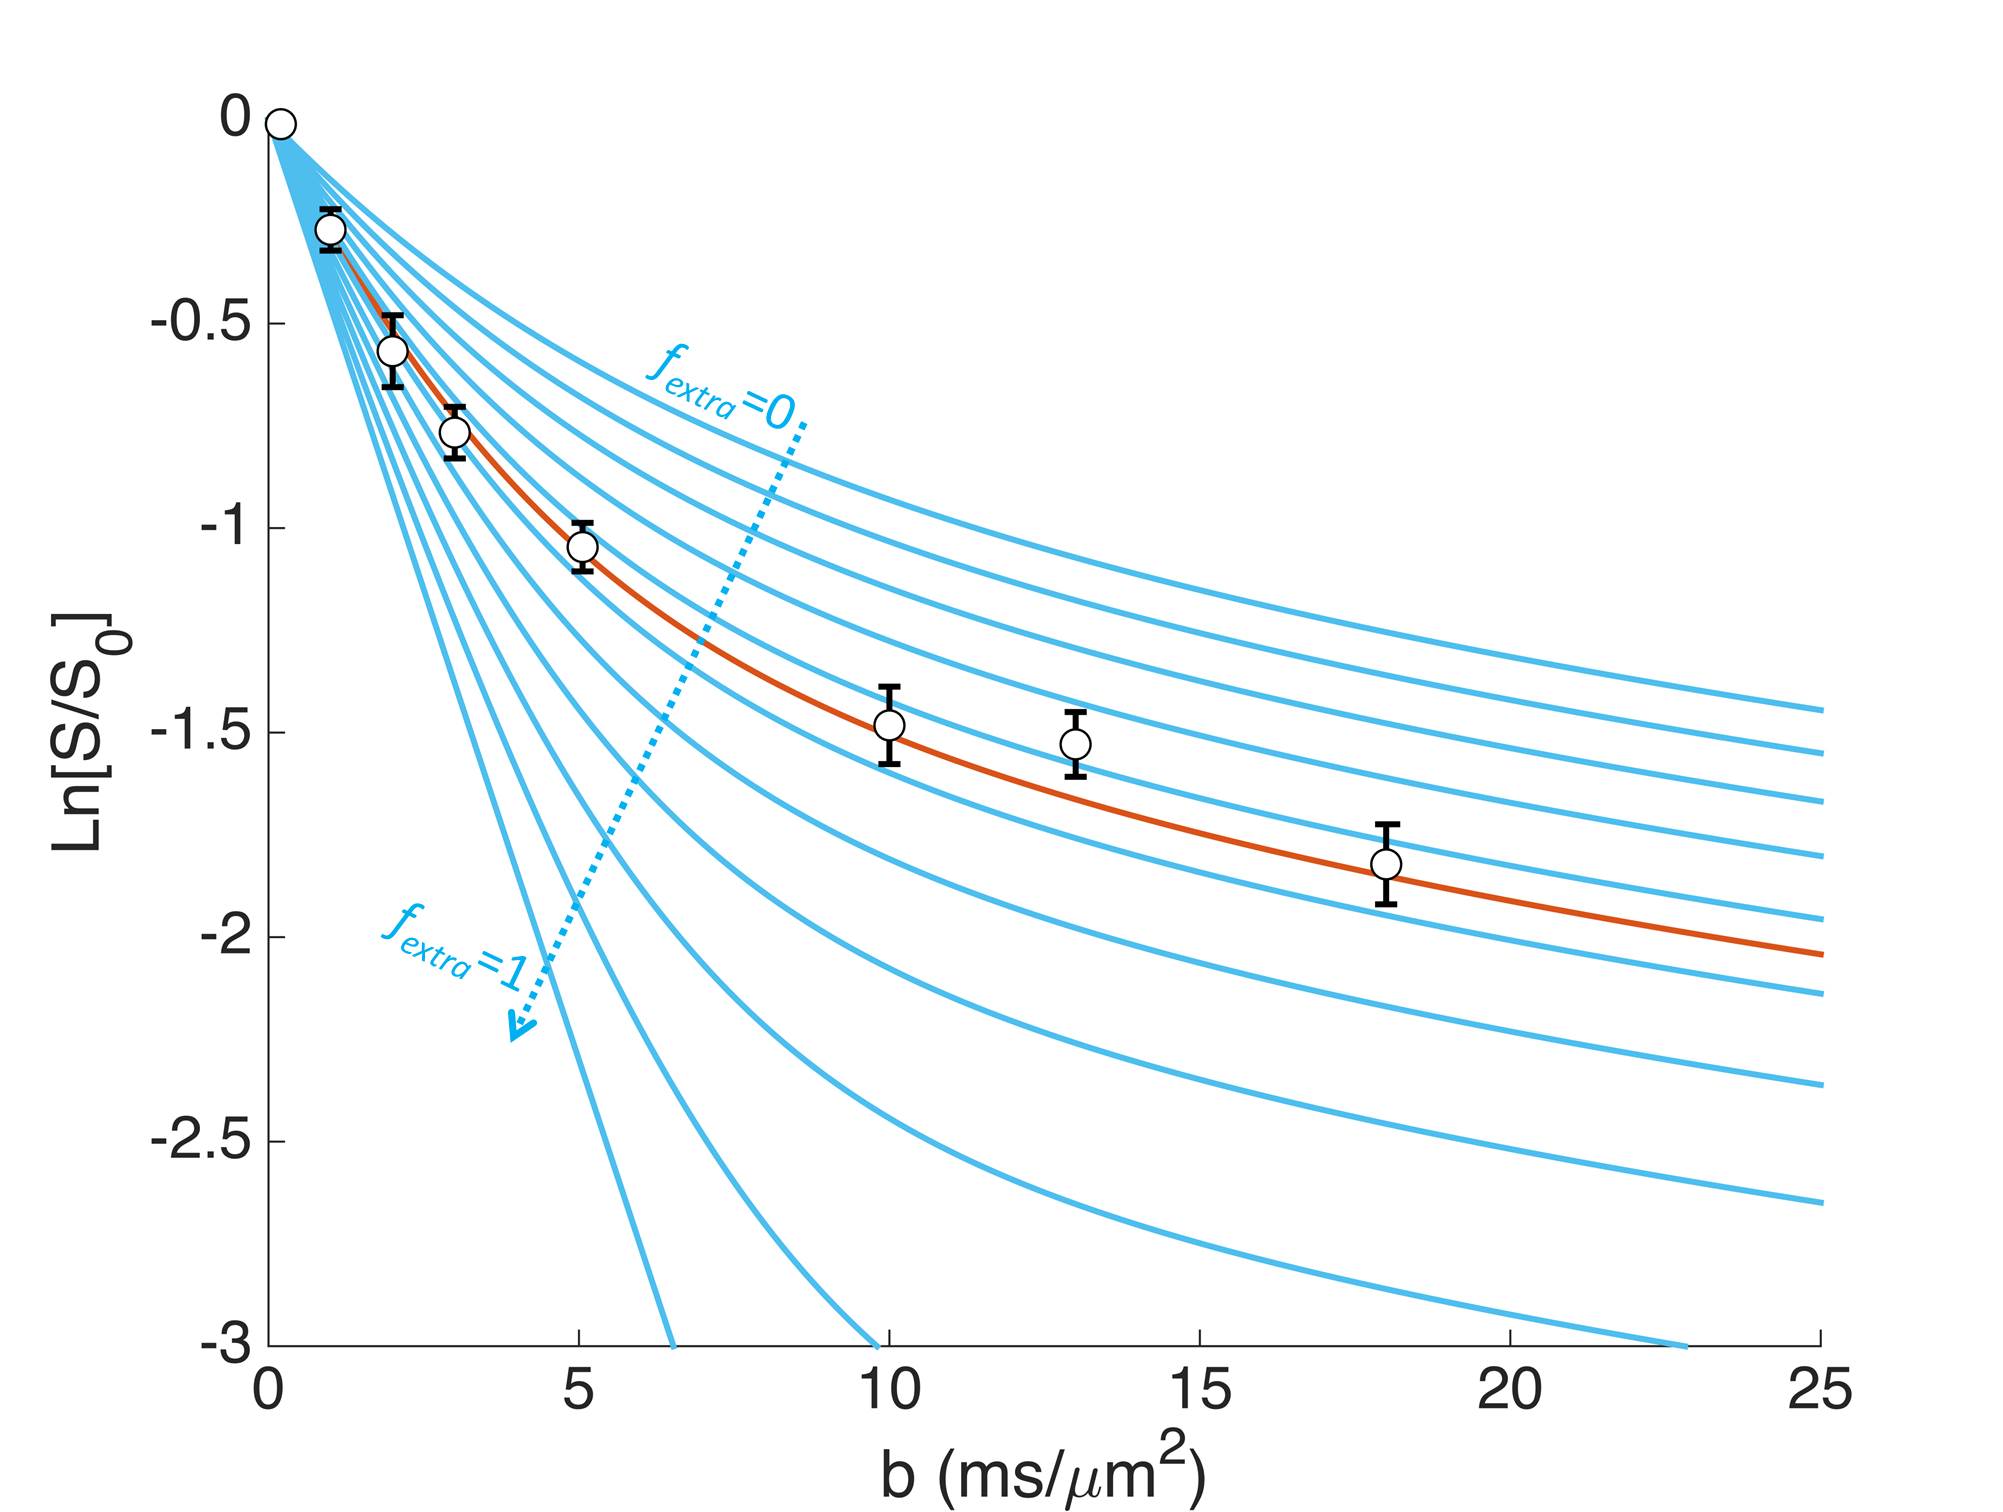
Eq. [1] strongly depends on fextra, as illustrated on Fig. 3, suggesting that the method can be highly sensitive to determine fextra. Depending on the assumptions used, fextra ranges from 40 to 50%, with an average 45%. Quite remarkably, this agrees well with the value which can be extracted from bi-exponential analysis1 (43%). In the bi-exponential approach, as introduced to determine glucose and lactate extracellular fractions5, the fast and slow diffusing fractions were estimated for intracellular metabolites, and the fast fraction in excess for acetate was attributed to the extracellular space. Although very simple, this approach remains phenomenological, unlike the present approach where a model of microstructure and a priori knowledge of free diffusivities are used. Hence the confidence in an estimated fextra of ~45% for acetate is strongly reinforced. Note that, when using approach 1, estimated Dextra is ~20-35% larger than Dintra, suggesting that the viscosity/tortuosity is lower in the extracellular space.CONCLUSION
The original method presented here allows estimating that, at steady-state during the infusion protocol, ~45% of the acetate is in the extracellular space, which will improve metabolic modeling in future acetate infusion studies. The method can also be adapted to other substrates.Acknowledgements
This work was supported by the CIBM group. MP and JV were supported by the European Research Council (grant #336331).References
1. Dehghani MM, Kunz N, Lanz B, Gruetter R. Multi-exponential characteristics of acetate diffusion-weighted MRS signal in the in vivo rat brain at 14.1T. Proceedings of ISMRM 2015, Toronto, Canada (#2789).
2. Palombo M, Ligneul C, Valette J. Modeling diffusion of intracellular metabolites in the mouse brain up to very high diffusion-weighting: diffusion in long fibers (almost) accounts for non-monoexponential attenuation. Magn Reson Med, in press.
3. Neuman CH. Spin-Echo of Spins Diffusing in a Bounded Medium. Journal of Chemical Physics 1974 ;60(11) : 4508-4511.
4. Linse P, Soderman O. The Validity of the Short-Gradient-Pulse Approximation in Nmr-Studies of Restricted Diffusion - Simulations of Molecules Diffusing between Planes, in Cylinders and Spheres. Journal of Magnetic Resonance Series A 1995;116(1):77-86.
5. Pfeuffer J, Tkac I, Gruetter R. Extracellular-intracellular distribution of glucose and lactate in the rat brain assessed noninvasively by diffusion-weighted 1H nuclear magnetic resonance spectroscopy in vivo. J Cereb Blood Flow Metab 2000;20(4): 736-746.
Figures