5459
B1+ maps in adults and children heads at 7.0T: selection of the generic human head model and maximum local SAR evaluation1Imago7, Pisa, Italy, 2IRCCS Stella Maris Foundation, Pisa, Italy, 3Dipartimento di Ingegneria dell'Informazione, Pisa, Italy, 4Dipartimento di Fisica, Pisa, Italy, 5General Electric ASL Scientist (EMEA), Pisa, Italy, 6Dipartimento di Ricerca Traslazionale e delle Nuove Tecnologie in Medicina e Chirurgia, Pisa, Italy, 7Meyer Children’s Hospital, Firenze, Italy
Synopsis
In this study we compare B1+ simulations performed on generic anatomic models with subject-specific measured B1+ maps, performed on both adults and children. We introduce a cost function, based on the normalized standard deviations (the ratio between standard deviation and average) of B1+ maps (magnitude), to guide the selection of generic human model to be used for subject-specific maximum local SAR evaluation. Maximum local SAR does not show a significant variation with subject weight and with subject cranial circumference. Limits on maximum SAR are always met for the sequence here considered (SILENT), in all adults and children.
Target audience.
RF Engineers, researchers and clinicians interested in UHF, and in particular in the application of UHF to the pediatric population.Purpose.
Subject-specific SAR measurements are not available in current MR systems; simulations must be performed for RF fields and SAR analysis. RF fields and SAR calculation rely on simulated data from generic human models, but such models cannot match precisely the anatomy of actual subjects. In 1, the authors propose to use an image registration technique to increase accuracy; however such registration can be computationally expensive. Here we compare B1+ simulations performed on generic anatomic models with subject-specific measured B1+ maps, performed on both adults and children. We introduce a cost function, based on the normalized standard deviations (the ratio between standard deviation and average) of B1+, to guide the selection of a generic human model to be used for subject-specific maximum local SAR evaluation.Methods.
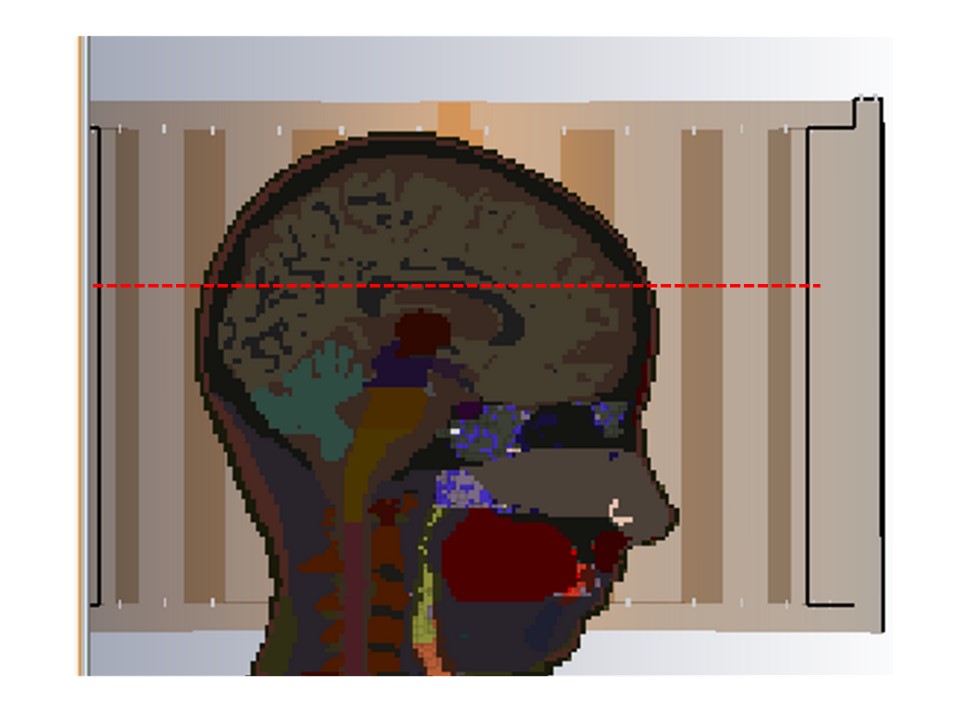
Electromagnetic simulations. We used the Finite Integration Technique (FIT) in the CST MW Suite. We simulated a 1H 298 MHz quadrature birdcage head coil (Nova Medical, Wilmington, MA, USA), loaded by human head models derived from the 2×2×2 mm3 voxel-size anatomic models Ella, Duke, Billie, Dizzy (Virtual population, ITIS foundation). B1+ was calculated in an axial slice crossing the corpus callosum (Fig. 1); the head maximum local SAR (10 g) of a “Zero” Time-of-Echo (ZTE) sequence (“SILENT”) 2 applied on the same slice was also determined.
Measurements. For 26 adults and 40 children: we collected age, weight and cranial circumference. We acquired B1+ maps (|B1,map+|) with a Bloch-Siegert sequence3 applied on the slice corresponding to that used in the simulations: parameters TR=33 ms, TE=15 ms, RBW=15.6 kHz, thk=3.5mm, matrix-size 64x64, square FOV 22 cm, 2 nex (acquisition time: 9 s). Measurements were acquired on a GE MR950 7T human system (GE HealthCare, Milwaukee,WI, USA) using the aforementioned coil with a 32-rx array (Nova Medical, Wilmington, MA, USA).
SAR evaluation. For each subject, a coefficient C was calculated as shown in 4 and used to scale the maximum local SAR simulated on the anatomic models; selection among the models was performed to minimize the cost function described below.
Statistical Analysis. For the generic human models and all the subjects, we calculated the average of |B1,map+| for a FA=90° sinc-pulse, and the normalized standard deviations (σ). Next, we introduced a cost function defined as the error between the normalized standard deviations of the model and of the subject, averaged over all the subjects:
cost = avg {|σsubject - σgeneric_model |}.
We calculated the cost function for the following two criteria: i) weight (each subject is paired with the model whose weight is nearest to subject’s weight); ii) cranial circumferences (each subject is paired with the model whose cranial circumference is nearest to the subject).
The lines of regression of the average of |B1,map+| and of the maximum local SAR with respect to the subject weight and cranial circumference were determined.
Results.
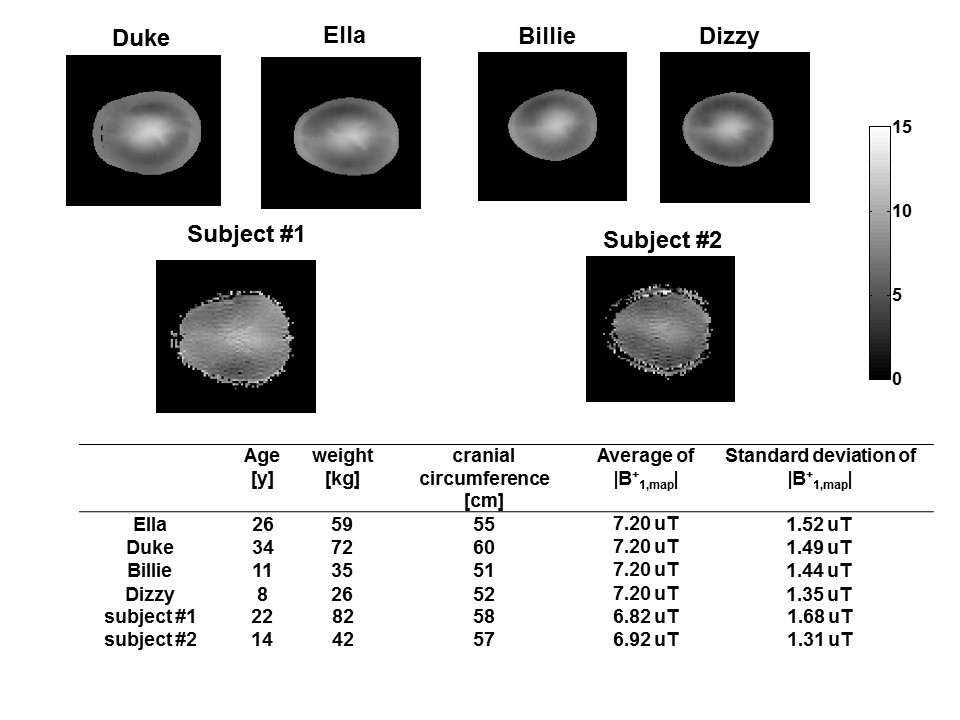
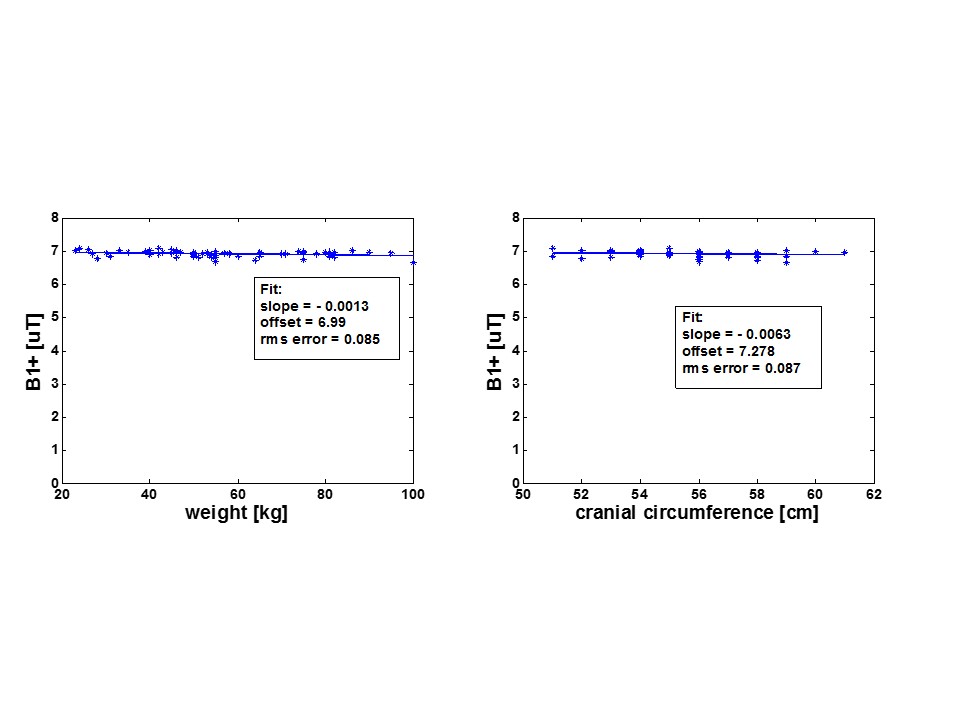
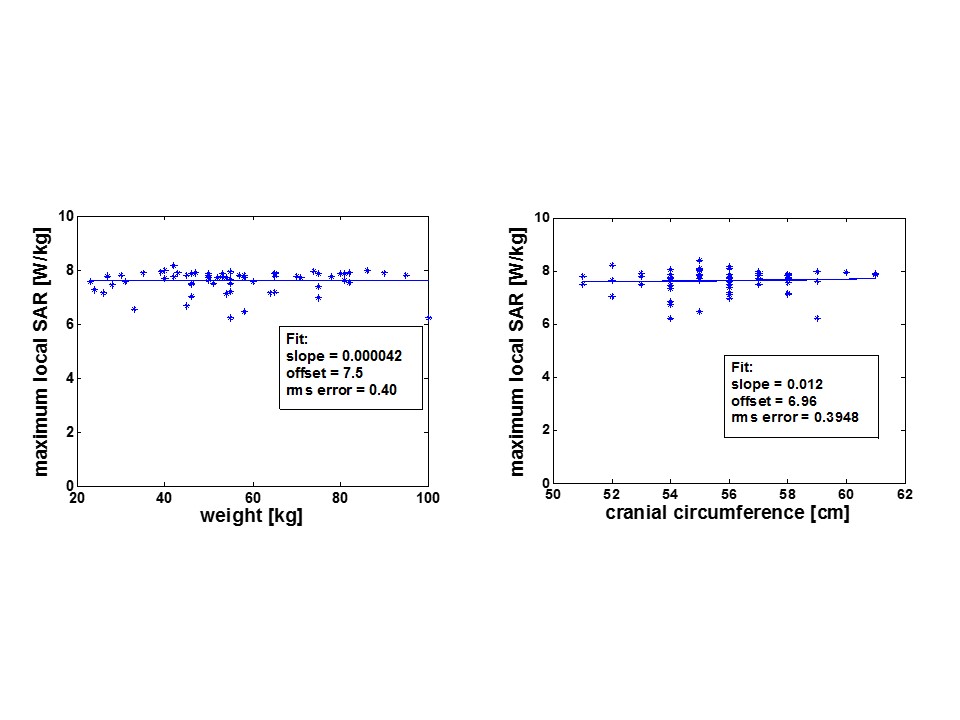
Fig 2 shows: the simulated B1+ magnitude for a FA=90° sinc-pulse, in Duke, Ella, Billie and Dizzy; the measured |B1,map+| for a FA=90° sinc-pulse for 2 representative subjects (one adult, one child). Weights, ages, cranial circumferences, average and standard deviation of B1+ magnitude are given in the insert. Concerning the average of B1+, the values which refer to the generic human heads models are equal to 7.2 μT, i.e. the nominal B1+ for the FA=90° sinc-pulse of 3.2 ms. The cost function is 0.07 if using a selection based on cranial circumferences, and 0.06 if using a selection based on weights. Fig 3 shows the average of |B1,map+| with respect to subject weight and to subject cranial circumference; the lines of regression are also given. Fig 4 shows the maximum local SAR with respect to subject weight and to subject cranial circumference; the lines of regression are also given.Discussions and Conclusion.
The selection of a generic human model to be used for subject-specific maximum local SAR evaluation can be performed using either a cranial circumference or a weight criterion; both of the criteria lead to an error (between the B1+ normalized standard deviations of the model and of the subject) lower than 0.07. Selection based on weight seems to be slightly more accurate. The average of |B1,map+| does not show a significant variation with subject weight and with subject cranial circumference. Maximum local SAR does not show a significant variation with subject weight and with subject cranial circumference; this is in accordance with 4. Limits on maximum SAR were always met, for the sequence here considered, in all adults and children.Acknowledgements
No acknowledgement found.References
1. Jin J, Liu F, Weber E, et al, Improving SAR estimations in MRI using subject-specific models, Physics in Medicine and Biology, vol. 57(24), pp. 8153–8171, 2012.
2. Costagli M, Symms MR, Angeli L, et al, Assessment of Silent T1-weighted head imaging at 7 Tesla, European Radiology 2016, 26 (6) pp 1879-1888.
3. Sacolick, LI, Wiesinger F, Hancu I, Vogel MW. B1 mapping by Bloch-Siegert shift, MRM 2010; 63: 1315–1322.
4. Tiberi G, Costagli M, Biagi L, et al, SAR prediction in Adults and Children by combining measured B1+ maps and simulations at 7.0T, JMRI 2016, 44(4), 1048–1055
Figures