5454
Predictive modelling for Sacral Nerve Stimulation Lead heating - Pathway factors and their effect on MRI RF-induced stimulation lead heating1Systems Engineering, Nuvectra Medical, Broomfield, CO, United States, 2R&D, Nuvectra Medical, Broomfield, CO, United States, 3R&D, Medical Technology Labs, La Mirada, CA, United States
Synopsis
A formula based methodology for predicting Sacral Nerve Stimulation lead temperatures when undergoing MRI exposures is presented. A generalized lead pathway model having 4 primary factors is used to represent the clinical placement. Twelve experimental configurations are selected based on variation of these generalized factors. Heating data measured in an MRI phantom is used to formulate an analytical model. Predictions from the model are compared against the actual data measured in MRI testing. The mean squared error for the model against the 12 test cases is 0.112 °C.
Purpose
Implantable devices intended for patients that undergo Magnetic Resonance Imaging (MRI) require demonstration of safety against excessive induced heating within an appropriate test phantom. The Radio Frequency (RF) field generated by an MRI is position dependent. Therefore, the location of test devices within the phantom greatly affects the amount of heat that will be measured. It is often necessary to apply modeling and simulation as a tool to down select to a set of representative (or, worst case) configurations. The objective, for the work described herein, is a generalized parametric model that can predict heating for a four conductor helical lead intended for use in Sacral Nerve Stimulation (SNS) therapy.Methods
The steps applied to develop an analytical model for SNS lead heating consisted of:
1. Generalize the lead’s pathway,
2. Select experimental configurations that illicit the sensitivity of each pathway factor to heating,
3. Measure heat rise for each configuration under MRI exposure within a phantom,
4. Calculate estimated heating for set of test pathway configurations,
5. Iteratively adjusting the analytical model in order to minimize the sum of the squared error
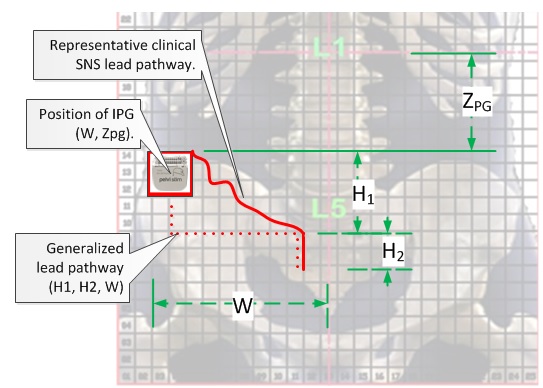
The SNS pathway was generalized by a tri-segment, right-angle model having four factors fully describing the pathway: Zpg, the vertical position of the IPG; W, the lateral span between IPG’s placement and spinal center-line; H1, the vertical extent of the proximal section of lead; and H2, the vertical length of distal segment running along or within spinal central axis. See Figure 1.
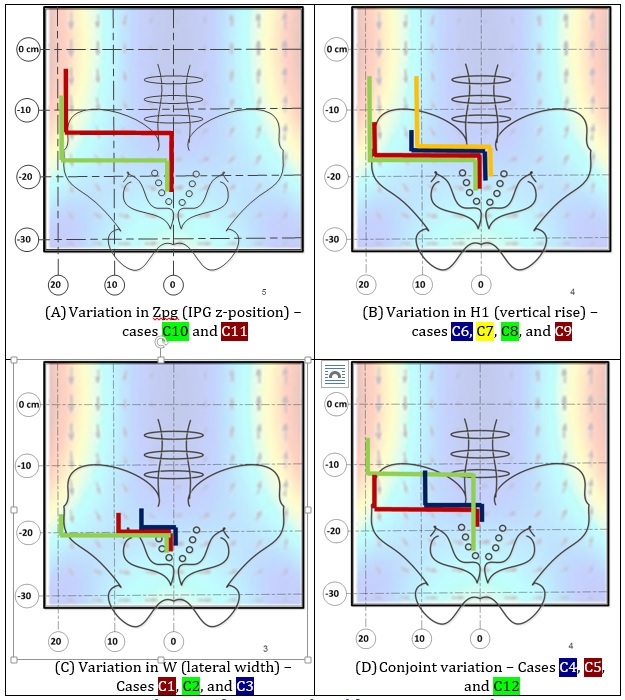
Each of the 4 major pathway factors were individually varied to illicit their relative sensitivity1 to lead heating. The values for each were constrained by anatomically and clinical relevance. See Figure 2.
In total, 12 selected experimental SNS lead pathways were placed into a Polyacrylic acid (PAA) gel phantom and exposed to 1.5 Tesla, 2.77 W/kg whole body average SAR for 10 minutes. The temperature at 4 different lead electrodes was measured as well as a reference for the gel using MRI-safe fiber optic thermometer.
Results
The non-uniformly distributed E-field concentrates near the edges with low magnitudes near the center of the MRI’s bore. Energy enters into conductive SNS leads by way of electromagnetic induction. The general principle for induction is provided by Faraday’s law. The effects of frequency resonance are ignored here for simplicity. Temperature, physically, is proportional to the square of the induced voltage.
The expected form of the analytical model is as shown:
$$T_{10} \propto (\int_{Zpg}^{Z_{PG}+H_{1}} E(x,z)\cdot dz)^2 \cdot A(H_{2}) $$
where
T10 is the 10-minute temperature rise,
E(x,z) is the E-field magnitude as a function of position (x,z)
A(H2) is the lead's power attenuation as a function of distal length, H2
The E-field magnitude, based on the analysis of the experimental sensitivity data, had an approximate form of:
$$E=a_{o}\cdot SAR\cdot W^\frac{3}{2} \cdot (1\pm \frac{z}{Z_{M}}) $$
where
ao is a coefficient of proportionality accounting for density, conductivity of medium, and units conversion
A simple ramp model for the E-field magnitude with respect to vertical position, z, was assumed. The final form is found in the Discussion Section.
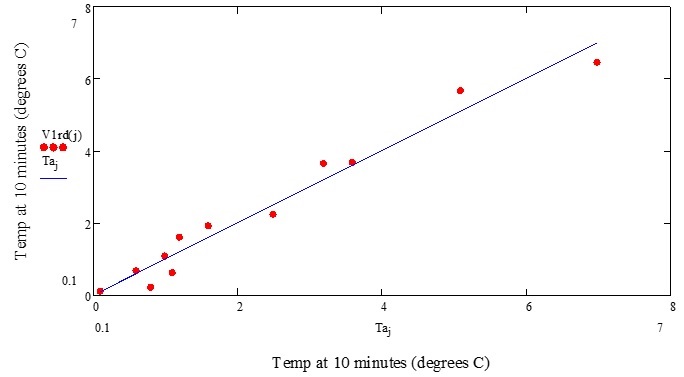
Two parameters were iteratively tuned in order to minimize the mean squared error – ao and ZM (the half-height span of the high E-field region of the MRI phantom in the lateral extreme). For the model obtained, the standard error between the actual and predicted temperature for the 12 configurations is 0.113 °C with a maximum error for all configurations of 0.58 °C. See Figure 3.
Discussion
The SNS lead serves both as an antenna for induction of the MRI’s RF electric field and as a transmission line that conducts the energy to the dissipative load (either the body tissue or gel phantom). The lead attenuates RF energy in a manner consistent with transmission line to a general load power transfer.2
The voltage induced into the lead results in the flow of an RF alternating current. The amount of heat is also dependent on the impedance, thermal capacity, density, and thermal conductivity of the gel/tissue (captured in a single coefficient, a0. The RF input power level (which is measured in SAR) is the another primary factor. The combination of factors is summarized analytically in the formula below:
$$T_{10}=a_{10}\cdot SAR \cdot W^{\frac{3}{2}} \cdot H_{1} \cdot (1+\frac{Z_{PG}}{Z_{M}}-\frac{H_{1}}{2\cdot Z_{M}}) \cdot (\frac{R_B^2}{R_B^2 + (2\pi f \gamma_{L} H_{2})^2})$$
Conclusion
The model is was suited to the purpose of determining representative worst-case configurations in which to focus testing within an MRI. The standard error between the actual/predicted temperatures for the 12 configurations evaluated was found to be 0.113 °C. The maximum error for all configurations was 0.58 °C. Relative error is not a good measure of accuracy when the temperature rises are small. If the underlying purpose is to assess safety against excessive heating, relative predictive accuracy for small values is irrelevant. Relative error for the model becomes important as the predicted temperatures approach safety limits (generally agreed to be on the order of 6 °C). In this respect, the accuracy for the SNS model developed herein for all predicted temperature rises above > 2 °C is 15%.
Acknowledgements
No acknowledgement found.References
1. Mattei, Eugenio et al. “Complexity of MRI Induced Heating on Metallic Leads: Experimental Measurements of 374 Configurations.” BioMedical Engineering OnLine 7 (2008): 11. PMC. Web. 7 Nov. 2016.
2. Kalpin, Scott; Kaula, Norbert; Shehada, Ramez. "Attenuation of RF-induced currents within neuro-stimulation leads using a helical conductor design", Proc. Intl. Soc. Mag. Reson. Med. 24 (2016), pending.
Figures