5448
Sensitivity of the transfer function on the dielectric properties of the surrounding media: a case study1MR:comp GmbH, Gelsenkirchen, Germany, 2Max Planck Institute for Human Cognitive and Brain Sciences, Leipzig, Germany, 3Division of Biomedical Physics, U.S. FDA, CDRH, Office of Science and Engineering Laboratories, Silver Spring, MD, United States
Synopsis
In this case study we show the dependence of the lead transfer function and the RF-induced power deposition (P) on the presence of heterogeneous tissues around of the lead tip. Depending on the lead length, our results shows a dramatic non-linear dependence of P on a small volume of a different tissue surrounding the lead tip, i.e., a fatty pocket, when using a TF derived in a homogeneous media. Thus, using TFs derived in a homogeneous media can result in large systematic errors in predicting P, and consequently the lead tip heating, of AIMDs inside a human body.
Introduction
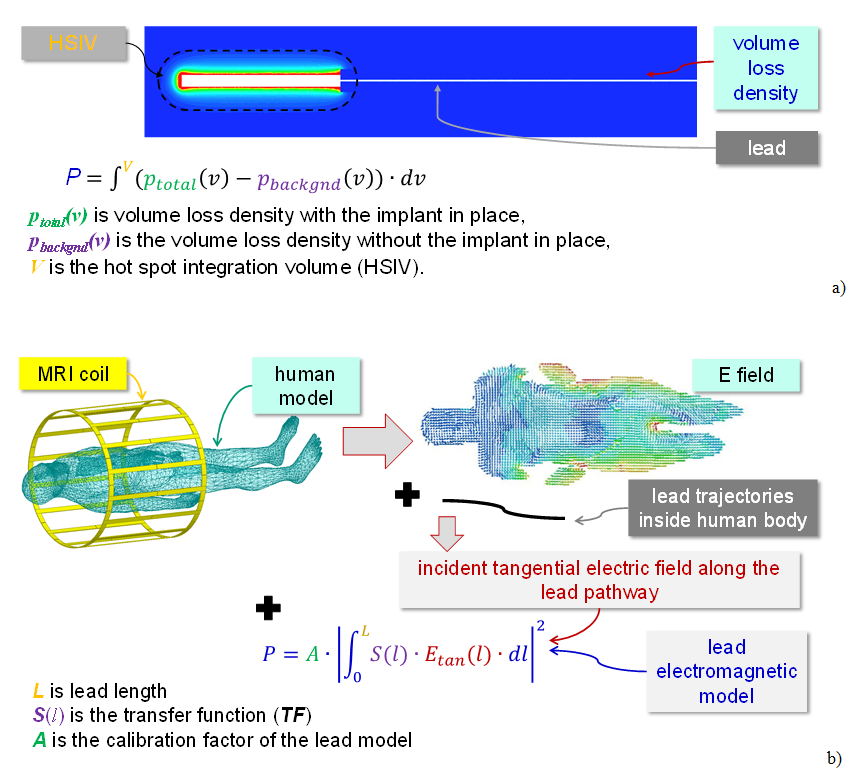
Due to the complexity of assessing in-vivo RF-induced heating for active implantable medical devices (AIMDs) leads, computational modeling has been widely applied using the transfer function (TF) method1 (Fig. 1a&b). The TF relates the incident tangential electric field (Etan) along the AIMD lead trajectory to the RF-induced power deposition (P), typically in a small volume around the lead tip. The generation and validation of the TF model of an AIMD lead is typically performed in a phantom filled with homogeneous conductive medium. However, an AIMD lead inside a human body is in contact with several tissues, with varying electrical and thermal properties. In this case study we show the dependence of the TF and P on the presence of heterogeneous tissues around the lead tip, modeled as a small fatty pocket.Methods
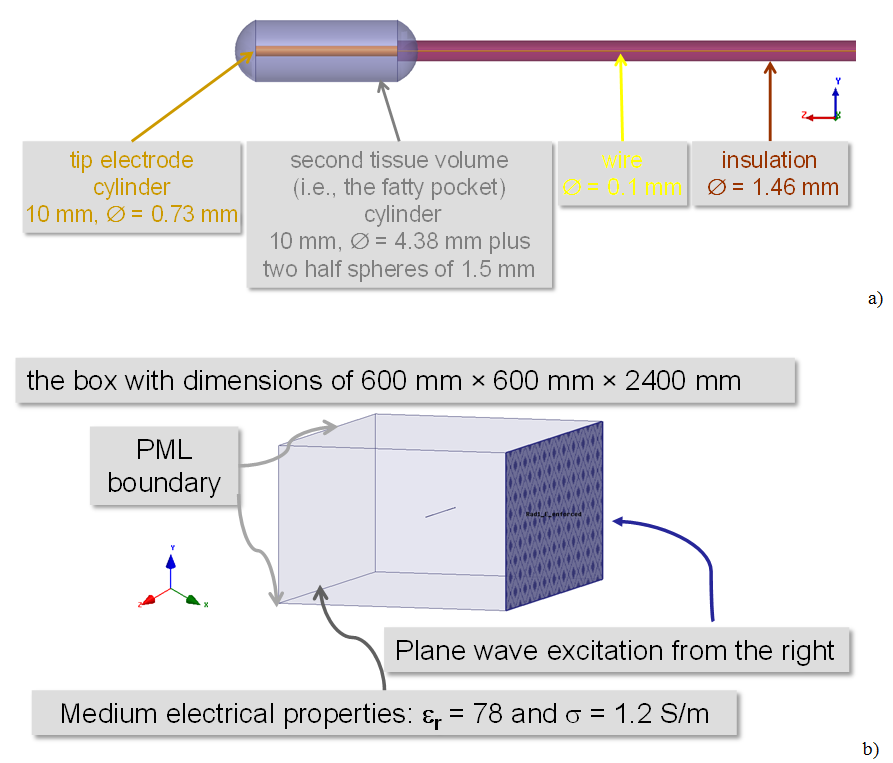
Our test leads were straight insulated titanium allow wires (0.1 mm wire diameter, conductivity (σ) of 595 kS/m, and 1.46 mm insulation diameter). The relative permittivity (εr) of the insulation material was 2.7 with σ=24 mS/m. The lead length (L) was varied from 40 mm to 800 mm in 10 mm steps. The wire was capped at one end, and at the other end a 10 mm long tip electrode with a diameter of 0.73 mm was placed (Fig. 2a). The leads were positioned in the middle of a box (Fig. 2b) with dimensions of 600×600×2400 mm3, filled with a medium with electrical properties similar to blood: εr=78 and σ=1.2 S/m. In a second setup, i.e., the ‘two tissues setup’, the 10 mm long tip electrode was surrounded by a volume of 4.38 mm in diameter and a length of 13mm (Fig. 2.a) filled with a medium with electrical properties of fat : εr=11.5 and σ=0.0045 S/m (the ‘fatty pocket’). The box was exposed to an ideal 127.7 MHz plane-wave source incident on one side, with the other sides of the box defined as perfectly matched layers. To acquire Etan(l) along the lead trajectory, one full wave 3D electromagnetics (EM) simulation using HFSS(ANSYS, Canonsburg, PA, USA) was performed without the lead in place. The TF for each lead length was calculated using the reciprocity approach described in2. P was calculated by integrating the dissipated power density around the lead tip, i.e., the hot spot integration volume equal to a cylinder 4.38 mm in diameter with a length of 13mmResults and Discussion
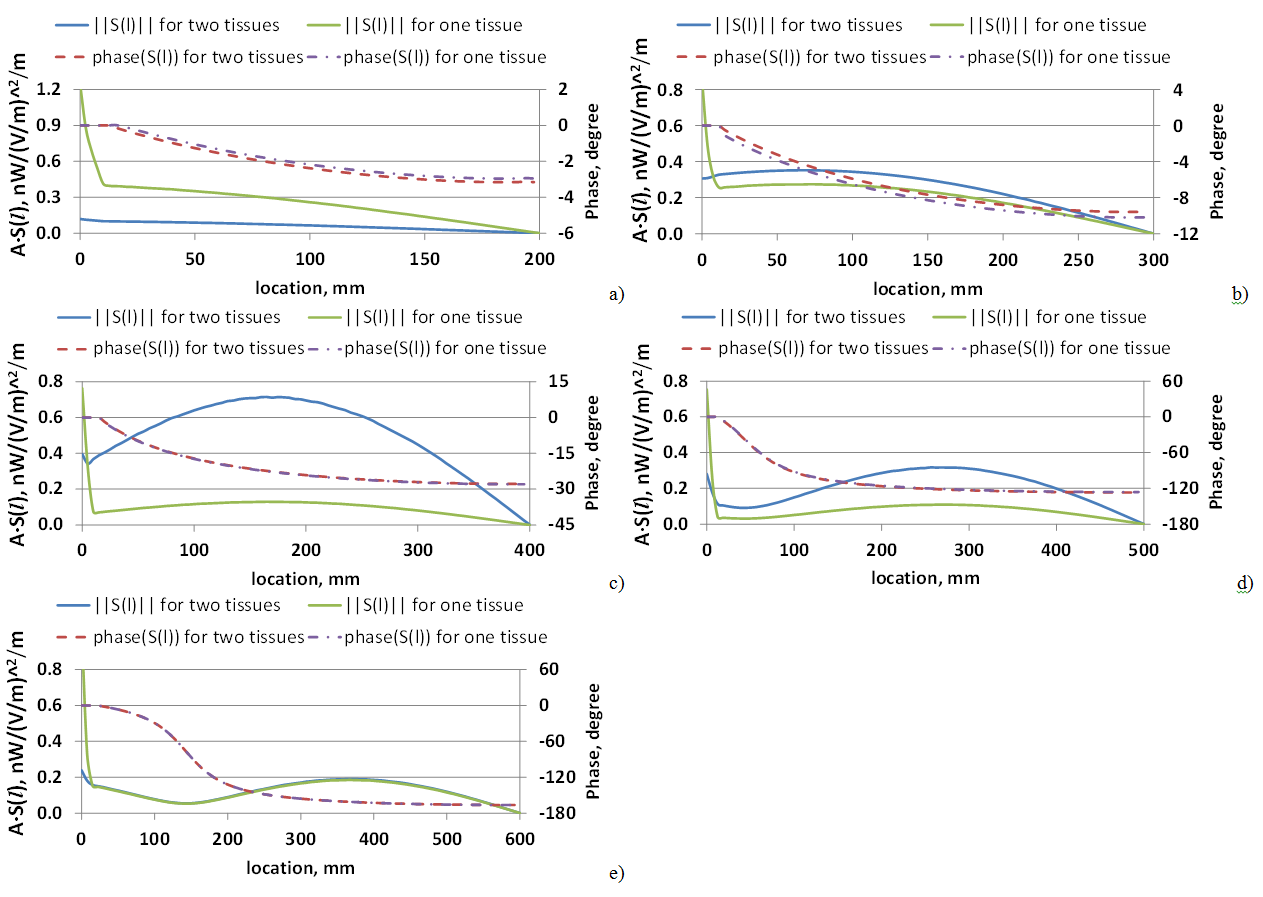
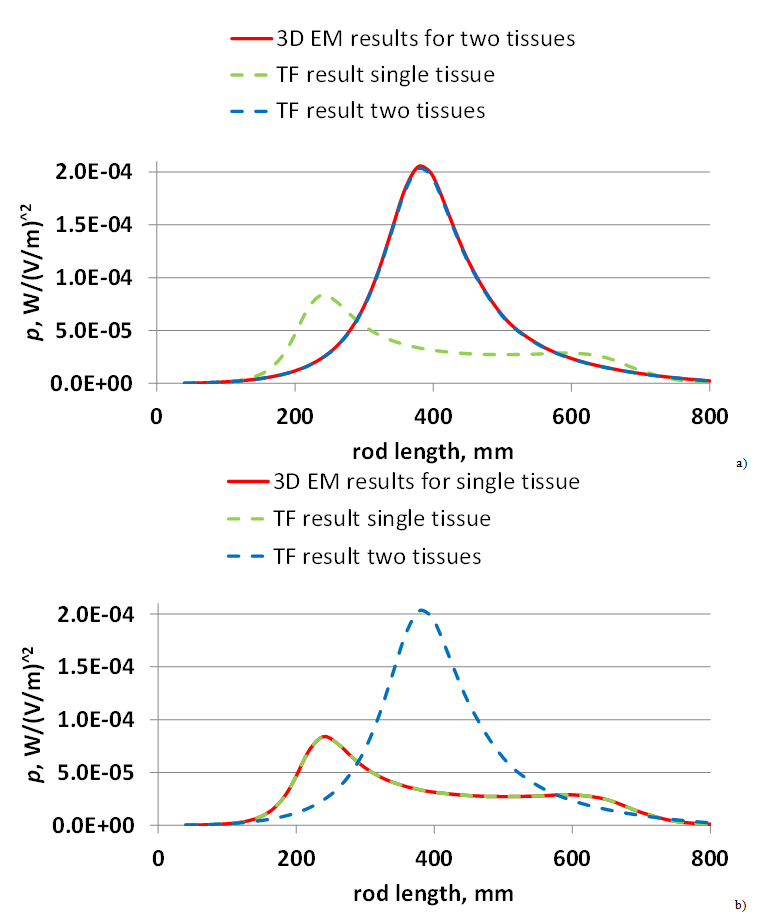
Depending on the lead length, the presence of the fatty pocket around the lead tip, despite its small size, visibly influences the TFs (Fig. 3a-e), particularly in magnitude, and, consequently, the power depositions (Figure 4). The largest impact was for lead lengths around 1.5 times the wavelength. Calculating P using the TF derived from the same setup, i.e., P for the single tissue setup calculated with the TF derived from the single tissue setup, or P for the two tissues setup calculated with the TF derived from the two tissues setup, was in total agreement with the direct 3D EM simulations (Fig. 4). This indicates that the TF method accurately predicts P, if the TF is correctly derived. However, using a TF derived in a homogeneous media, but used in an inhomogeneous scenario (the two tissues setup with the fatty pocket) can lead to high errors for P (e.g., up to five-fold shown herein). Additional errors may occur due to the presence of tissues with different thermal properties, which needs to be evaluated in future studies.Conclusion
Depending on the lead length, our results show a non-linear dependence of P on a small volume of a different tissue surrounding the lead tip when using a TF derived in a homogeneous media. Thus, using TFs derived in a homogeneous media can result in large systematic errors in predicting P of AIMDs inside a human body. The variation of the power deposition due to the presence of the fatty pocket cannot be readily generalized to the wider range of lead geometries and tissue dielectric properties, because we investigated only a single lead geometry, and only one set of tissue dielectric properties in one particular geometry. Future work to investigate the dependence of P, and the associated RF-induced heating, in a multi-tissue setup will include other lead geometries, anatomical computer models, different frequencies, and additional dielectric properties of human tissuesDisclaimer
The mention of commercial products, their sources, or their use in connection with material reported herein is not to be construed as either an actual or suggested endorsement of such products by the Department of Health and Human Services.Acknowledgements
No acknowledgement found.References
1. Technical specification ISO/TS 10974, “Assessment of the safety of magnetic resonance imaging for patients with an active implantable medical device”, 1st edition 2012.
2. Feng S, Qiang R, Kainz W, and Chen J, “A technique to evaluate MRI-Induced electric fields at the ends of practical implanted lead,” IEEE Transactions on Microwave Theory and Techniques, 2015, 63(1): 305-313.
Figures