5446
Potential for Estimation of Perfusion from MR Thermometry – A Simulation Study1Radiology, Center for Advanced Imaging Innovation and Research (CAI2R), New York University, New York, NY, United States, 2Radiology, Bernard and Irene Schwartz Center for Biomedical Imaging, New York University, New York, NY, United States
Synopsis
Among the several parameters that affect temperature computation, blood perfusion is one of the most relevant. According to some studies, perfusion may change significantly with local temperature changes: therefore, it is relevant to characterize both the baseline value of perfusion and its dependence on local temperature for a correct temperature estimation with numerical simulations. In this work, we compare the efficiency and the robustness to noise levels of three different methods to estimate blood perfusion based on the analysis of temperature images which can be acquired, for example, with MR thermometry sequences.
Purpose
To evaluate the potential efficacy of different methods to estimate temperature-dependent perfusion values from temperature maps through time.Introduction
Temperature is an important parameter in ensuring safety of the RF coils used in MRI systems, and is commonly estimated with numerical simulations. Temperature computations can consider the effect of material properties (heat capacity, thermal conductivity, …) and physiological mechanisms (perfusion, sweating, respiration, …). A correct estimation of all these parameters is important to accurately estimate temperature. Blood perfusion significantly affects temperature distribution, and is also strongly affected by local temperature changes. For example, with a local skin temperature of 42 $$$\circ$$$C, perfusion can increase up to 32 times the baseline value1. Hence, it is relevant to characterize both the baseline value of perfusion in each tissue and its dependence on local temperature.
With specialized MRI sequences it is possible to estimate both temperature and perfusion. While existing methods to map temperature change can operate rapidly and with high resolution, methods to map perfusion are difficult to quantify and generally only work well in tissues with a relative high baseline perfusion rate.
In this work, we propose the estimation of the temperature dependence of blood perfusion through the analysis of temperature, and evaluate three different approaches in simulation. Ideally, the proposed methods can be extended to characterize perfusion using only in vivo temperature measurements through time and space, for example, with MR Thermometry sequences.
Methods
Temperature simulations were performed with a Finite Difference (FD) implementation of the Pennes' bioheat equation
$$\rho{c}\frac{\partial{T}}{\partial{t}}=\nabla\cdot(k\nabla{T})-W\rho_{bl}c_{bl}(T-T_{bl})+Q+\rho{SAR}\;\;(1)$$
where T, SAR, W, k, r, c, Q represent respectively temperature, specific absorption rate, blood perfusion rate, thermal conductivity, tissue mass density, tissue heat capacity, rate of metabolism; the subscript bl denotes values for blood.
The SAR distribution resulting from a body-size birdcage coil with an operating frequency of 128 MHz and loaded with a human subject with one arm near one of the conductive elements was simulated. Starting from the equilibrium temperature T0, the temperature distribution Ta was computed after a 2 minute application of the RF power. Then, temperature distributions Tb and Tc were computed after a subsequent 5 second and 30 second period with no SAR. During the simulation, blood perfusion was allowed to vary as2
$$W(r)=\begin{cases}W_{0}(r)&T(r)\leq39^{\,\circ}C\\W_{0}(r)(1+S_{B}(T(r)-39))&39^{\,\circ}C<T(r)<44^{\,\circ}C\\W_{0}(r)(1+5S_{B})&T(r)\geq44^{\,\circ}C\end{cases}\;\;(2)$$
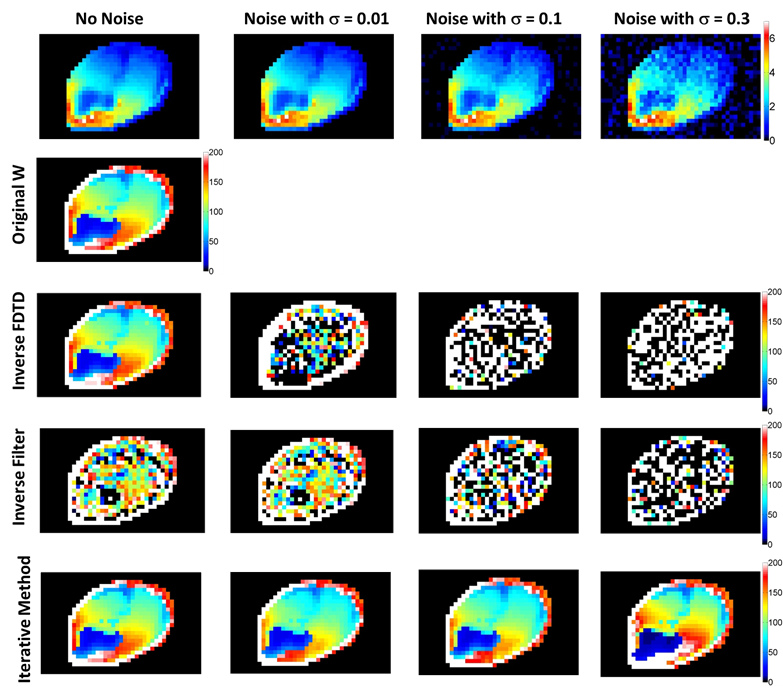
To temperature distributions Ta, Tb, and Tc, different levels of Gaussian noise were added.
Three different methods were used to estimate perfusion rates from the temperature maps:
1) Temperature distributions Ta and Tb were used to perform an inversion of the FD solution of eq. (1) considering perfusion W the unknown variable for each voxel: 5 seconds is a time interval small enough to be used as a time step of the FD temperature simulation with cells having size 5mm x 5mm x 5mm.
2)
Temperature distributions Ta and Tc were used to
estimate perfusion with the help of an inverse filter3 which can neglect the
effect of the thermal conduction over a time interval at least 30 seconds long.
Hence, applying the inverse filter to Tc it is possible to compute Tc~, which
corresponds to the temperature obtained supposing that thermal conduction is
negligible. Therefore, the temperature decay from Ta to Tc~ is only due to
perfusion, and it can be estimated using the two temperature maps.
3) Temperature distributions Ta and Tc were used to estimate blood perfusion with an iterative parameter optimization in a forward simulation of temperature in the forearm of the numerical model using Eq.(1): blood perfusion in muscles has been defined as $$$𝑊_{𝑚}=𝑎_{𝑚}+𝑏_{𝑚}{𝑇}$$$ and blood perfusion in bones as $$$𝑊_{𝑏}=𝑎_{𝑏}+𝑏_{𝑏}{𝑇}$$$. The parameters $$$𝑎_{𝑚},\,b_{𝑚},\,𝑎_{𝑏},\,𝑏_{𝑏}$$$ were estimated with an iterative procedure where the difference between the predicted temperature Tc’ and the original temperature distribution Tc is minimized.
Results
As reported in Fig.(1), the estimation of blood perfusion by inverting the FD method is significantly affected even by a small amount of noise, while the inverted filter method, though less affected by small noise levels, does not provide very accurate results even when no noise is applied due to the approximations of thermal conduction. On the contrary, estimation performed with the iterative method offers quite robust results, and a slight variation of the optimal perfusion distribution is obtained only for a significant amount of noise added to the temperature distributions. Noise levels lower than this worst case simulated are expected in experimentally acquired MR Thermometry sequences: hence, the iterative method may be able to provide consistent blood perfusion maps also for in vivo maps of temperature change using a subject-specific simulated baseline state to get absolute temperature.Acknowledgements
No acknowledgement found.References
1. Laakso I et al., Phys. Med. Biol. 2011;56: 7449-7471.
2. Bernardi P et al., IEEE TBME. 2003;50(3): 295-304.
3. Carluccio G et al., ISMRM Annual Meeting. 2014, p. 4904.
Figures