5445
Analysis of MRI gradient induced voltage on Deep Brain Stimulator lead using high resolution anatomical models1St Jude Medical, Sylmar, CA, United States
Synopsis
When a patient with implantable device such as deep brain stimulator undergoes MR scan, the exposure to gradient fields can induce strong voltage across the lead and cause unintended stimulation to the patient or damage the device. In this study, three tiers of voltage determination approach recommended by ISO/TS 10974 ED2 were executed. The analysis results indicate that the tier 3 approach which utilizes realistic gradient coil designs, anatomical models and numerical simulations may arrive at predicted voltage value five times lower than tier 1 approach because of the avoidance of over-conservative assumptions.
Purpose
When a patient with an implantable device such as deep brain stimulator (DBS) undergoes MR scan, the gradient magnetic field (B-field) may induce voltage along the lead and cause unintended brain stimulation or device malfunction/damage. In order to demonstrate MR safety, the determination of gradient induced voltage is mandatory.Methods
ISO/TS 10974 ED21 recommends a three tier approach to determine gradient induced voltage for a given dB/dt MR exposure level: (a) Tier 1 assumes that the gradient-induced electric field (E-field) is tangential to the lead. A maximum lead loop area is determined from a given lead length and the area is multiplied by the dB/dt level to arrive at the induced voltage. This tier will produce the most conservative voltage. (b) Tier 2 utilizes lead loop area by anthropometric analysis for voltage prediction; Tier 2 is less conservative than Tier 1. (c) Tier 3 employs gradient coil modeling, anatomical models and clinical relevant lead pathways to numerically determine the induced voltage; Tier 3 is intended to be the most accurate and least conservative method.
ISO/TS 10974 ED2 gradient induced voltage Tier 3 approach is summarized below:
1) Select low frequency electromagnetic simulation tool to model B-field produced by MR gradient coils and the resulting E-fields in the human body.
2) Select a MR gradient coil model representative of clinical MR scanners for model validation.
3) Validate the simulation tool and gradient coil design.
4) Select human body models with proper conductivity tissue properties.
5) Define implant site and lead trajectories for the selected body models.
6) Simulate the gradient induced E-field in the body models for various coil designs, excitations and landmark locations.
7) Compute the lead voltage as the integral of the tangential E-fields along lead trajectory.
In this study, all three Tiers for gradient induced voltage recommended by ISO/TS 10974 ED2 are investigated. The step-by-step Tier 3 execution is summarized below:
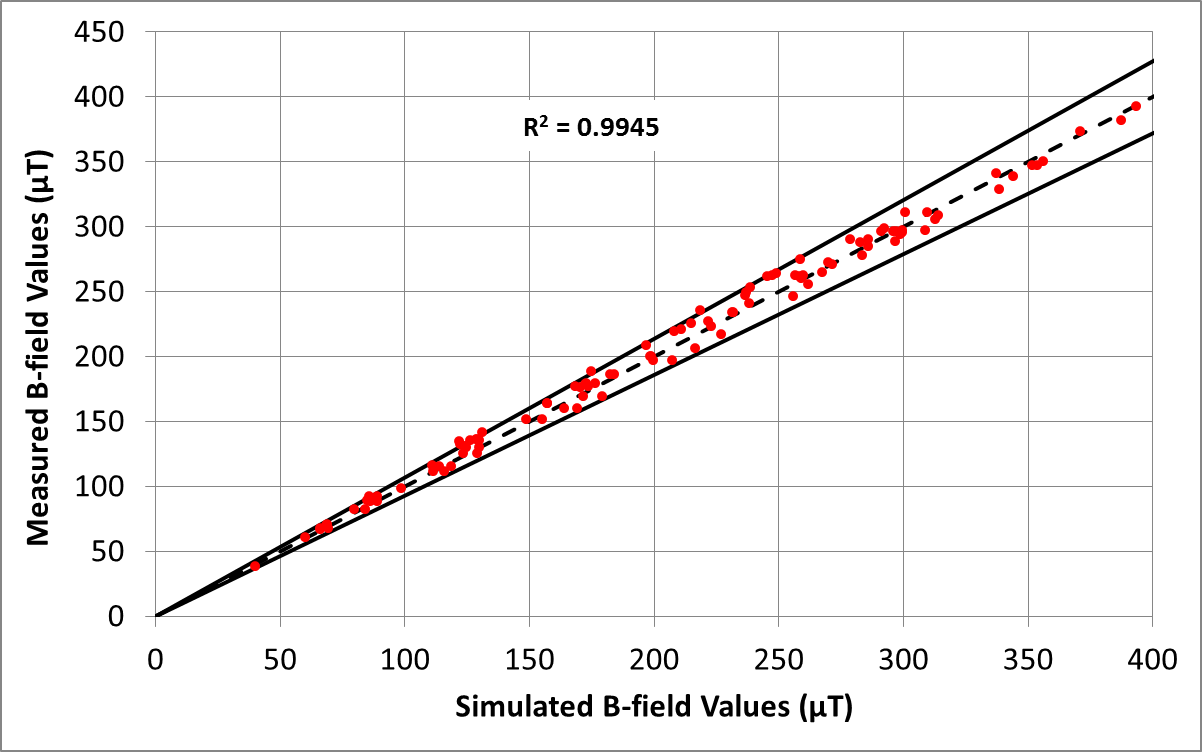
1) SEMCAD-X2 was selected as the simulation tool. The validations of SEMCAD-X’s magneto- and electro- quasi-static solvers have been previously reported3. Further validation was performed in this study by comparing SEMCAD-X numerical solution to analytical solution (cylindrical phantom exposed to uniform B-field), a maximum deviation in calculated voltage was 0.5%.
2) The gradient coils of a commercial Hitachi Echelon 1.5T scanner were modeled in SEMCAD-X, the numerically calculated and experimentally measured gradient B-fields were compared and good agreement was observed (see Figure 1)
3) Five gradient coil designs (bore diameters of 60, 70 cm and coil length from 127 to 203 cm) covering commercial MR scanner dimensions were employed. The dB/dt levels (vector sum) calculated using these coil designs are within 4% deviation from the values reported in ISO/TS 10974 ED2 Annex A, Table A.2.
4) Five human body models from the Virtual Population4, namely Duke, Ella, Fats, Billie and Thelonious, with published low frequency conductivity values5 were employed.
5) The body models were positioned in the gradient coils with the eye level points aligned with the ISO centers of the coils. The gradient coils were shifted with a 10 cm step size along the Z-axis such that the field of view is moved from the 10 cm superior-to-eyes level point to the knee region to cover various MRI scan positions (supine only).
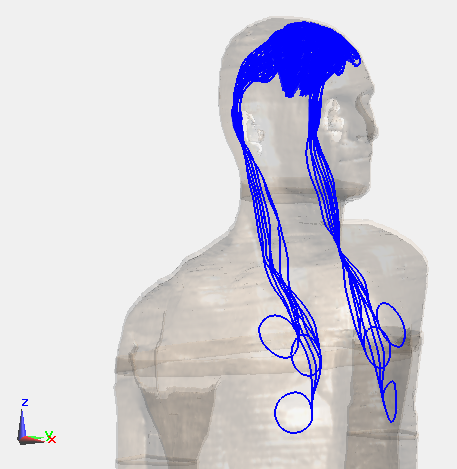
6) DBS lead pathways (lead and extension) were developed for all five models (see Figure 2). A total of more than 11000 pathways were created.
7) The voltage induced in the DBS pathways were calculated and scaled to a constant gradient slew rate.
Results
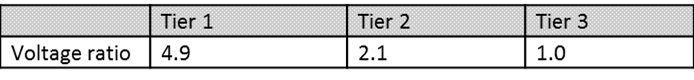
The Tier 1, Tier 2 and Tier 3 maximum gradient induced voltage levels were calculated for the DBS pathways. The voltage values were scaled to a fixed gradient slew rate and a voltage factor was calculated by dividing a voltage level by the Tier 3 value. The voltage factors are shown in Table 1.Discussion
It is observed that the Tier 3 voltage level is approximately half of the Tier 2 voltage level and one fifth of the Tier 1 voltage level. The reduction in predicted voltage level is significant, suggesting that Tier 3 approach is effective in accurately predicting the gradient induced voltage without being unnecessarily conservative.Conclusion
This study demonstrates that by adopting numerical simulation with realistic human body models, MR gradient induced voltage for an elongated implant lead can be estimated without over-conservative assumptions. This is critical especially for the MR proof of safety of DBS lead which has long lead length and potentially low tissue stimulation threshold.Acknowledgements
No acknowledgement found.References
1. ISO/TS 10974 Assessment of the safety of magnetic resonance imaging for patients with an active implantable medical device ED2
2. SEMCAD-X, Electromagnetic Simulation Platform, www.semcad.com
3. Xi Lin Chen, Computational Analysis and Methods for Electromagnetic Exposure Limits, Antenna Optimization and Cell Phone Design, 2013. (https://infoscience.epfl.ch/record/189930)
4. Andreas Christ, et al. The Virtual Family—development of surface-based anatomical models of two adults and two children for dosimetric simulations, Physics in Medicine and Biology, Vol 55, No. 2, 2009.
5. Hasgall PA, et al. IT’IS Database for thermal and electromagnetic parameters of biological tissues, Version 3.0, September 01, 2015, DOI: 10.13099/VIP21000-03-0.
Figures