5439
PRF thermometry accuracy at 7.0T for thermal MR applications with and without the presence of fat1Berlin Ultrahigh Field Facility (B.U.F.F.), Max Delbrück Center for Molecular Medicine in the Helmholtz Association, Berlin, Germany, 2Experimental and Clinical Research Center (ECRC), a joint cooperation between the Charité Medical Faculty and the Max Delbrück Center for Molecular Medicine, Berlin, Germany, 3MRI.TOOLS GmbH, Berlin, Germany
Synopsis
Proton resonance frequency (PRF) shift temperature mapping is influenced by B₀ field drift, temperature dependent electromagnetic property changes that alter phase velocity, alpha calibration and temperature dependent magnetic susceptibility changes. This work details PRF thermometry at 7.0T of a thermal MR setup. In a homogeneous agarose phantom PRF reading accuracy is within the accuracy of fiber optic sensor readings (0.29±0.21)°C. Temperature dependent magnetic susceptibility changes in pure fat lead to significant temperature reading errors. However, for more realistic thermal MR applications in the human brain (ΔT<10°C, volume fat fractions <10-20%), temperature reading accuracy is comparable to water-based samples.
Purpose
Proton resonance frequency (PRF) shift temperature mapping is influenced by B₀ field drift, temperature dependent electromagnetic property changes that alter phase velocity, alpha calibration and temperature dependent magnetic susceptibility changes1-2. The findings on temperature reading accuracy are mostly restricted to focused ultrasound ablation with high temperature changes of ΔT>10°C in a short time (<1min), small hotspot locations (<1cm) and low field (B₀=1.5T) MR thermometry readings, while validation studies using fiber optic sensor readings are mostly missing3. This work details PRF thermometry at 7.0T of a thermal MR setup (f=300MHz) that has the SNR advantage of an integrated system using dipole antennas at UHF4-5 and targets temperature changes of ΔT≤10°C in several minutes (>5min) in the whole field of view. PRF reading accuracy has been validated with fiber optic sensor readings taking into account temperature dependent magnetic susceptibility changes of fatty tissue.Methods
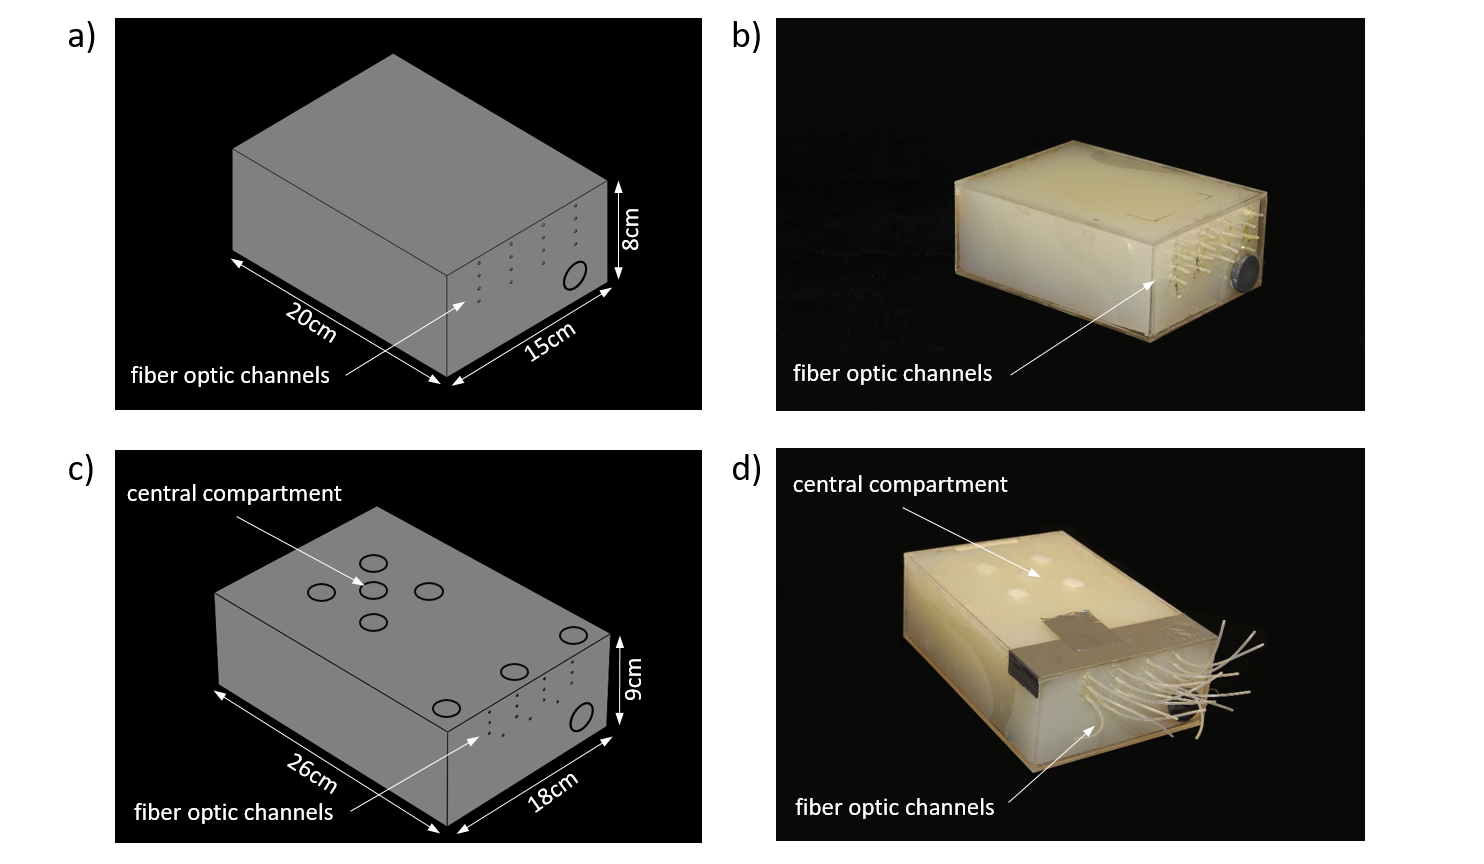
The influence of B₀ drift, temperature dependent changes of electromagnetic properties and magnetic susceptibility on a potential temperature change for ΔT=10°C was investigated. For this purpose two agarose phantoms (dimensions: (15x20x8)cm³ and (18x26x9)cm³; σ=1.03±0.01S/m, ε=71.9±2.8; T₁=1560±84ms) were constructed (Fig.1a-b) based on electromagnetic field simulations (Sim4Life, Zurich Med Tech, Zurich, Switzerland). B₀ drift correction was performed in five oil reference probes positioned outside the phantom. A constant drift was determined as an average over all oil reference probes.
Thermal MR (RF heating and MR imaging) was applied at B0=7.0T (f=300MHz) with a bow tie dipole antenna4 driven over a high peak and average power T/R switch6 (Ppeak_max≈4kW, Pavg=70W) for a duration of 3x3min. A dual gradient echo imaging technique was applied for PRF thermometry (spatial resolution=(1.5x1.5x4)mm³, TR=61ms, TE₁=2.26ms and TE₂=6.34ms, receiver bandwidth=900Hz/pixel). The proportionality constant alpha was calibrated in the homogenous phantom (Fig.1a), using four fiber optic sensors at different locations and four different measurement time points. The effects of temperature dependent magnetic susceptibilities of fat were investigated using four different samples a) agarose b) 10% c) 20% volume concentration of sunflower oil in in an agarose (2g/100ml) deionized water mixture and d) pure sunflower oil. Three fiber optic sensors (Neoptix, Quebec, Canada) were used for independent temperature validation.
Results
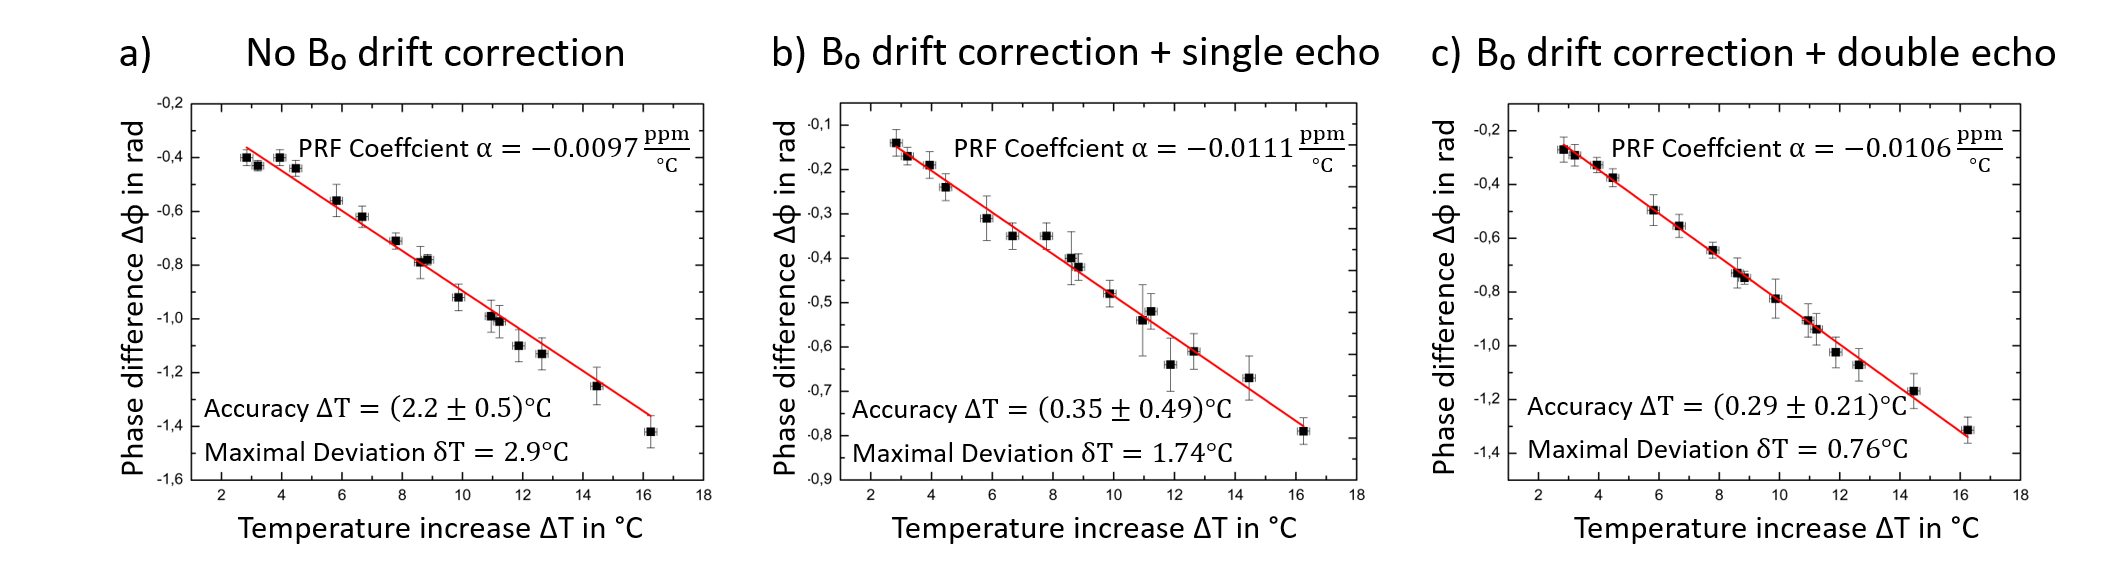
In the homogenous phantom the PRF temperature proportionality constant α was -0.0106ppm/°C. This value correlates well with the values found in the literature7 of -0.0103ppm/°C. B₀ field drift was 0.004ppm after 8min of measurement, which accounted to an error of (2.2±0.5)°C in comparison to fiber optic readings (Fig.2a). Using the oil reference probes the error could be corrected to (0.35±0.49)°C using a single echo (TE=2.26ms) (Fig. 2b) and (0.29±0.21)°C using a double echo (TE₁=2.26ms, TE₂=6.34ms) (Fig.2c). Applying all corrections, PRF temperature reading accuracy approaches fiber optic sensor reading accuracy of ±0.2°C for the homogenous phantom. A single echo readout has only slightly higher inaccuracy, however temperature dependent phase velocity changes are expected to be larger for larger heating volumes, suggesting that a double echo PRF method should be applied.
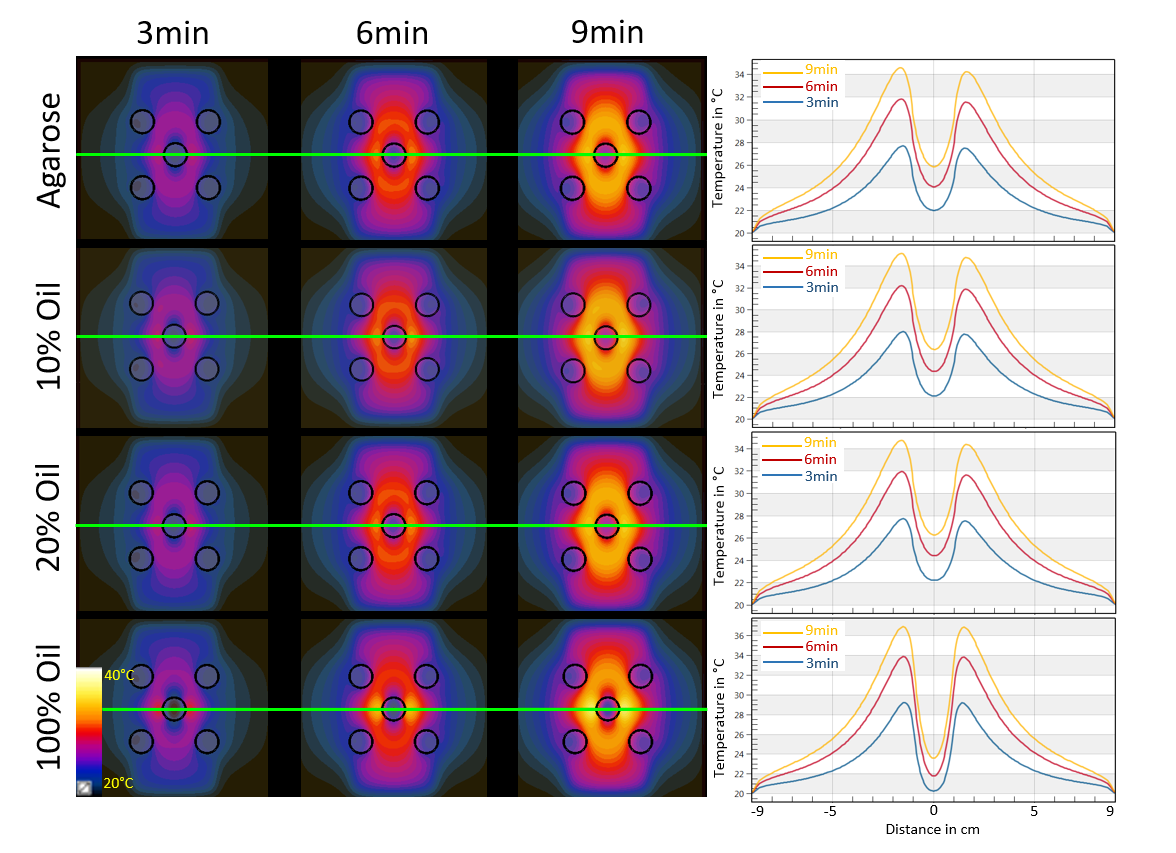
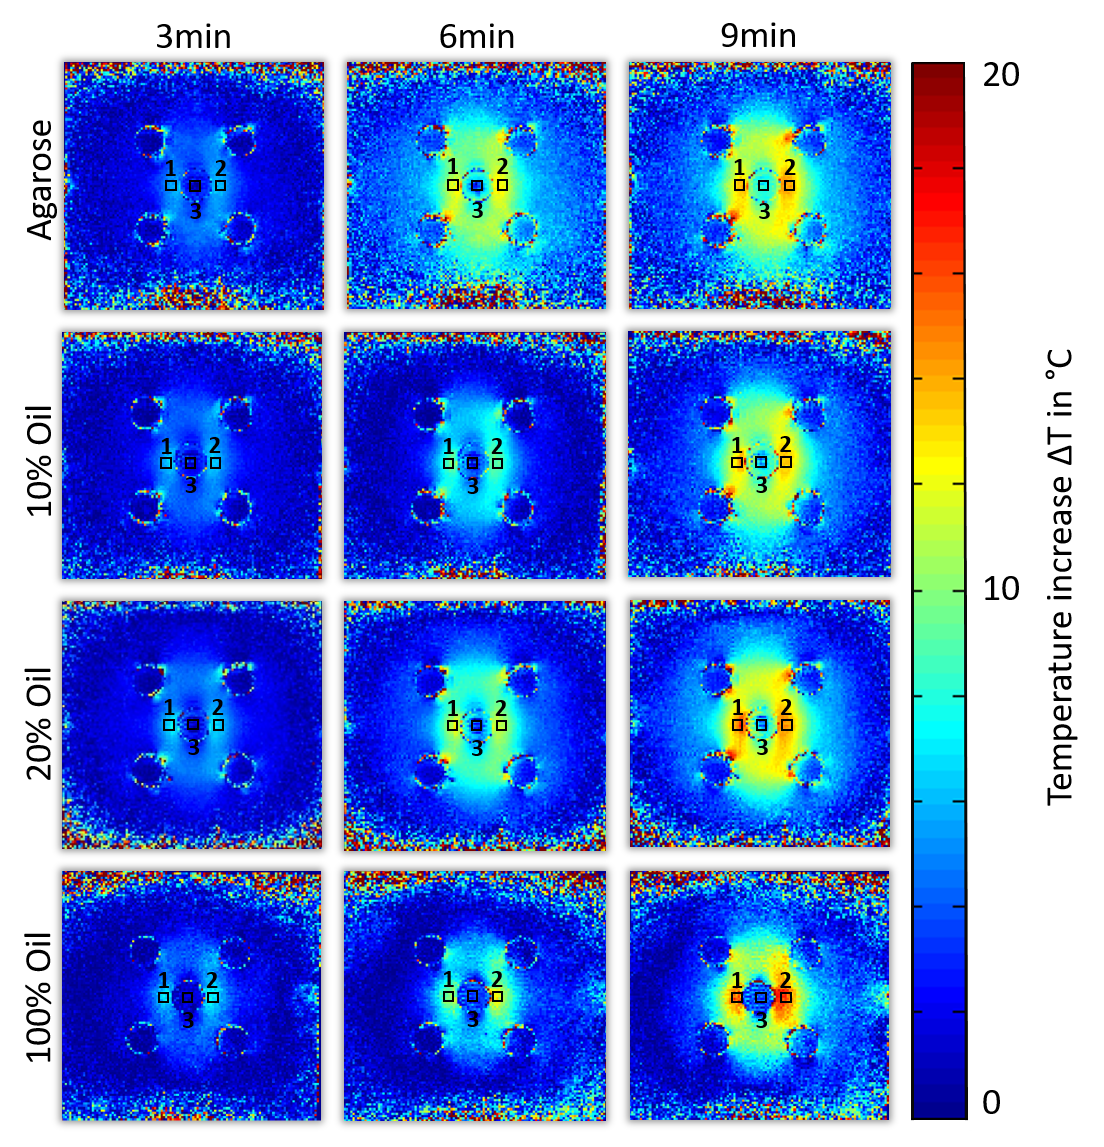
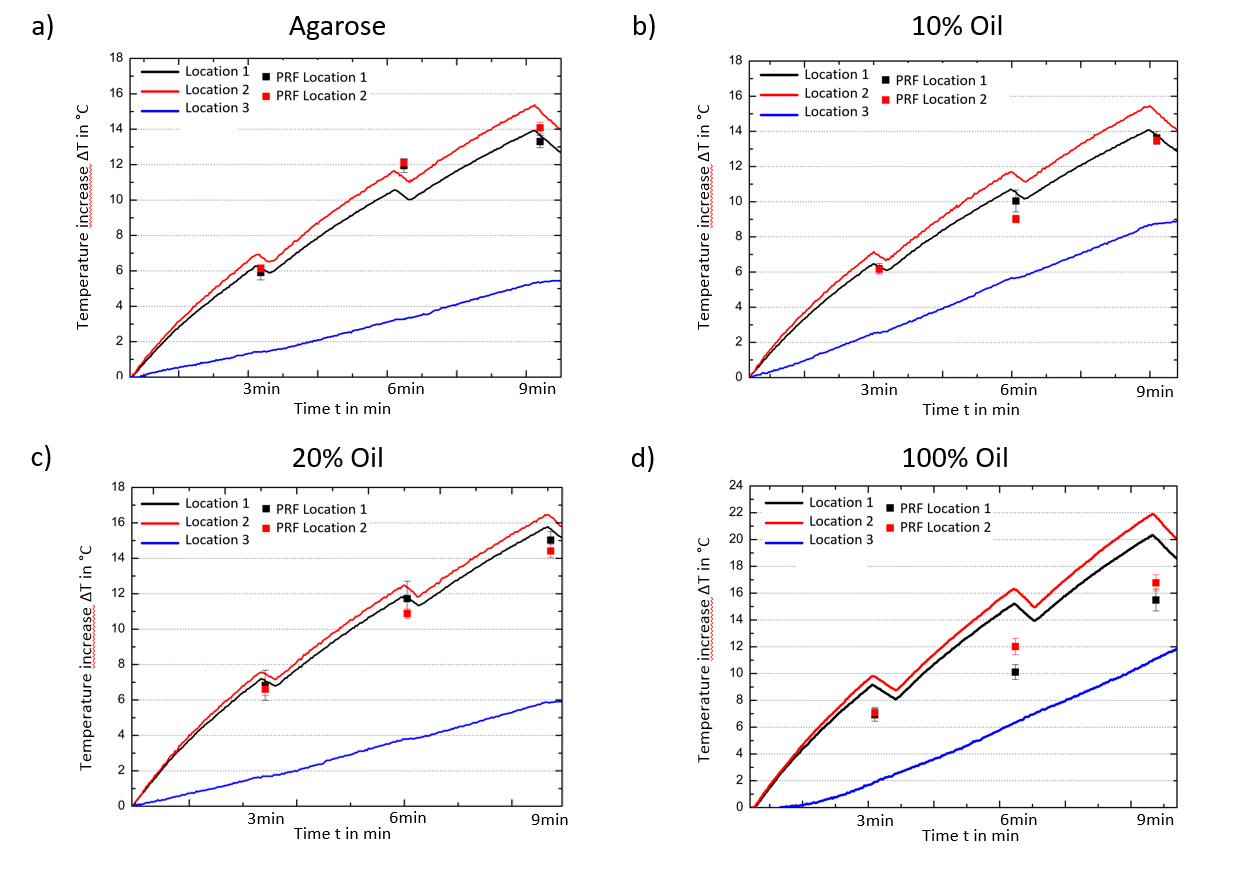
Temperature simulations show (Fig. 3) that a dipolar heating pattern around the central compartment is already expected from the E-field distribution alone and is stronger pronounced for 100% oil with lower electrical conductivity and permittivity values altering the wavelength. On top of these changes temperature dependent magnetic susceptibility affects temperature reading accuracy. PRF temperature maps for all probes (agarose, 10%, 20% and 100% fat concentration) and fiber optic locations are displayed in Fig.4. Temperature evolution of the fiber optic readings is displayed in Fig.5 For pure sunflower oil, the temperature accuracy of the PRF method was (3.95±1.24)°C showing a strong effect of temperature dependent magnetic susceptibility changes8. For more realistic fat fractions found in vivo9 the accuracies were (0.93±0.95)°C for a 10% and (0.88±0.72)°C for a 20% fat fraction, which is similar to the accuracy found for agarose (0.81±0.52)°C (Fig.5).
Conclusion
The accuracy of the PRF shift method of (0.29±0.21)°C is within the accuracy of fiber optic sensor readings in a homogeneous phantom. Temperature dependent magnetic susceptibility changes in pure fat lead to significant temperature reading errors8. However, for thermal MR applications in the human brain within a temperature change of ΔT<10°C and small volume fat fractions <10-20%, temperature reading accuracy is comparable to the agarose samples. These initial results are encouraging and an important step towards accurate thermal dose determination (CEM43)10-11 for safety evaluations and thermal therapies12.Acknowledgements
This work was supported in part (T.N., L.W.) by the German Federal Ministry of Education and Research, “KMU-innovativ”: Medizintechnik 13GW0102.References
1 Rieke V and Pauly KB, "MR Thermometry" JMRI, 2008; 27(2):376-390
2 Winter L, et al., "Magnetic resonance thermometry: Methodology, pitfalls and practical solutions", Int J Hyperthermia, 2015; 6736:1-13
3 McDannold N, "Quantitative MRI-based temperature mapping based on the proton resonant frequency shift: review of validation studies", Int J Hyperthermia, 2005;21(6):533-546
4 Winter L, et al., "Design and Evaluation of a Hybrid Radiofrequency Applicator for Magnetic Resonance Imaging and RF Induced Hyperthermia: Electromagnetic Field Simulations up to 14.0 Tesla and Proof-of-Concept at 7.0 Tesla", PLOS ONE, 2013; 8(4):e61661
5 Winter L, et al., "Thermal magnetic resonance: physics considerations and electromagnetic field simulations up to 23.5 Tesla (1GHz)", Radiat Oncol, 2015; 10:201
6 Ji Y, et al., "High Power Transmit/Receive Switch for Thermal MR at 7.0 Tesla", ISMRM Workshop on UHF MRI, 2016; #19
7 Tarasek MR, et al., "Validation of MR thermometry: Method for temperature probe sensor registration accuracy in head and neck phantoms", Int J Hyperthermia, 2014; 30(2):142-149
8 Sprinkhuizen SM, et al., "Temperature-induced tissue susceptibility changes lead to significant temperature errors in PRFS-based MR thermometry during thermal interventions", MRM, 2010; 64(5):1360-1372
9 Woodard HQ and White DR, "The Composition of Body Tissues", Brit J Radiol, 1986; 59(708):1209-1218
10 Van Rhoon GC, et al., "CEM43° C thermal dose thresholds: a potential guide for magnetic resonance radiofrequency exposure levels?", Eur Radiol, 2013; 23(8):2215-2257
11 Murbach M, et al., "Thermal Tissue Damage Model Analyzed for Different Whole-Body SAR and Scan Durations for Standard MR Body Coils", MRM, 2013; 71:421-431
12 Sneed PK, "Survival benefit of hyperthermia in a prospective randomized trial of brachytherapy boost+/-hyperthermia for glioblastoma multiforme", Int J Radiat Oncol Biol Phys, 1998; 40(2):287-295
Figures