5438
Monitoring of Microbubbles Stable Cavitation in a Flowing Phantom by Using MRI1Department of Biomedical Engineering and Environmental Sciences, National Tsing Hua University, Hsinchu, Taiwan, 2Department of Physical Medicine and Rehabilitation, National Taiwan University Hospital, Taipei, Taiwan, 3Department of Electrical Engineering, Chang-Gung University, Taoyuan, Taiwan
Synopsis
We aim to real-time monitor the signal intensity (SI) change of microbubbles in the presence of stable cavitation (SC) effect in a flowing phantom to comprehend the combining effects of SC and flow. Distinct reduced SI was observed, particularly in the focused ultrasound (FUS) focus and downstream regions, during transmitting FUS pulses. More substantial SI changes can be observed with increase of acoustic pressure. In this study, we verified the feasibility of using HASTE sequence to real-time monitor SI changes at the presence of SC effect of MBs in a flowing phantom.
Introduction
Blood–brain barrier (BBB) opening can be induced by stable cavitation (SC) or inertial cavitation (IC).1,2 SC is a more appropriate scheme to conduct BBB opening because the disruption of gas-filled microbubbles (MBs) under IC causes hemolysis.3 Previous studies demonstrated that transmitting focused ultrasound (FUS) pulses to MBs in static tissue or phantom can induce signal intensity (SI) changes on gradient-echo or spin-echo images.4,5 However, the monitoring of SI changes due to SC in a static phantom may be largely different from in vivo situation with flowing effect. In this study, we aim to real-time monitor the SI change of MBs in the presence of SC effect in a flowing phantom to comprehend the combining effects of SC and flow.Methods
We constructed an in vitro agarose flowing phantom containing a hollow
chamber (diameter=3mm), injecting 0.1% MBs (lipid shell with C3F8,
mean diameters=1.25µm, concentration = (4.36±0.32)×1010 droplets/mL)6 solution at flowing velocity of 2cm/s . The FUS
sonication was applied by a small-bore image-guided focus ultrasound transducer
(RK300, FUS Instruments, Toronto, Canada). FUS pulses with pulse repetitive
frequency (PRF) 1Hz, duty cycle 1%, and different acoustic pressure (0.1, 0.2,
0.3, 0.4MPa) were employed. We used mechanical index (MI) to identify the
onset of SC (MI<0.4).7 A control
experiment with injection of normal saline (NS) was examined in the condition
of 0.3MPa, PRF 1Hz and duty cycle 1%. All experiments were conducted in a 7-Tesla MR
scanner (ClinScan, Bruker, Billerica, USA). We performed half-Fourier
acquisition single-shot turbo spin-echo (HASTE) with parameters as follows: TR/TE= 700/29ms,
pixel size= 0.27x0.27x1mm3, temporal resolution=0.7s, 200
measurements (140s). All images were acquired at the focal plane and were
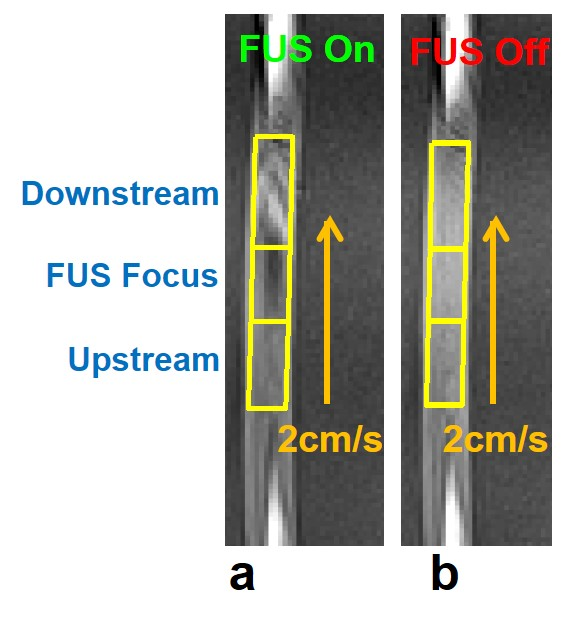
perpendicular to the direction of ultrasound beams. To evaluate SI change, three regions-of-interesting (ROIs), including
downstream-region, focus-region, and upstream-region, were selected
manually by a self-developed program (Figure 1). The SI and standard deviation (STD) within ROI is
normalized to mean SI and mean STD during the pre-FUS period, respectively: normalized
SI=(SI/SIpre)x100%, and normalized STD=(STD/STDpre)x100%.Results
As shown in Figure 1a, focus- and downstream-region displayed substantial SI changes upon transmitting FUS pulses. In the meanwhile, there is no SI change in upstream-region. After turning off FUS pulses, there is no SI change in three regions (Figure 1b).
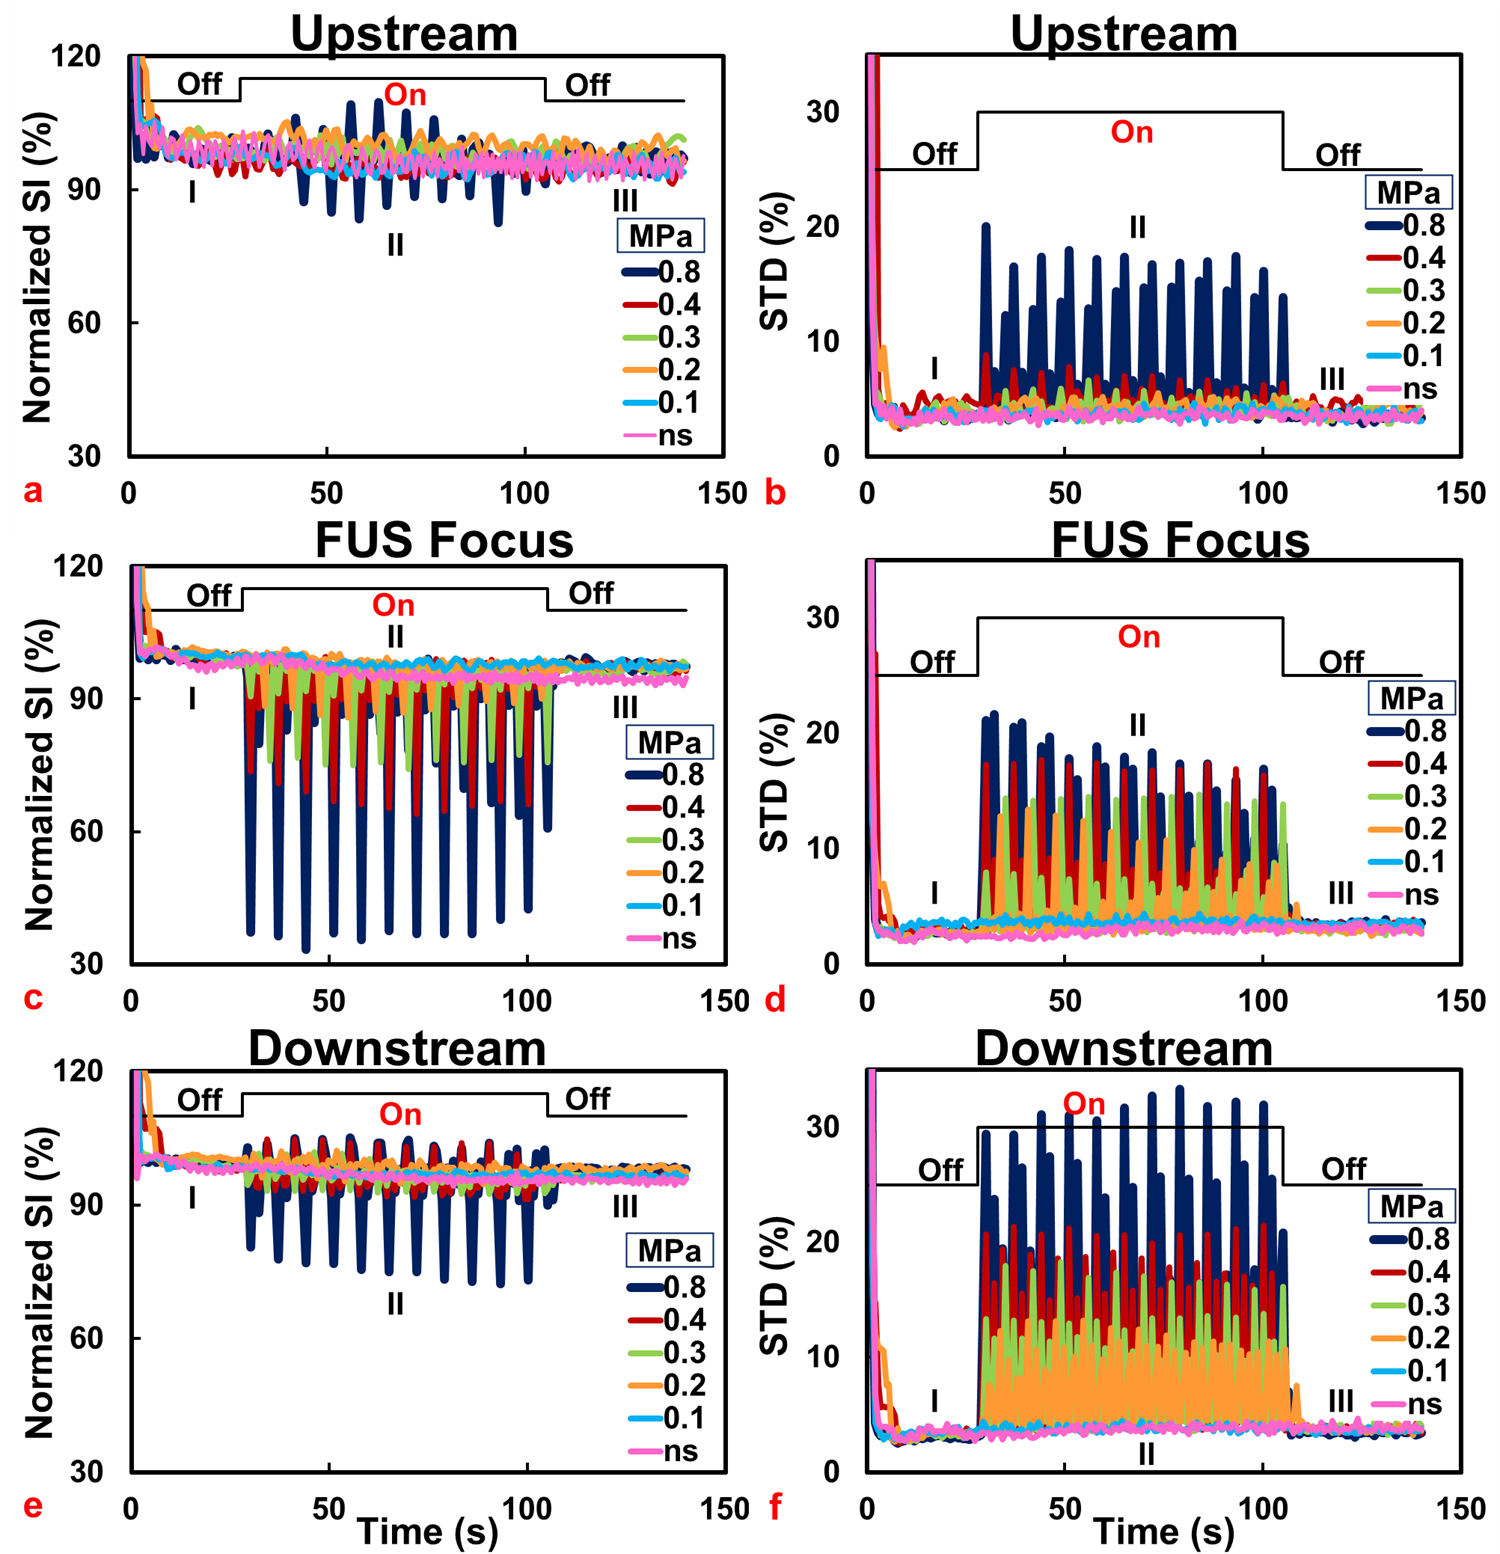
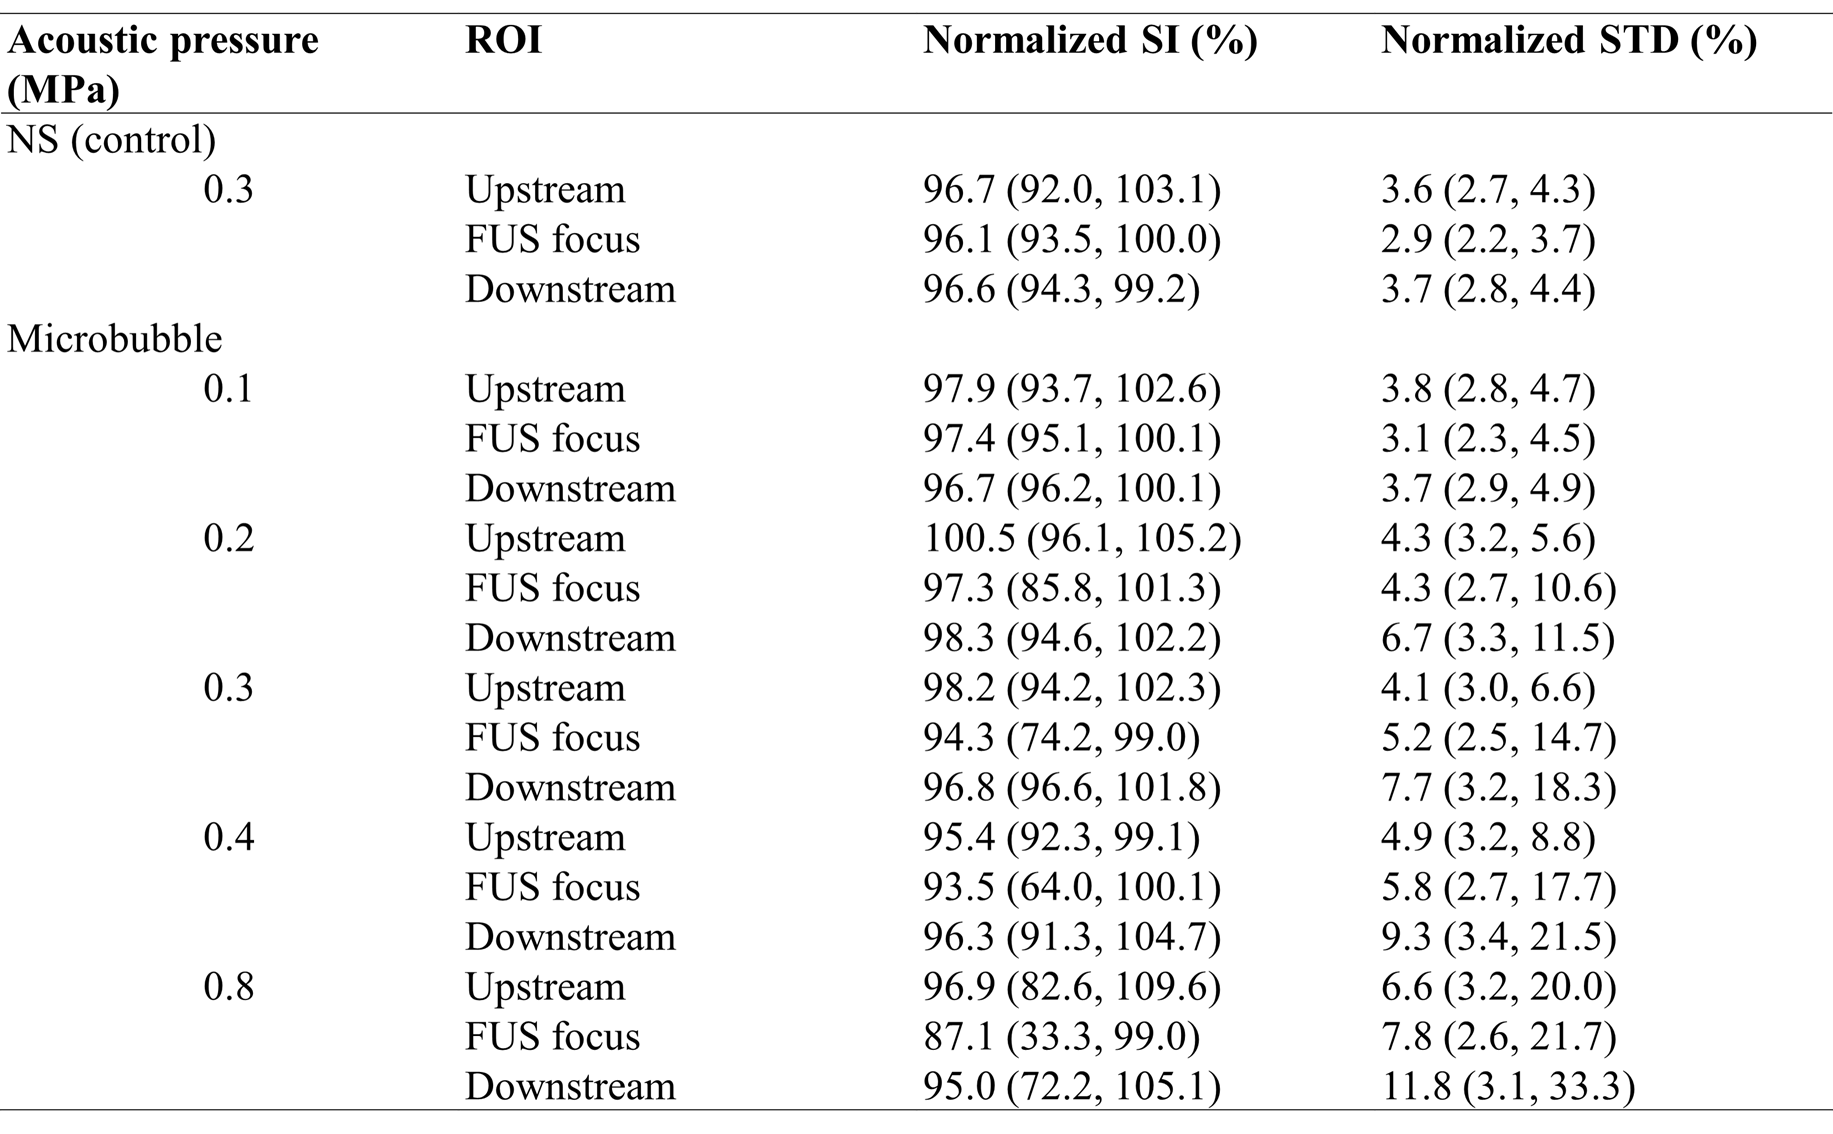
Figure 2 displays typical time courses of normalized SI and STD with different acoustic pressures. Specific statuses of the time courses were marked as: (I) Pre-FUS, (II) transmission of FUS, and (III) Post-FUS. At Pre- and Post-FUS, normalized SI and STD maintained at approximate 100% and 3.2 % respectively, for each acoustic pressure. During transmitting FUS pulses, the upstream-region displayed almost no SI or STD changes (Figures 2a and 2b), except with high acoustic pressure of 0.8MPa. In focus-region (Figures 2c and 2d), the normalized SI changed from 100% to 98.1%, 87.9%, 75.8%, 67.3%, 37.3% and STD changed from 3.2% to 3.7%, 8.9%, 14.3%, 17.1%, 18.3% for acoustic pressure of 0.1, 0.2, 0.3, 0.4, and 0.8MPa, respectively, indicating SI changes and STD raised with increasing acoustic pressure. Because of the continuous MBs-supplement, even with high pressure as 0.8MPa (MI=0.8, IC), SI change continues until the end of FUS transmission. Compared to focus-region, downstream-region (Figure 2e and 2f) displayed less SI changes but more pronounced STD changes due to the combination of hyper- and hypo-SI showing within downstream-region (Figure 1a). Additionally, control experiment referred that no SI change was shown in the absence of MBs. Table 1 summarizes SI changes and STD of all experiments.
Discussion& Conclusion
In this study, we employed HASTE sequence to real-time monitor SI changes in a flowing phantom with the presence of MBs of SC effect. Distinct reduced SI was observed particularly in the focus- and downstream-region under FUS exposure. More substantial SI changes is observed with increasing acoustic pressure. Reduced SI can be attributed to two effects. First, because the excited spins rapidly flow out of imaging plane owing to cavitation-induced disturbing flow, the spin-echo signals are not able to be refocused. Second, the intra-voxel dephasing effect also lead to reduced SI. In downstream-region, we observed hyper-echo and hypo-echo resulted from flow-related enhancement and phase dispersion, respectively, solely observing averaged SI changes within the ROI may underestimate the occurrence of SC. Therefore, STD was an adjunct to help monitoring SC effect. In conclusion, we verified the feasibility of using HASTE sequence to real-time monitor SI changes at the presence of SC effect of MBs in a flowing phantom. In the future, in vivo studies shall be conducted to clarify the correlation between extent of SC induced SI changes and the location of BBB-opening.Acknowledgements
This study was supported by Center for Advanced Molecular Imaging and Translation, Chang Gung Memorial Hospital for facilities.References
1. Pouliopoulos AN, et al. Exploiting flow to control the in vitro spatiotemporal distribution of microbubble-seeded acoustic cavitation activity in ultrasound therapy. Physics in medicine and biology. 2014;59(22):6941.
2. Liu H-L, et al. Combining microbubbles and ultrasound for drug delivery to brain tumors: current progress and overview. Theranostics. 2014;4(4):432.
3. Chen W-S, et al. The pulse length-dependence of inertial cavitation dose and hemolysis. Ultrasound in medicine & biology. 2003;29(5):739-48.
4. Allen SP HT, et al. MR-based targeting of histotripsy therapy at 7T. In Proceedings of the 21st Annual Meeting of ISMRM, Salt Lake City, Utah, USA, 2013. 2013:Abstract 1831.
5. Peng HH, et al. Real-time monitoring of inertial cavitation effects of microbubbles by using MRI: In vitro experiments. Magnetic resonance in medicine. 2015.DOI 10.1002/mrm.26082.
6. Fan C-H, et al. Submicron-bubble-enhanced focused ultrasound for blood–brain barrier disruption and improved CNS drug delivery. PloS one. 2014;9(5):e96327.
7.Nelson TR, et al. Ultrasound biosafety considerations for the practicing sonographer and sonologist. Journal of Ultrasound in Medicine. 2009;28(2):139-50.
Figures