5437
Variation of B1+ Homogeneity and SNR Efficiency in Select Water Bolus Designs for Transcranial MR-Guided Focused Ultrasound1MRI, GE Global Research, Niskayuna, NY, United States, 2Insightec Ltd., Tirat Carmel, Israel
Synopsis
Transcranial magnetic resonance (MR)-guided focused ultrasound (tcMRgFUS) has gained prominence as a technology for treating several brain pathologies. A typical FUS applicator has a large water bolus in direct contact with the patient’s head to provide (i) acoustic coupling to the patient, and (ii) a means to remove heat generated from acoustic absorption in the skull. These water bolus structures can lead to significant image artefacts. Here we use electromagnetic simulations to assess water bolus compartment designs that have different electrical properties. The goal is to downselect a design that produces improved B1+ homogeneity and SNR in a region of interest.
Purpose:
Thermotherapy-based interventional technologies have rapidly developed as means for non-invasive direct- or adjuvant-treatment of several pathologies. In particular, transcranial magnetic resonance (MR)-guided focused ultrasound (tcMRgFUS) has gained prominence as a technology for treating several brain pathologies.1,2 Treatment planning and monitoring for tcMRgFUS is achieved by using MR imaging, and much recent work has gone into improving ultrasound (US) transducer arrays to accommodate fast switching gradients.3 In addition to the US transducer elements, a typical focused ultrasound applicator also has a large water bolus that is in direct contact with the patient’s head. The water bolus provides (i) acoustic coupling to the patient, and (ii) a means to remove heat generated from acoustic absorption in the skull. These water bolus structures can lead to significant image shading due to dielectric resonance effects that produce inhomogeneous B1+ fields. Here, we use electromagnetic (EM) simulations to assess water bolus compartment designs that have different electrical conductivity (δ) and permittivity (ε) configurations. The goal is to downselect a design that produces improved B1+ homogeneity and SNR in a region of interest. The improvements are defined with respect to (i) a reference design, and (ii) when the transcranial setup is not present.Methods:
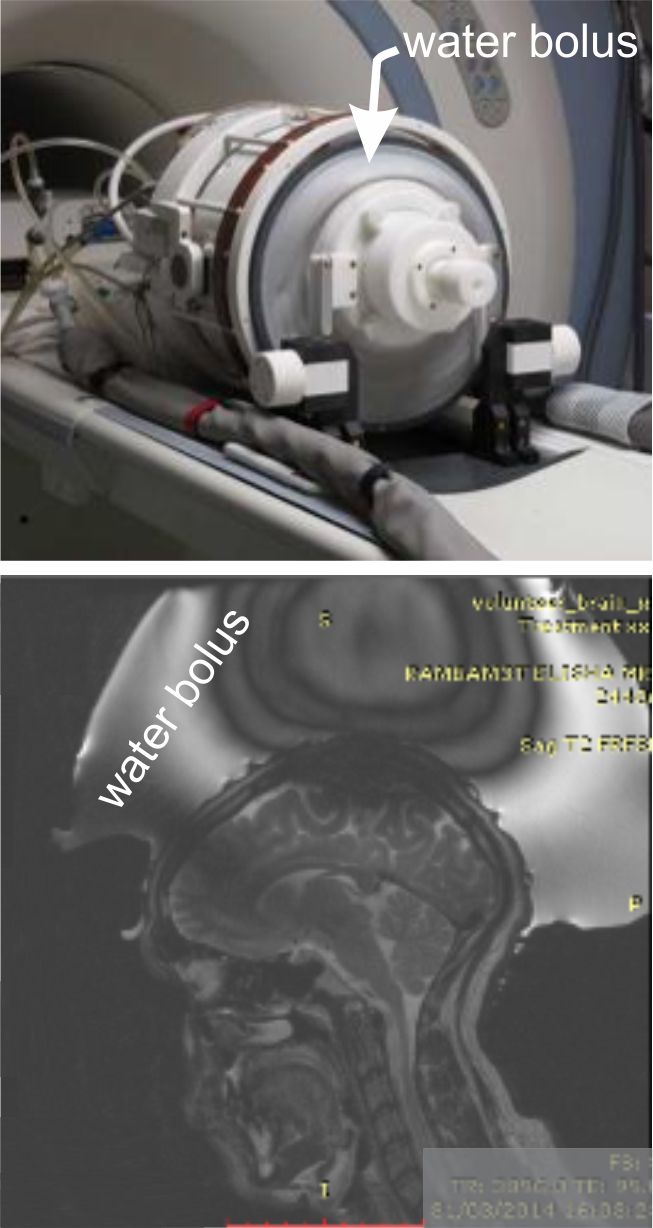
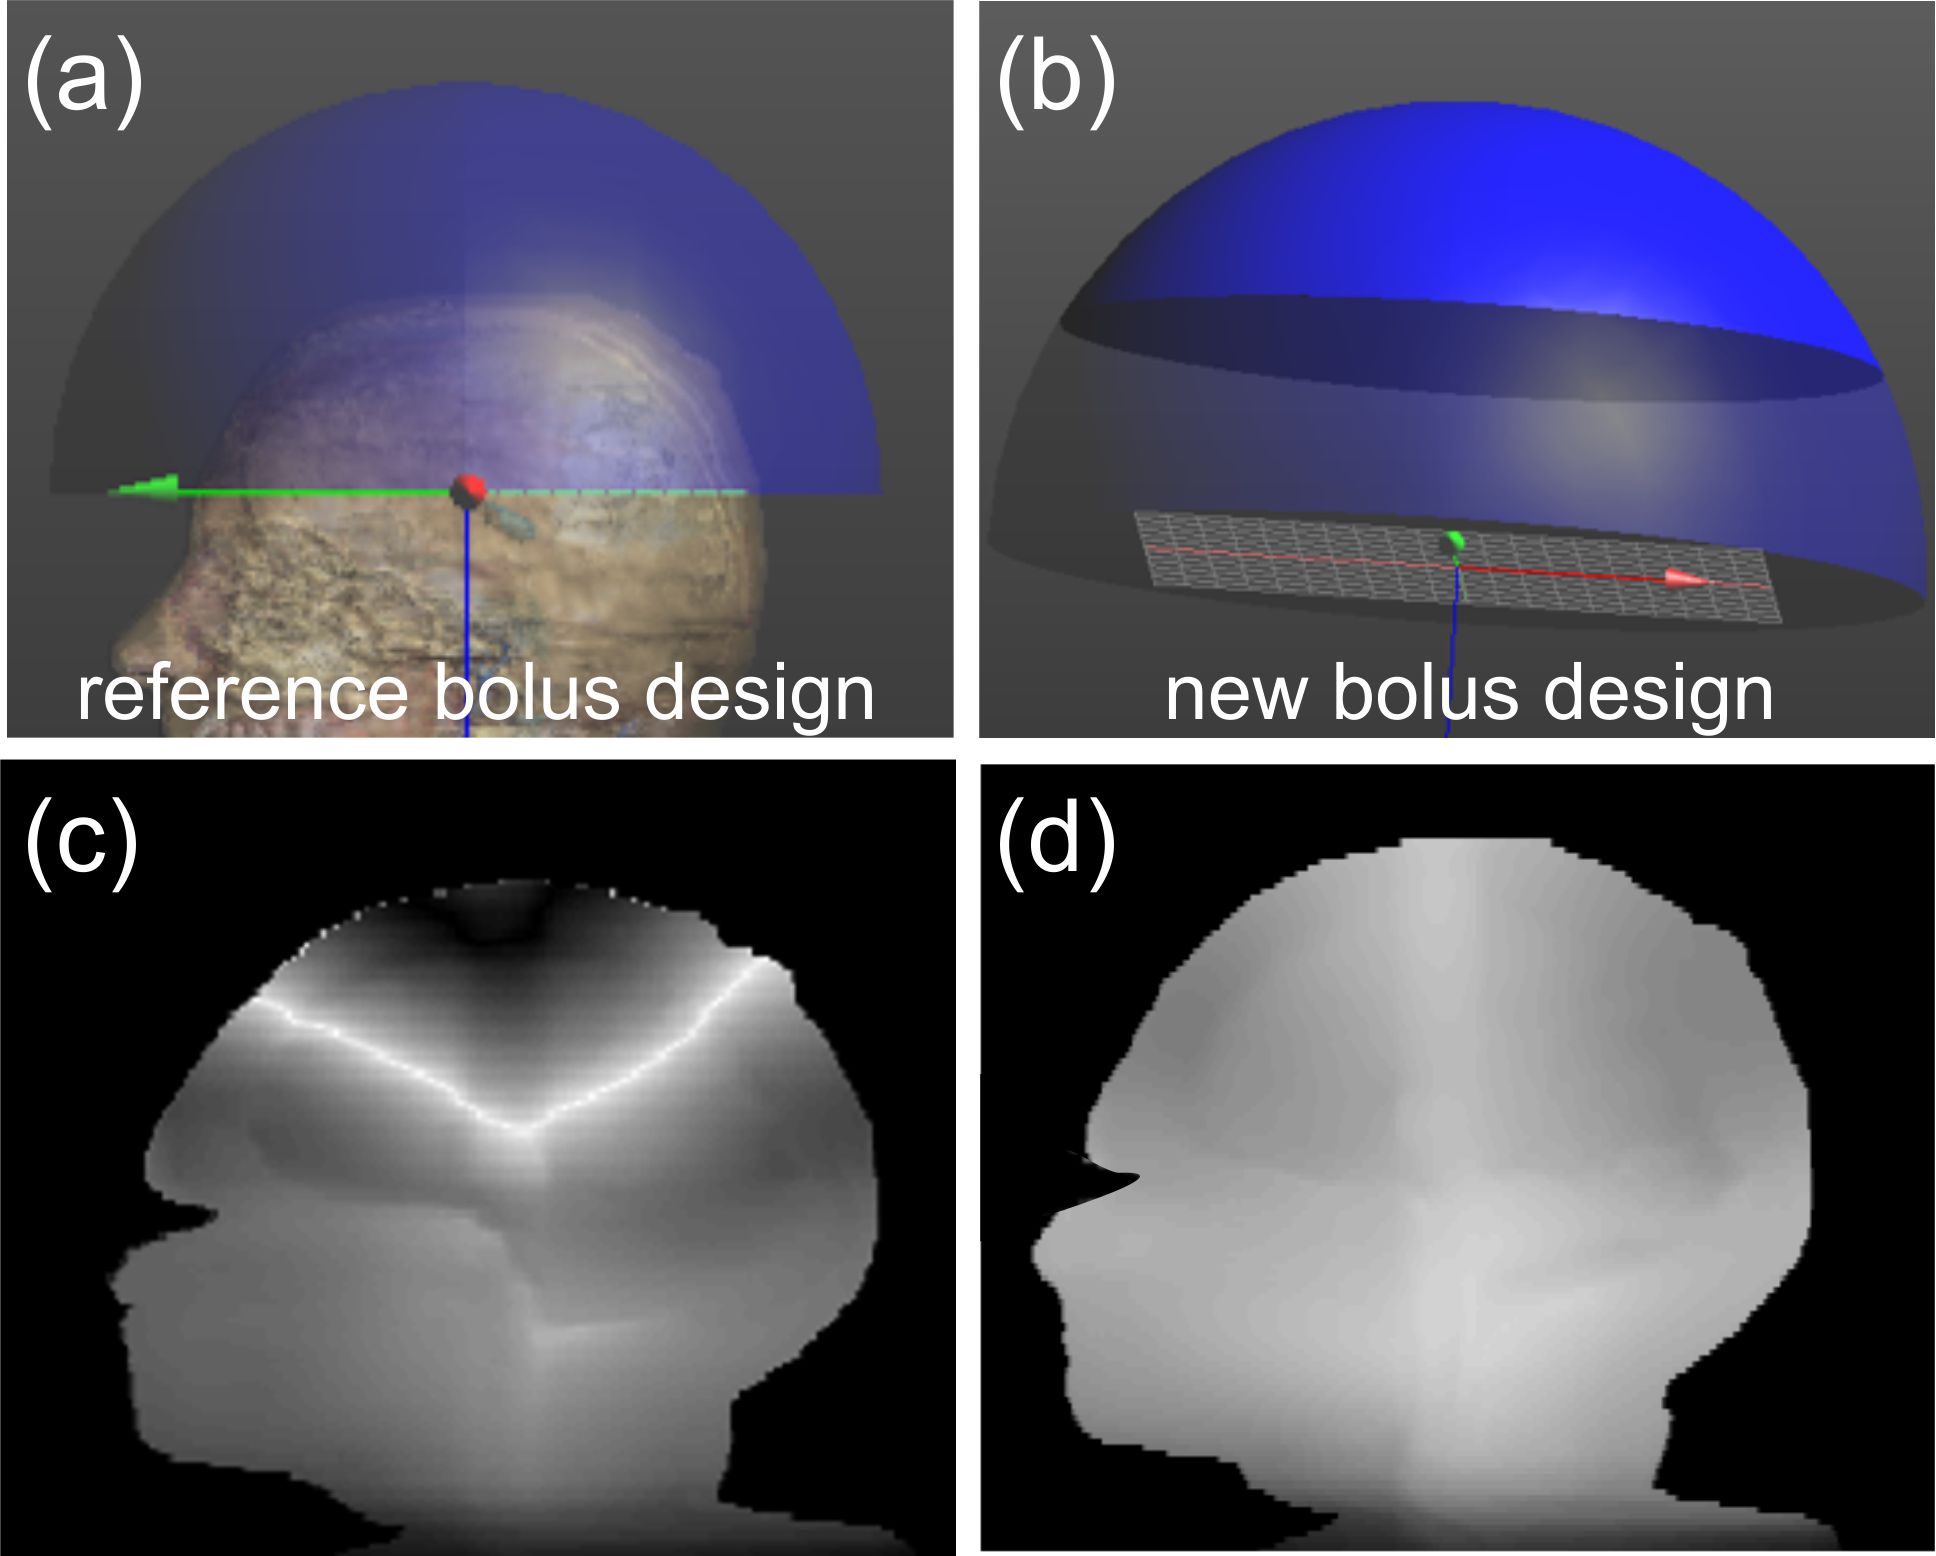
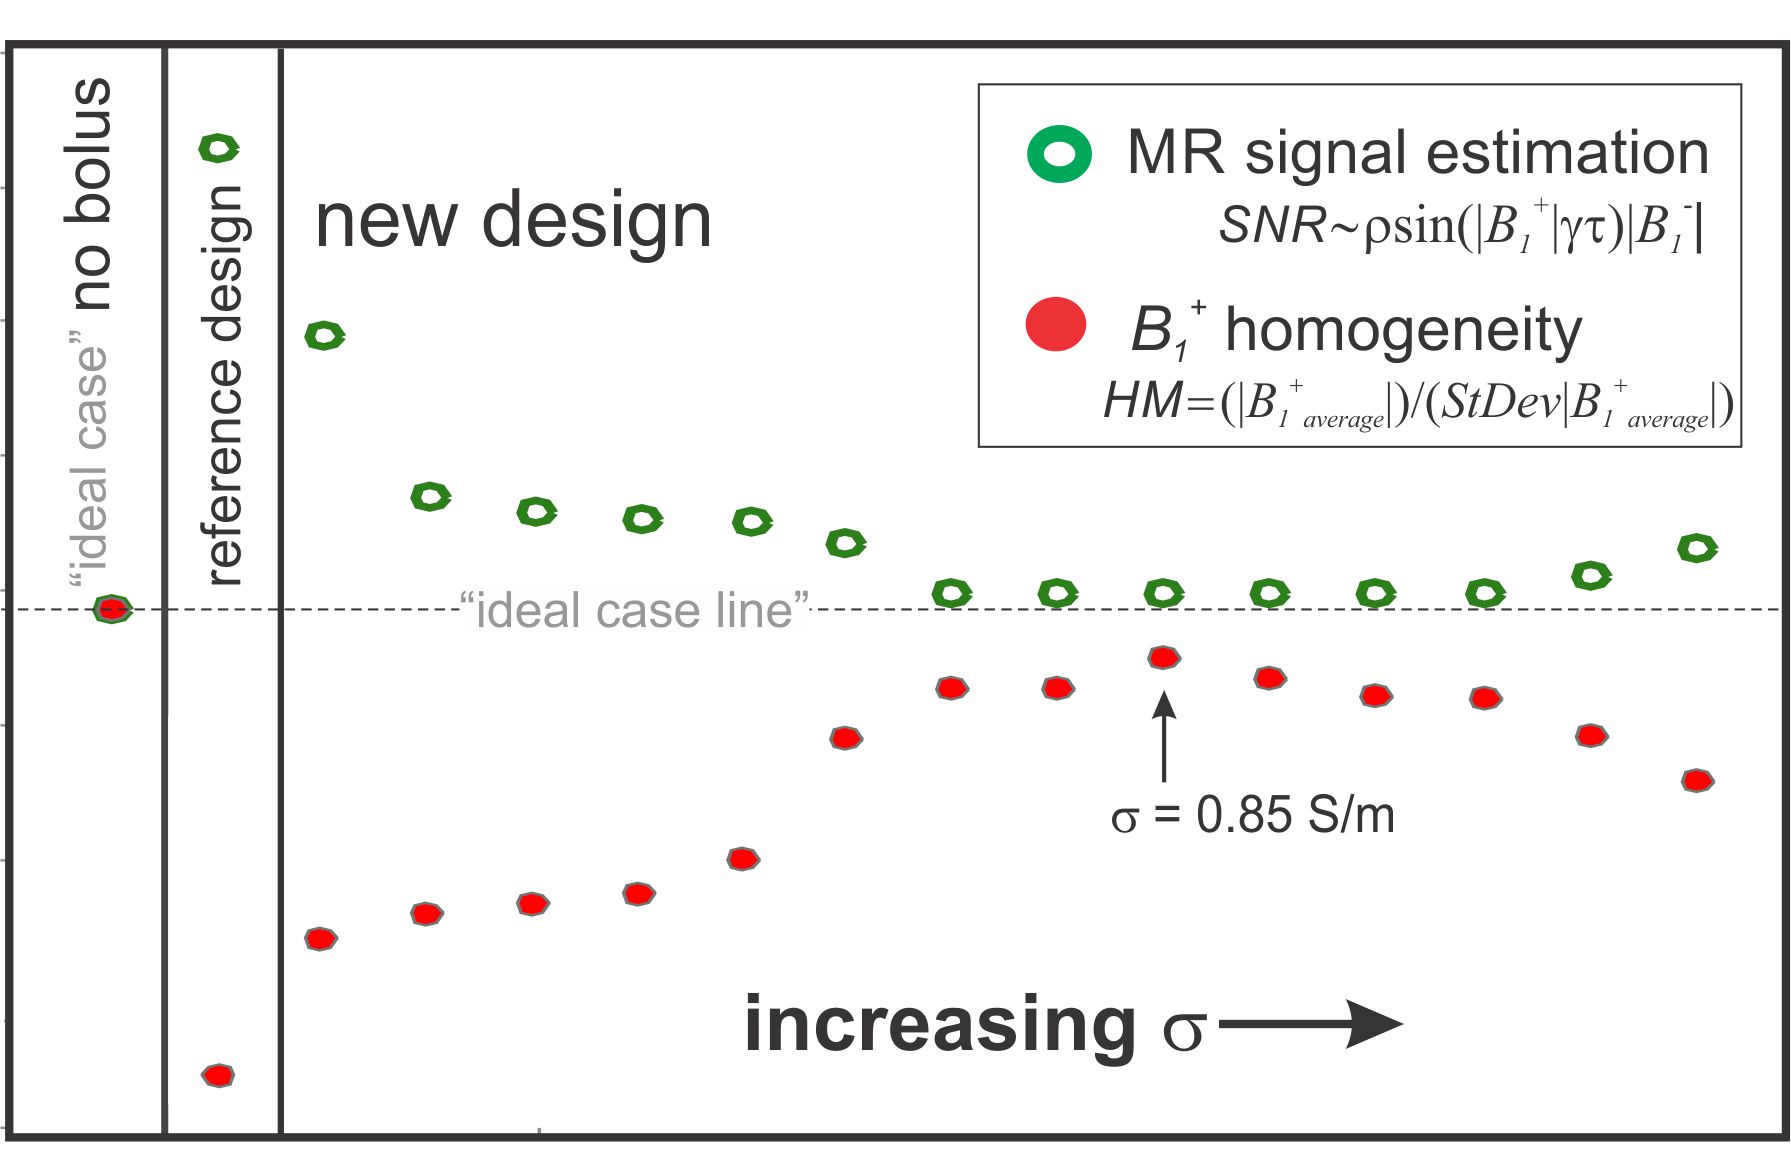
An EM model for a 3T 16-rung whole body high-pass birdcage coil was developed using the EM simulation package SEMCAD X (SPEAG, Zürich, Switzerland). Here, the coil was excited by two edge sources (127MHz, quadrature mode) and the EM field distributions from various simulations were extracted and post processed in Matlab (Mathworks, Natick, MA). The Duke human body model4 (HBM) was used as the test phantom. Fig. 2a shows the HBM head with a reference water bolus design. We investigated the influence of the water bolus on the B1+ field distributions in the HBM brain in four scenarios: (1) HBM in birdcage coil (no water bolus), (2) HBM in coil with reference water bolus design (δ = 0 S/m, ε= 79), (3) HBM in coil with reference water bolus design with various electrical properties (Δδ,Δε), and (4) HBM in coil with new water bolus design (Fig. 2b) where the top portion of the bolus was assigned different electrical properties (Δδ,Δε) and lower portion of the bolus was assigned nominal electrical properties of DI water (δ = 0 S/m, ε= 79). We define B1+ homogeneity as HM = (B1+avg)/(StDev B1+), averaged over the brain volume. Imaging SNR was quantified by SNR = |B1-|× ρsin(|B1+|γτ) and also averaged over the brain volume. Experimental MRI data was collected on a 3T GE MR750 scanner for the reference bolus design (design scenario 2). A comparison was made between the reference bolus simulation and the experimental reference bolus results for EM model validation. Additional results are presented for different simulation designs.Results and Discussion:
Experimental data was collected for the reference bolus (design scenario 2). Results show severe magnitude intensity variation in the superior brain region (Fig. 1 bottom). EM simulation results for design scenario 2 (shown in Fig. 2c) qualitatively replicate the signal inhomogeneity pattern of Fig. 1b, and serve as a reference for new design comparison. The computed values of HM and SNR are shown in Fig. 3 for scenarios 1, 2, and 4 (scenario 4 is depicted in Fig. 2b). We see an approximate 4-fold improvement in B1+ homogeneity with <3% loss in MR signal with the implementation of this new bolus design. In addition, we see that there is an optimal electrical conductivity (0.85 S/m) for the dark-colored region of design 4, which brings our imaging metrics closest to the ideal scenario 1 (see “ideal line” on Fig. 3). A simulated MR image for design 4 is shown in Fig. 2d for direct improvement visualization over design 2 (Fig. 2c).Conclusion:
Experiments done here show that the high-ε (79), low-δ (0 S/m) of water bolus design 2 leads to severe image intensity variation in the superior end of the brain (Fig. 1 - bottom). Simulation results for design 2 closely resemble experimental results (Fig. 2c). Simulation results support the hypothesis that the presence of the water bolus induced a focused high |B1+| above the head, which led to over-flipping of proton spins in that region (darker image intensity). Finally, this work shows that there are several water bolus design variations that can mitigate these imaging artefacts, e.g., design 4 (Fig. 2b and d, and Fig. 3). Most notably in this case, electrical conductivity had the most impact on B1+ homogeneity and SNR variations among the EM parameters studied in this paper (see Fig. 3).Acknowledgements
No acknowledgement found.References
[1] Martin et al. Ann Neurol. 2009; 66:858–61.
[2] McDannold et al. Neurosurgery. 2010; 66:323–32.
[3] Lechner-Greite et al. J Ther Ultrasound 2016; 4:4
[4] Christ et al. Phys. Med. Biol. 2010; 55: N23-38
Figures