5426
Visualization of the VIM Thalamic Nucleus using Synthesized MPRAGE Images1Diagnostic Radiology and Nuclear Medicine, University of Maryland School of Medicine, Baltimore, MD, United States
Synopsis
The ventral intermediate nucleus (VIM) of the thalamus is a highly effective target for treatment of essential tremor (ET). Visualization of VIM is however challenging due to the lack of T1 or T2 MRI contrast between the various thalamic nuclei. In this study, we used synthesized MPRAGE images with varied inversion time (TI) (SynTI images) to visualize the VIM for pre-surgical planning in MRgFUS treatment of ET. Verification based on 24hr post-treatment lesion location on four patients showed good agreement from the identified VIM with lesion center.
Introduction
The ventral intermediate nucleus (VIM) of the thalamus is a highly effective target for treatment of essential tremor (ET).1 Visualization of VIM is however challenging due to the lack of T1 or T2 MRI contrast between the various thalamic nuclei. Stereotactic method is still the gold standard to locate VIM and targeting is confirmed from intermittent behavioral assessments in MR-guided Focused Ultrasound (MRgFUS) treatment. Due to the potential high variability in individual anatomy, this approach could lead to prolonged targeting time and potentially ineffective treatment. In this study, we propose to use synthesized MPRAGE images with varied inversion time (TI) (SynTI images) to visualize the VIM for pre-surgical planning in MRgFUS treatment of ET.Methods
Imaging: Sagittal 3D MPRAGE sequences were acquired on a Siemens 3T Tim Trio scanner on four ET patients before and 24hr after their MRgFUS treatment. All patients had a successful treatment leading to at least 50% reduction in tremor symptoms. MPRAGE data were acquired with two TI’s, one at 406ms to provide a white matter nulled contrast; while the other at 1500ms to provide a T1-weighted contrast. Other imaging parameters were: TE/TR = 3.2ms/4000ms, flip angle 4°, resolution 256 x 256 x 160, FOV = 256cm, 1mm sections.
Data analysis: 3D volumes with the two TI’s were first registered using the FLIRT tool from FSL (FMRIB, Oxford, UK, 6 DOF) for each subject. Proton density, S0 and T1 values were estimated on a voxel-by-voxel basis using the standard IR T1 recovery equation: SI(S0,T1) = S0*(1-2*exp(-TI/T1)). After T1 estimation, SynTI images were created with TI’s continuously ranging from 400ms to 1000ms enabling the visualization of various thalamic nuclei. The post-treatment T2-weighted images were registered to the pre-treatment SynTI image for lesion location verification.
VIM identification: The Vim nucleus is defined by Hassler and colleagues,2 which is alternatively defined as at the ventral and posterior part of the VLp nuclei by Hirai and Jones3 (as also in Morel atlas4). Furthermore, the stereotactic treatment target in MRgFUS is defined on the AC-PC plane, ¼ of the distance on the AC-PC line from PC between AC and PC more anterior from PC, followed by 14mm lateral from the AC-PC midline. Here we used all three above stereotactic guides to locate the potential VIM target on the SynTI images, where TI’s are adjusted to pick the optimal contrast for visualization. The identified SynTI-based VIM location is compared to the 24hr lesion center of mass and distance measured for VIM confirmation.
Results
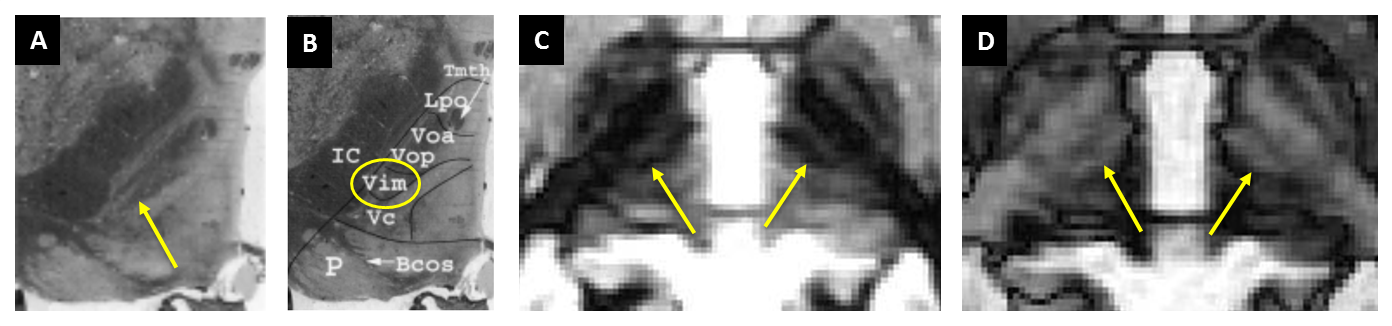
Figure 1 shows the location of the VIM nucleus (yellow arrow) as described by Mercardo et al.5 with the Hassler nonfiction2 on Luxol Fast Blue (LFB) staining (A, B) and two SynTI’s (C, D) from a representative patient. The black strip parallel to IC in SynTI 480ms image (C) clearly mimic the black strip on histology image, and included the VIM nucleus at the posterior end (B). Alternatively the SynTI 620ms image shows the strip as bright with dark edge marking, which is also helpful in identifying boundary of the VIM nucleus.
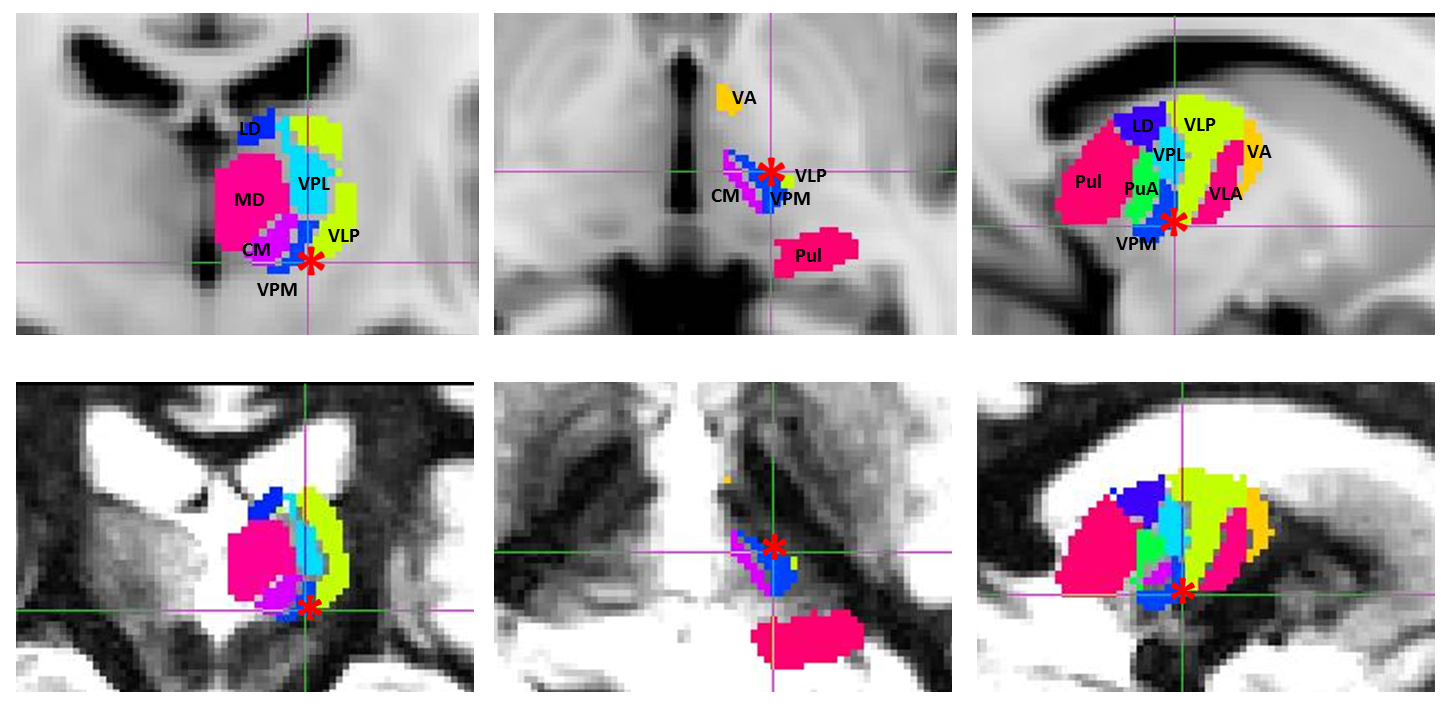
Figure 2 shows the Morel atlas defined thalamic segments overlayed on MNI T1 image (top row) and on a patient SynTI 480ms image (bottom row). Red star indicate the VIM stereotactic treatment target, which co-localized at the ventral and posterior part of the VLp nuclei, as well as the posterior end of the black strip as identified in Figure 1.
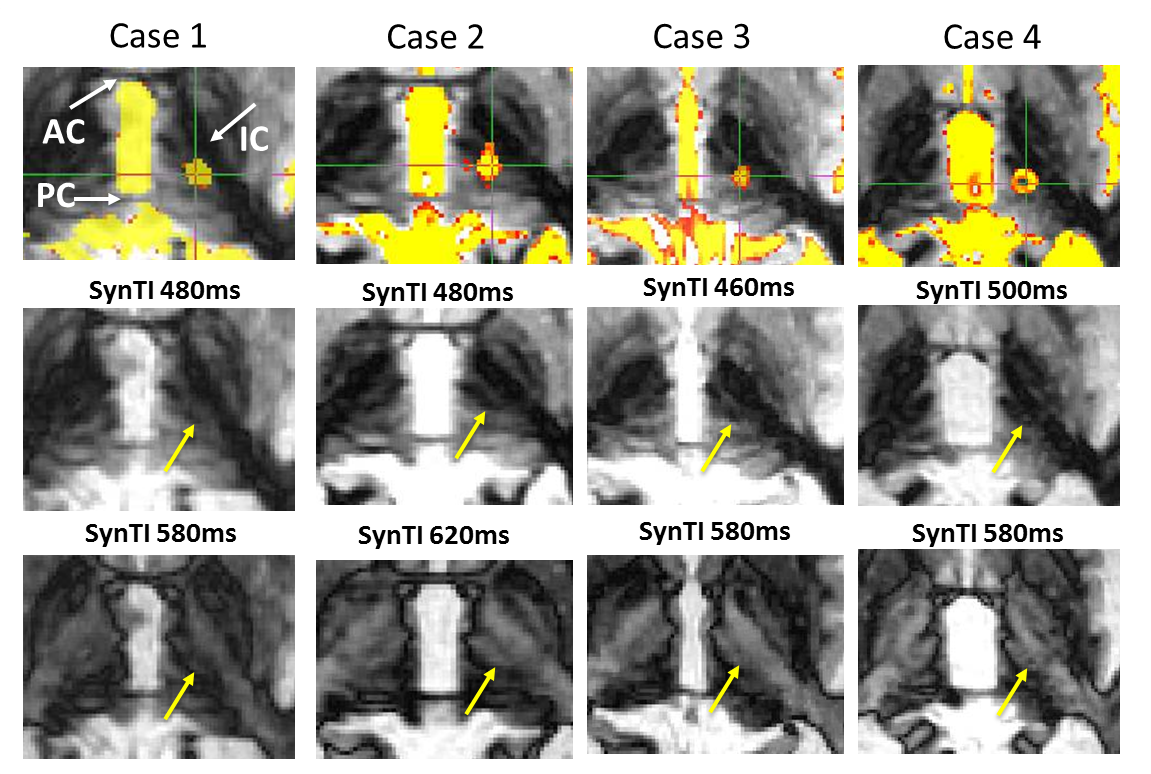
Figure 3 shows the identified SynTI-VIM location for the four ET patients (yellow arrow) on the axial slice at the AC-PC level on two SynTI images. Due to the individual anatomy difference, the final treatment location ranges from -1.21 to +0.037mm in the L/R direction, and -1.36 to +1.86mm in the A/P direction compared to the stereotactic VIM target among patients. When comparing the SynTI-VIM location with the center of mass of the T2 lesion, the SynTI-VIM located at a distance of 1.45mm±0.41mm (<2mm along RL, <1mm along AP direction) from the T2 lesion center.
Discussion
We showed in this study that synthetic MPRAGE images with variable TI’s can be used to identify the VIM in the thalamus. Comparison to the T2 lesion from successful MRgFUS treatment of essential tremor, where VIM is targeted, indicate that there is very good correspondence of the identified VIM to the targeted VIM location. Future study will include more cases to confirm the validity of the method.Acknowledgements
We thank Dr. Morel for providing us with the thalamus atlas.References
[1] Elias WJ, Lipsman N, Ondo WG et al., A Randomized Trial of Focused Ultrasound Thalamotomy for Essential Tremor. N Engl J Med. 2016 Aug 25;375(8):730-9.
[2] Hassler RG, Mundinger F, Riechert T: Stereotaxis in Parkinson Syndrome: Clinical-anatomical Contributions to its Pathophysiology. Berlin: Springer-Verlag, 1979
[3] Hirai T, Jones EG, A new parcellation of the human thalamus on the basis of histochemical staining. Brain Res Brain Res Rev 14: 1–34, 1989
[4] Morel A, Magnin M, Jeanmonod D. Multiarchitectonic and Stereotactic Atlas of the Human Thalamus. J. Comp. Neurol. 387:588–630, 1997
[5] Mercado R, Mandat T, Moore GR, Li D, MacKay A, Honey CR. Three-tesla magnetic resonance imaging of the ventrolateral thalamus: a correlative anatomical description. J Neurosurg. 2006 Aug;105(2):279-83.
Figures