5424
A Methodology for Deriving Thermal Dose Model Parameters from Perioperative MR Data1Imaging Physics, MD Anderson Cancer Center, Houston, TX, United States, 2The University of Texas Graduate School of Biomedical Sciences at Houston, Houston, TX, United States, 3Neurosurgery, MD Anderson Cancer Center, Houston, TX, United States
Synopsis
Real-time damage estimates provided by Magnetic Resonance Temperature Imaging (MRTI) and appropriate thermal dose models can provide crucial feedback during of thermal ablation procedures. However, these models are not tailored to the post-treatment radiological endpoints that are used to verify the extent of the thermal lesion after therapy. A technique is developed to allow estimation of thermal dose model parameters through retrospective analysis of MRTI and post-treatment imaging. The feasibility of this technique is investigated in a protein coagulation phantom and clinical ablation data.
Introduction
The combination Magnetic Resonance Temperature Imaging (MRTI) and thermal dose modeling represents a powerful technique for monitoring thermal ablation therapies. This real-time feedback can be used to make periprocedural adjustments that maximize target coverage while preserving surrounding normal tissue. However, current clinically utilized dose models rely on parameters that are only surrogates of the radiologic endpoints that are used for post-treatment verification of the thermal lesion. In this work we investigate a methodology for deriving novel thermal dose model parameter values directly from MRTI and post-treatment imaging. The feasibility of this technique is evaluated in a protein coagulation phantom and using retrospective clinical data from MR-guided laser ablation procedures.Methods
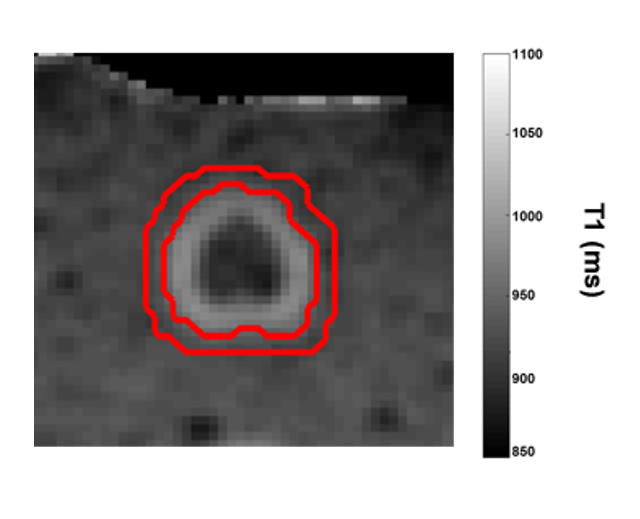
A protein coagulation phantom was created using 1:1 mixture of egg white and distilled water combined with 1.5% agarose. Thermal lesions (N=6) were created using a water-cooled diffusing laser fiber (980nm; 7-15W; 3-13 minutes) while MRTI was acquired using a multi-echo spoiled gradient echo technique.1 The region of post-treatment T1 change was segmented and found to reflect the region of visual coagulation (maximum deviation = 1 mm). A second region was created by dilating the region of altered T1 using a 5x5 kernel. (Figure 1)
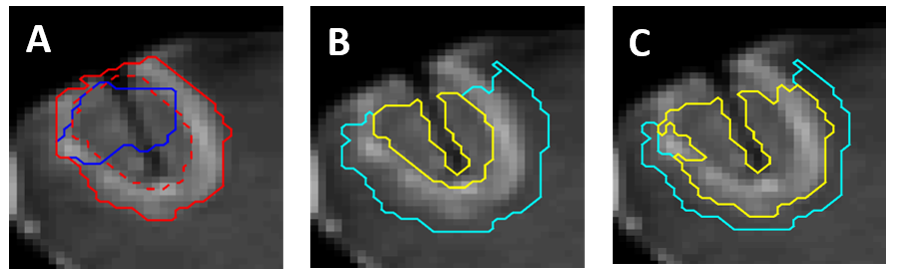
Perioperative MRI was retrospectively evaluated for 5 brain metastases treated using MR-guided laser ablation. The area defined by the central nonenhancing region and characteristic enhancing ring on post-treatment subtraction imaging were segmented manually and resampled into the plane of MRTI. A third region was defined by dilating the enhancing ring using a 5x5 kernel. (Figure 2)
The previously defined regions were used to assign binary classification to each voxel. These classifications were used in a coupled model that combines the Arrhenius model of thermal dose with a logistic model that accounts for the categorical nature of appearance of the thermal lesion. The Arrhenius model is given by:
$$-log(FC)=A\int_{0}^{\tau}e^{{-E_a}/{RT(t)}}dt$$
Where FC is the fractional conversion, which can be interpreted as the fraction of a sample in a given voxel that has been converted to a denatured state, Ea is the activation energy (kJ/mol), A is the frequency factor (s-1), T(t) is the temperature history, R is the universal gas constant, and t is time (s). The fractional conversion is used as the dependent variable in the logistic model to classify each voxel. Nonlinear optimization was used to solve for the maximum likelihood Arrhenius parameters, Ea and A, for this coupled model using the classified regions to predict the boundary between each region. (Figures 1 & 2)
For each boundary model the region predicted by the optimized dose model parameters was compared to the relevant segmentation using the Dice Similarity Coefficient (DSC)2 and Mean Distance to Agreement (MDA)3. For the patient models the model predicted regions were also compared to two clinically used dose models, the Henriques4,5 and Cumulative Effective Minutes (CEM)6,7 models.
Results
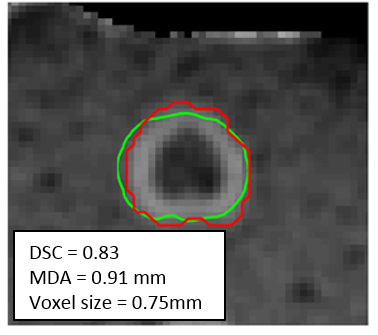
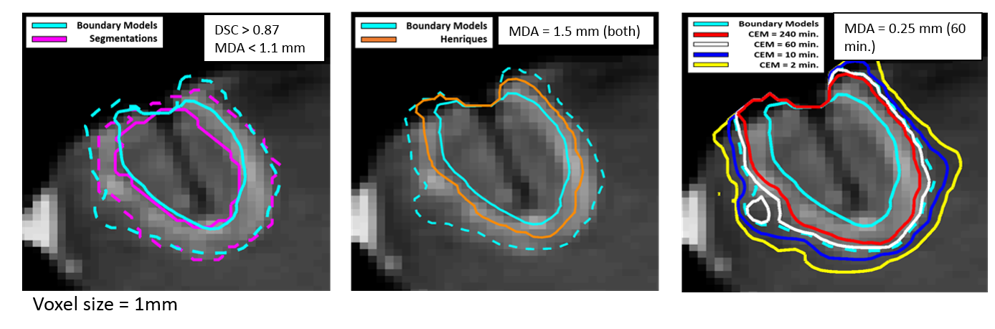
The optimal Arrhenius parameters for the protein coagulation phantom were Ea=405 kJ/mol and A=4.7x1061 s-1 and the average DSC and MDA values between the model predicted regions and segmentation were 0.83 and 0.91mm, respectively (voxel size 0.75mm; Figure 3) For the patient data the Arrhenius parameters were Ea=162 kJ/mol, A= 1.0x10²³ s-1, and 445 kJ/mol, A= 8.3x1069 s-1 for the inner and outer boundary, respectively. The average DSC and MDA between the model predicted region and segmentations were 0.87/0.94 mm and 0.89/ 1.1 mm for the inner and outer boundary models, respectively. (voxel size 1 mm; Figure 4). When compared to the clinically used dose models, the Henriques model fell between the inner and outer boundary models on (MDA=1.5 mm from each boundary) and the CEM model using a 60 minute threshold was indistinguishable from the outer boundary model (MDA=0.25 mm).Discussion
A unique solution was found for each boundary model that is consistent with the range of values observed in the literature8. Excellent agreement was observed between the model predicted regions and the segmented regions with DSC values exceeding 0.80 and MDA on the order of a pixel size. On average, the Henriques model predicts a region in-between the inner and outer boundary while the 60 minute CEM threshold is consistent with the outer boundary model in the patient data.Conclusion
In this work we’ve demonstrated a technique for deriving thermal dose models directly from MRTI and post-treatment imaging data. The feasibility of this technique was established in a controlled phantom and in clinical data. This represents an opportunity to derive models that are specific to clinically relevant endpoints and makes clinical data available for continued investigation of thermal dose model parameters.Acknowledgements
Part of the research was conducted at the Center for Advanced Biomedical Imaging at The University of Texas MD Anderson Cancer Center with equipment support from GE HealthcareReferences
1 Taylor BA, Hwang KP, Elliott AM, et al. Dynamic chemical shift imaging for image-guided thermal therapy: Analysis of feasibility and potential. Med Phys, 2008; 35(793).
2 Dice L, Measures of the Amount of Ecologic Association Between Species, Ecology,1945; 26(3):297-302.
3 Shapiro, Michael D., and Matthew B. Blaschko. "On Hausdorff Distance Measures." Computer Vision Laboratory University of Massachusetts Amherst, MA 1003 (2004).
4 Henriques FC, Studies of thermal injury; the predictability and the significance of thermally induced rate processes leading to irreversible epidermal injury. Arch. Path. 1947 43(5):489-502
5 McNichols RJ, Gowda A, Kangasniemi M, MR Thermometry-Based Feedback Control of Laser Interstitial Thermal Therapy at 980 nm, Lasers Surg. Med. 2004; 34:48-55.
6 Sapareto SA and Dewey WC, Thermal dose determination in cancer therapy, IJORBP. 1984; 10(6)787-800.
7 Sloan AE, Ahluwalia MS, Valerio-Pascua J, Results of the NeuroBlate System first-in-humans Phase I clinical trial for recurrent glioblastoma, J Neurosurg. 2013; 118(6) 1202-1219.
8 He X. and Bischof JC, Quantification of Temperature and Injury Response in Thermal Therapy and Cryosurgery, Crit. Rev. Biomed. Eng. 2003; 31(5-6) 355-422.
Figures