5422
Effect of the transceive phase on MR thermometry in aqueous mediums1Radiology dept., Erasmus Medical Center, Rotterdam, Netherlands, 2Radiation Oncology dept., Erasmus Medical Center, Rotterdam, Netherlands, 3Biomedical Imaging Group Rotterdam (BIGR), Erasmus Medical Center, Rotterdam, Netherlands
Synopsis
In this work we illustrate the effect of changes in the transceive phase on the quality of MR thermometry in acqueous medium.
Introduction
Magnetic resonance thermometry (MRT) by proton resonance frequency shifts (PRFS) has an increasing role in monitoring thermal therapy because of its many advantages over other MRT techniques1,2. It has been widely reported that its accuracy is sensitive to non-thermally-induced changes in the static magnetic field3,4 (B0). However, only few publications5 referred to the heterogeneities in the transceive phase arg(B1+B1-) as a source of errors in MRT. In this work, we present a brief in-vitro investigation of this effect, and we show that, if left unaccounted for, it can cause significant MRT errors in aqueous mediums.Methods
In an MR imaging experiment, the transceive phase manifests as the phase at zero echo time6, ϕ0. It represents the initial phase of the spins right after the radio frequency (RF) excitation pulse. Since MRT by PRFS is sensitive to the phase accumulation between two time instances (t0 and t1), any difference in the initial phase (ϕ0) between t0 and t1 will result in an erroneous temperature difference. These errors cannot be accounted for by any B0 correction scheme because they originate from shifts in the induced B1 field.
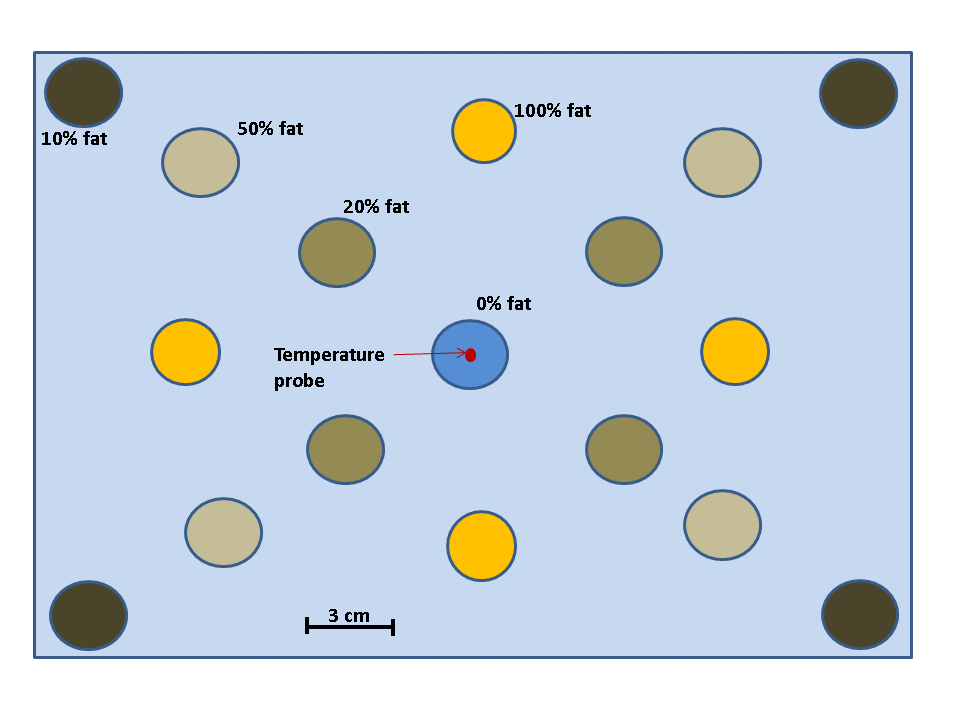
In theory, the phase retardation of an RF wave propagating in an electrically conductive material (e.g. water) changes with conductivity5. On the other hand, the conductivity of a material changes with temperature5. In consequence, and from an MR imaging perspective, the phase of the transmitted/received RF wave can be altered between t0 and t1 if the conductivity (or temperature) between these time instances was altered. This phenomenon is particularly observed in fluids subject to a convective heat transfer. In fact, when exposed to a thermal gradient, large quantity of colder fluid molecules move to be replaced by warmer molecules. This bulk fluid flow can disturb the transceive phase by creating a random spatial distribution of conductivity that changes between t0 and t1. To further investigate this, we build a phantom (Figure 1) with vials containing rigid emulsions with different fat/water ratio (100%, 50% 20%, 10%) evenly distributed around a central vial of 100% rigid water7. Only vials of 100% fat and 100% water are relevant for the experiment reported here. All vials were inserted in a Styrofoam box, submerged in warm water at 43°C and left for 80 minutes to cool down till 36°C during the experiment. Every 8 minutes, multi-echo gradient echo (ME-GRE) images were acquired with a GE-Optima 1.5T MRI scanner, TR=300ms, TE=3.0, 5.9, 8.9, 11.8, 14.8, 17.7, 20.7, 23.6 and 26.5ms, FA=29°, BWr=62.50kHz, 256x256, FOV=50x50cm, slice thickness=0.5cm.
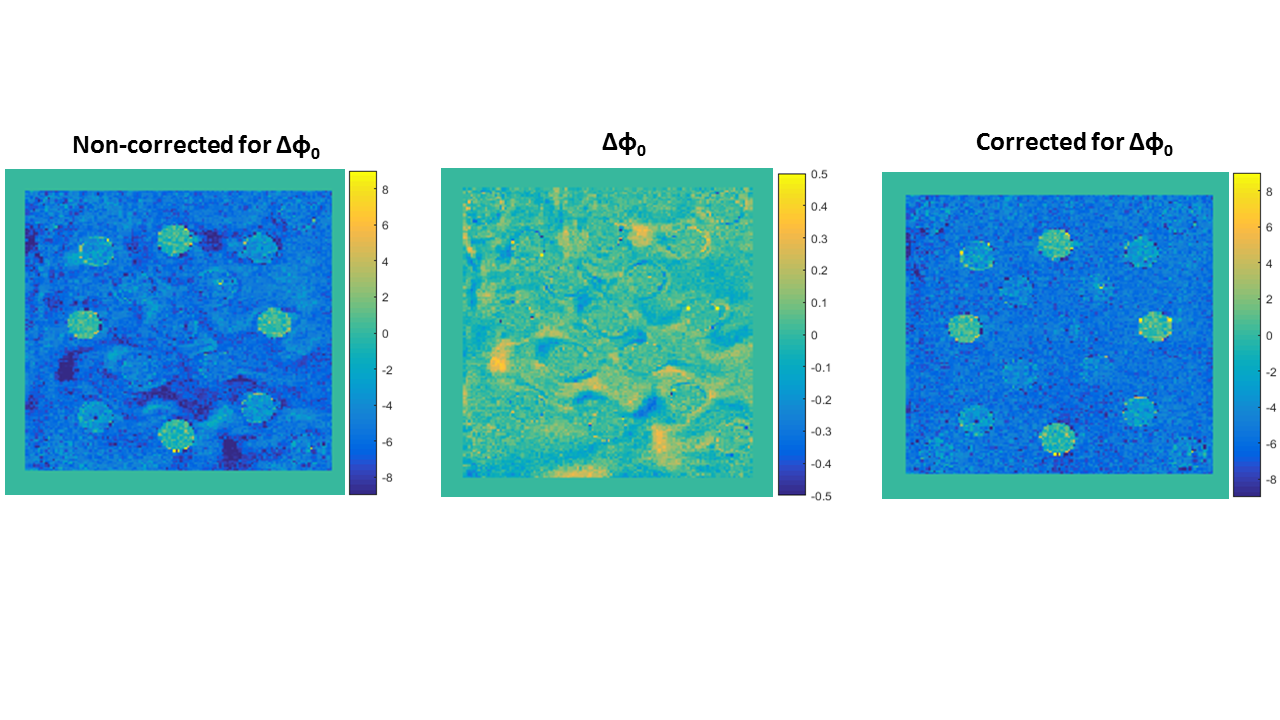
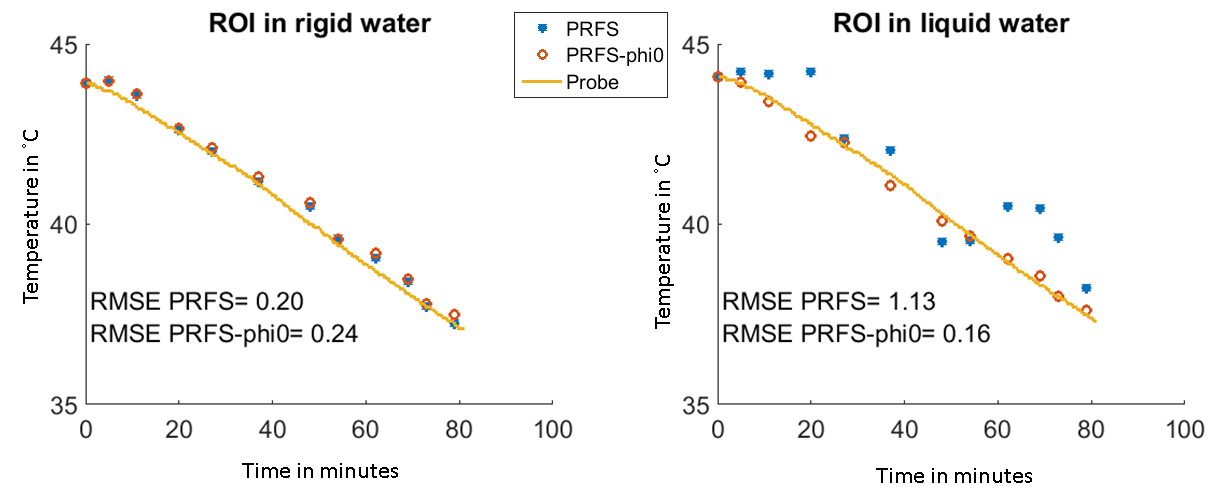
The data were fed into a maximum likelihood estimator8 to derive ϕ0 maps for all time instances based on a multi-peak fat-water model9. A calibrated thermal probe was used for ground-truth temperature measurements. Temperature maps by PRFS1 were derived using TE=23.6ms, and were corrected for errors caused by B0 shifts with a 1st order B0 correction scheme that was derived from fat voxels3. Next, the temperature maps were corrected for errors caused by heterogeneities in the transceive phase by simply subtracting Δϕ0= ϕ0(t0) - ϕ0(t1) from the phase accumulated during the echo time TE. For comparison, we selected two ROIs of 5x5 voxels, one in the liquid water surrounding the vials in the vicinity of a second ROI in the vial of 100% rigid water.
The mean temperature changes inside the ROIs were determined and compared to the probe measurements. Furthermore, the inaccuracies of MRT by PRFS with and without accounting for Δϕ0 were evaluated by the root mean square error (RMSE) between MRT and probes measurements.
Results
Figure 2 illustrates the temperature maps without and with Δϕ0 correction. One can clearly see that the heterogeneity pattern of the temperature maps matches the heterogeneity pattern in Δϕ0 map, further proving that the differences in ϕ0 is the origin of apparent temperature changes in water. The temperature graphs in Figure 3 show no effect of Δϕ0 in rigid water, simply because Δϕ0 in this region is null. Whereas in the liquid water the changes in ϕ0 caused a temperature error of ±1˚C.Conclusion
In this study, we showed that changes in the transceive phase should be accounted for in an MRT experiment in aqueous mediums (e.g. CSF, eye balls, and bladder) subject to convective heat transfer during hyperthermia.Acknowledgements
The authors would like to acknowledge the Dutch Cancer Society grant EMCR 2012-5472 for supporting this research.References
1. J.Yuan, C.S.Mei, L.P.Panych, et al. Towards fast and accurate temperature mapping with proton resonance frequency-based MR thermometry, Quant Imaging Med Surg 2012; 2:21-32
2. V.Rieke, K.B.Pauly, MR Thermometry, J Magn Reson Imaging 2008 February; 27(2): 376–390 3. A.El-Sharkawy, M.Schär, P.A.Bottomley et al. Monitoring and correcting spatio-temporal variations of the MR scanner’s static magnetic field, Magn Reson Mater Phy (2006) 19: 223–236
4. C.Wyatt, B.Soher, P.Maccarini, et al. Hyperthermia MRI temperature measurement: Evaluation of measurement stabilisation strategies for extremity and breast tumours, Int. J. Hyperthermia, September 2009; 25(6): 422–433
5. R.D.Peters and R.M. Henkelman Proton-Resonance Frequency Shift MR Thermometry Is Affected by Changes in the Electrical Conductivity of Tissue, Magn Reson Med 43:62–71, 2000
6. A.L.H.M.W. van Lier, D.O.Brunner, K.P.Pruessmann, B1+ Phase Mapping at 7T and its Application for In Vivo Electrical Conductivity Mapping, Magnetic Resonance in Medicine 67:552–561 (2012)
7. E.L.Madsen, G.R.Frank, T.A.Krouskop et al. Tissue-Mimicking Oil-in-Gelatin Dispersions for Use in Heterogeneous Elastography Phantoms, ULTRASONIC IMAGING 25, 17- 38 (2003)
8. D.H.J. Poot and S. Klein, Detecting statistically significant differences in quantitative MRI experiments, applied to diffusion tensor imaging, IEEE Trans. Med. Imaging, 2015; 34:5(1164-1176)
9. G.Salim, D.H.J.Poot, W.C.M.Numan et al. Multipeak multiecho modeling for improved PRF-based thermometry, ESMRMB 2015
Figures