5420
Field drift-correction of PRFS temperature mapping using interleaved non selective free induction decay (FID) readouts1UMC Utrecht, Utrecht, Netherlands
Synopsis
During long hyperthermia procedures guided by MR thermometry, drift of the main magnetic field leads to systematic errors in PRFS measurements, compromising the required temperature monitoring. In this study we evaluated if interleaving acquisition of PRFS MRT with non-selective FID readouts using conventional receive coil elements allows for correcting the drift effects in PRFS thermometry. Automated field drift correction using interleaved non-selective FIDs allowed maintaining a precision and accuracy better than 1°C. This temperature precision would typically be required for controlling a hyperthermia procedure.
Purpose
Proton Resonance Frequency Shift (PRFS) MR Thermometry (MRT) is clinically used for guidance of High Intensity Focused Ultrasound (MR-HIFU) procedures.1 MR-HIFU can be used for controlled mild hyperthermia, using temperature feedback control to create long cycles of mild heating.2 This requires highly accurate and precise temperature mapping, as small temperature variations over longer periods of time may lead to considerable differences in the thermal dose delivered and to subsequent variation in the biological effects 3.
However, during half an hour of scanning, magnetic field drift leads to systematic errors in PRFS measurements in the range of 4 to 15 °C, compromising the hyperthermia control 4 Recently, field probes have been proposed for drift correction of PRFS Thermometry 5,6, but this requires the use of additional hardware. In this study we evaluated if interleaving acquisition of PRFS MRT with non-selective FID readouts using conventional receive coil elements allows for drift-corrected thermometry.
Methods
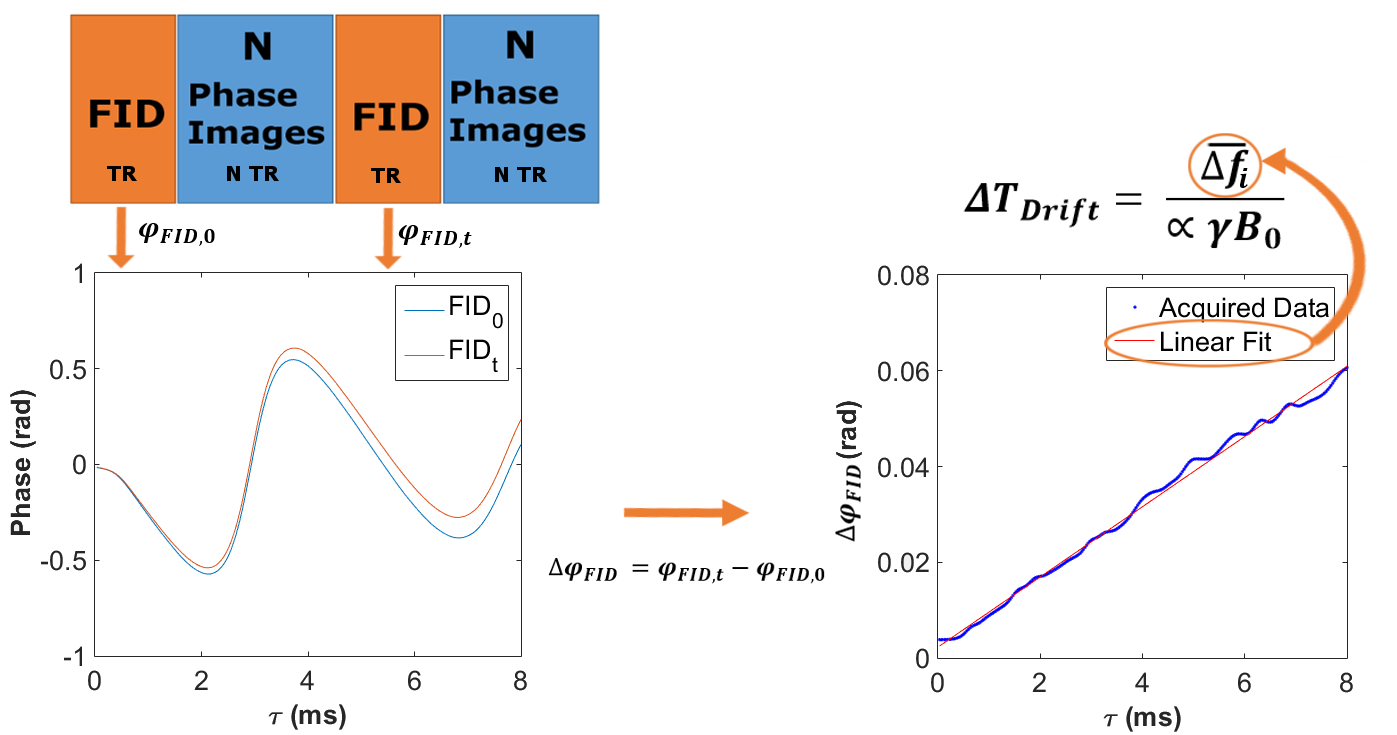
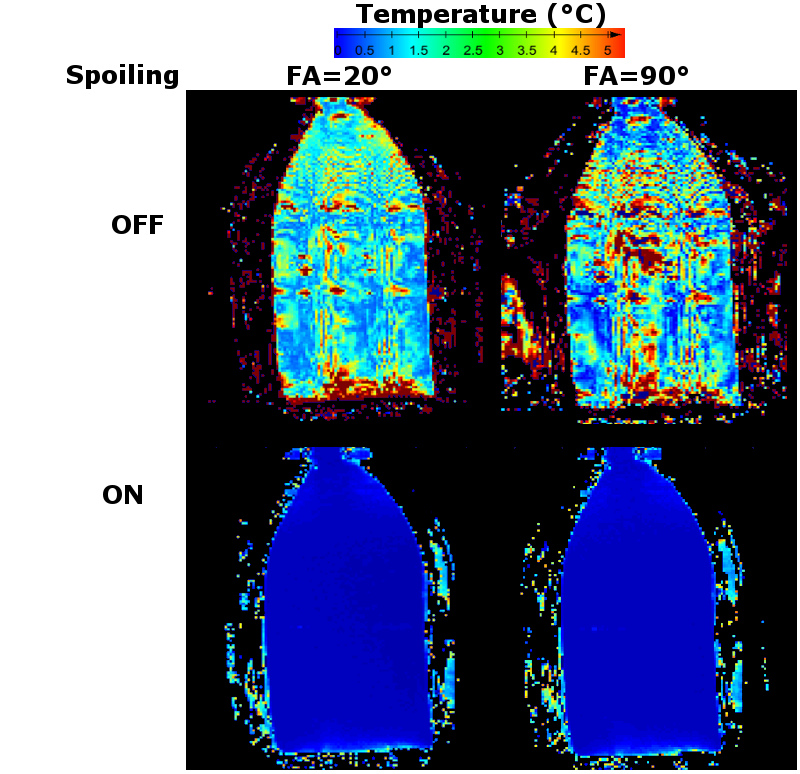
Experiments were performed on a clinical 1.5-T scanner (Achieva, Philips Healthcare, The Netherlands). PRFS MRT was done with a dynamic spoiled gradient echo pulse sequence: TR = 100 ms, TE = 19 ms, FA = 20°, reconstructed voxel size = 2.5x2.5x8 mm3. This sequence was interleaved with the acquisition of an FID after a non-selective excitation. Interleaving was done using automated dynamic alternation without preparation phase reiteration (Fig 1.). To evaluate the interaction of the two sequences, two different interleaving schemes were tested in a phantom: one FID acquired for every phase map or one FID for every ten phase maps. Effects of the flip angle (20° and 90°), and gradient spoiling were also assessed. Other parameters were: TR = 100 ms, readout window [1.4-9.4ms].
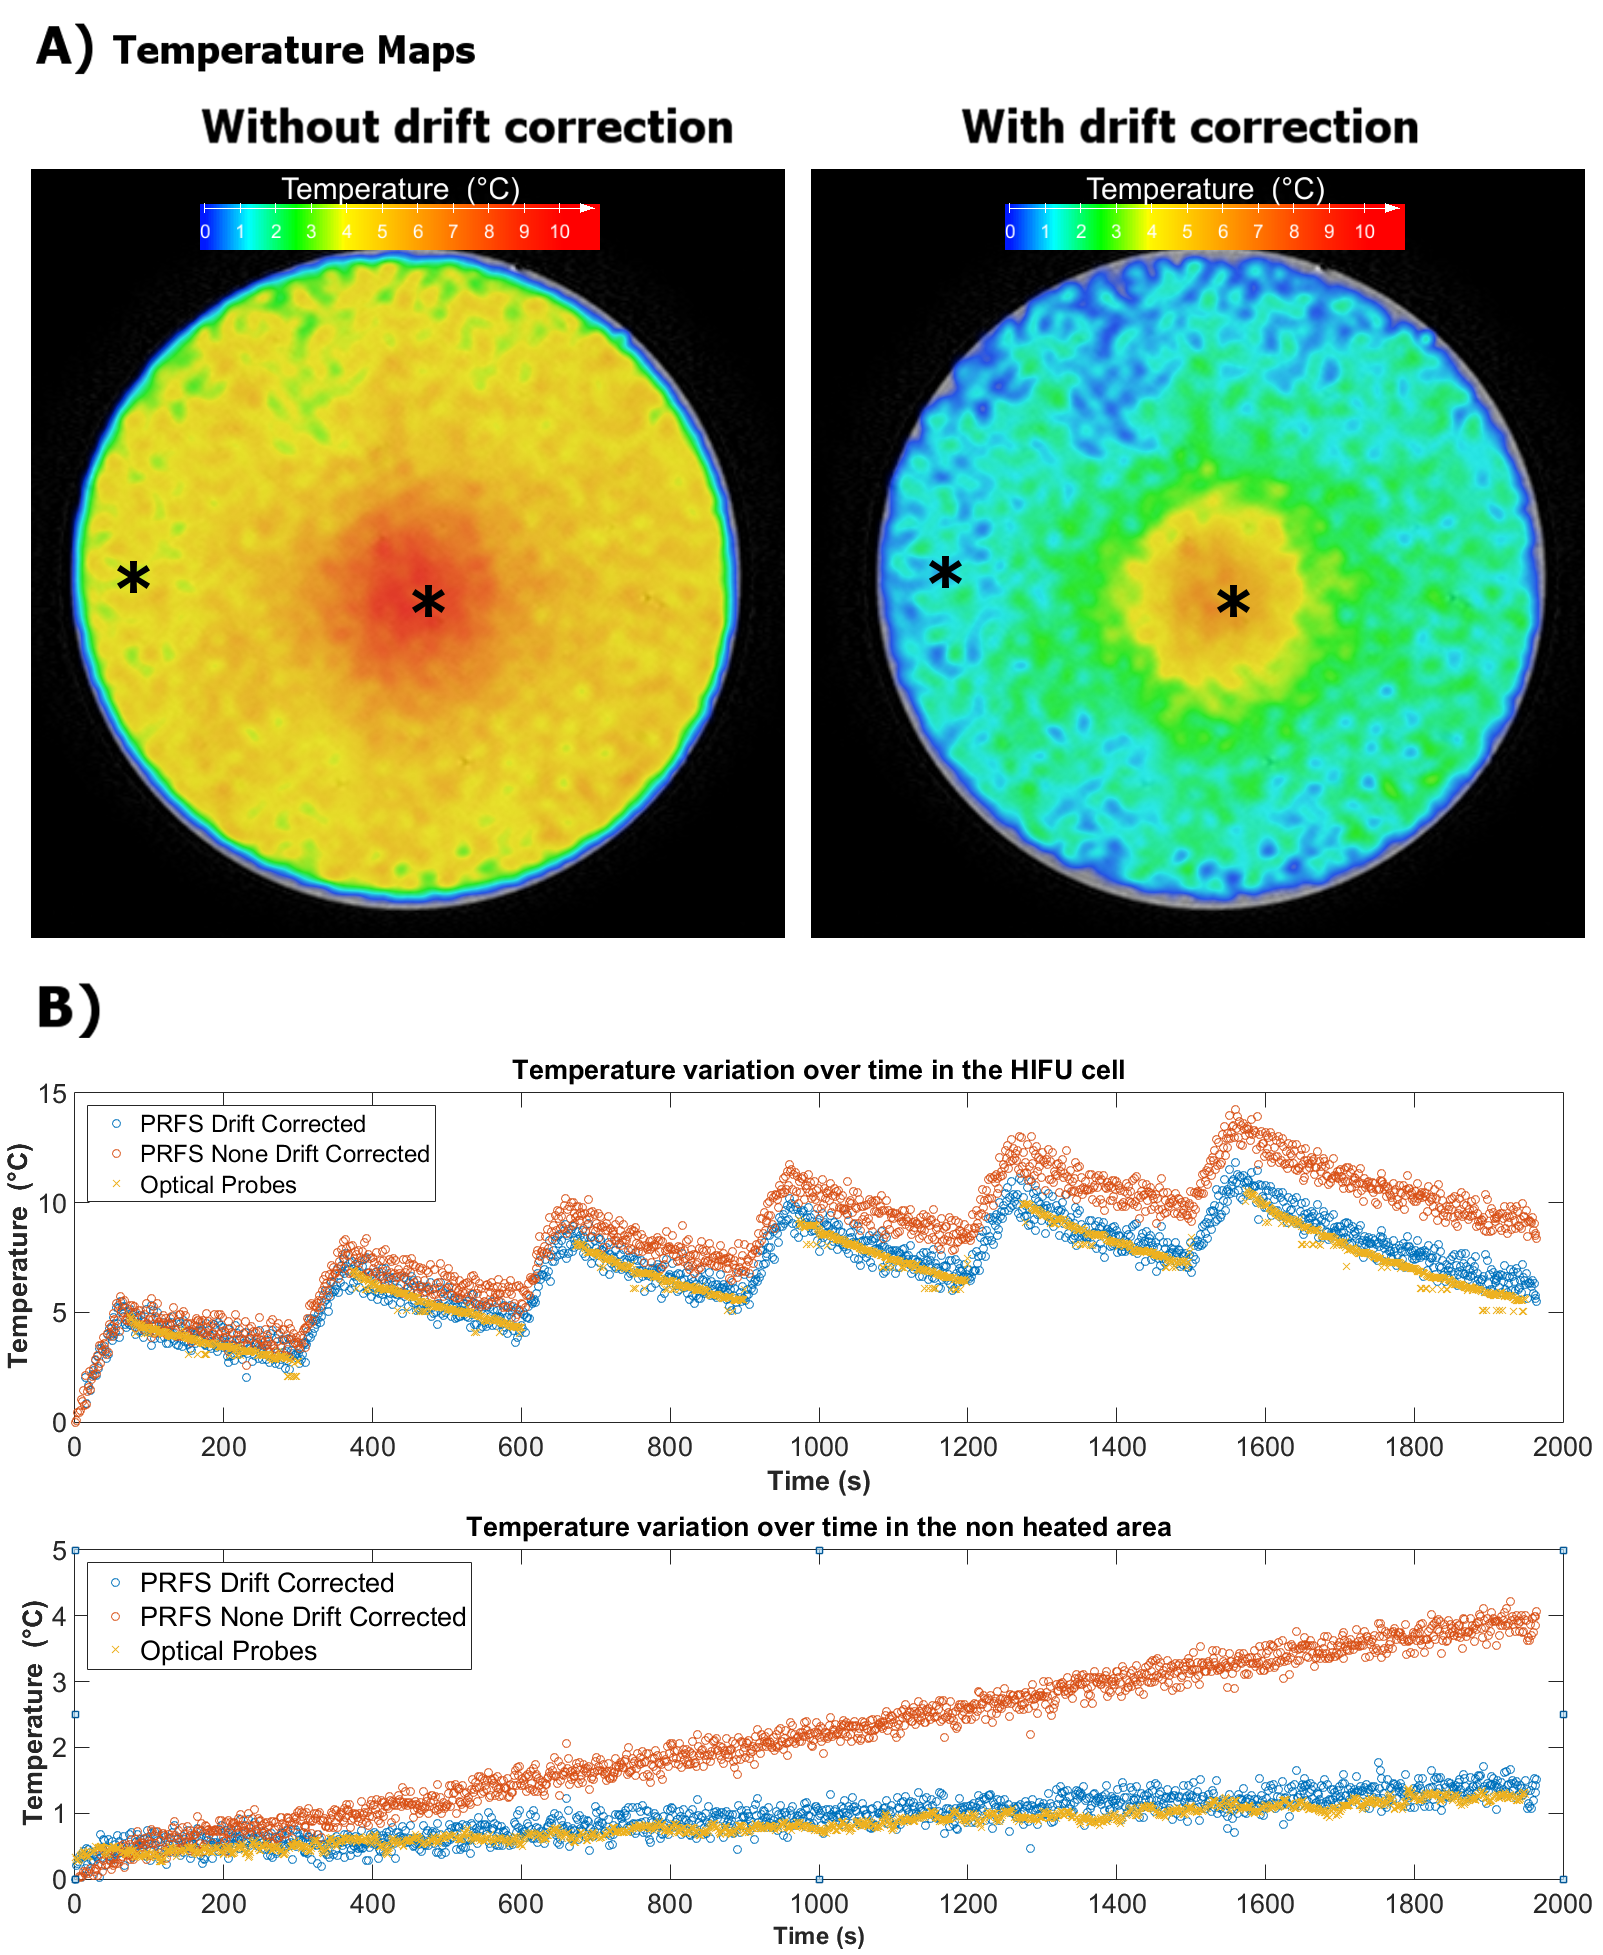
Volunteer experiments: single-slice transverse MRT was done in the upper leg for 15 min, using a 16-element receive coil. Phantom experiment: drift correction during HIFU heating was assessed in an agar/silica gel phantom, with a 40 watts sonication in a 16-mm cell for one minute followed by 4 minutes of cool-down, repeated 6 times. Two optical temperature probes, one at the center of the sonication, one in an unheated area, were used for independent temperature measurements.
Phase images were used to compute non-drift corrected PRFS temperature maps: $$$ \triangle T=\frac{\triangle \phi}{\alpha TE 2 \pi \gamma B_{0}} $$$ α is the temperature coefficient of the shielding constant (-0.01 10-6/°C), B0 the main field in T, the phase difference between incoming phase and reference phase image in rad and γ the 1H gyromagnetic ratio 42.58MHz/T. Drift correction: The phase over the FID was used to estimate the ΔTDrift due to B0 temporal drift (Figure 1 shows details).
Results
Without spoiling, temperature maps suffered from severe ghosting artifacts caused by the full volume FID excitations (Fig. 2). These artifacts were limited to images acquired directly following the FID acquisition when sequences were interleaved 1 in 10 (Data not shown).
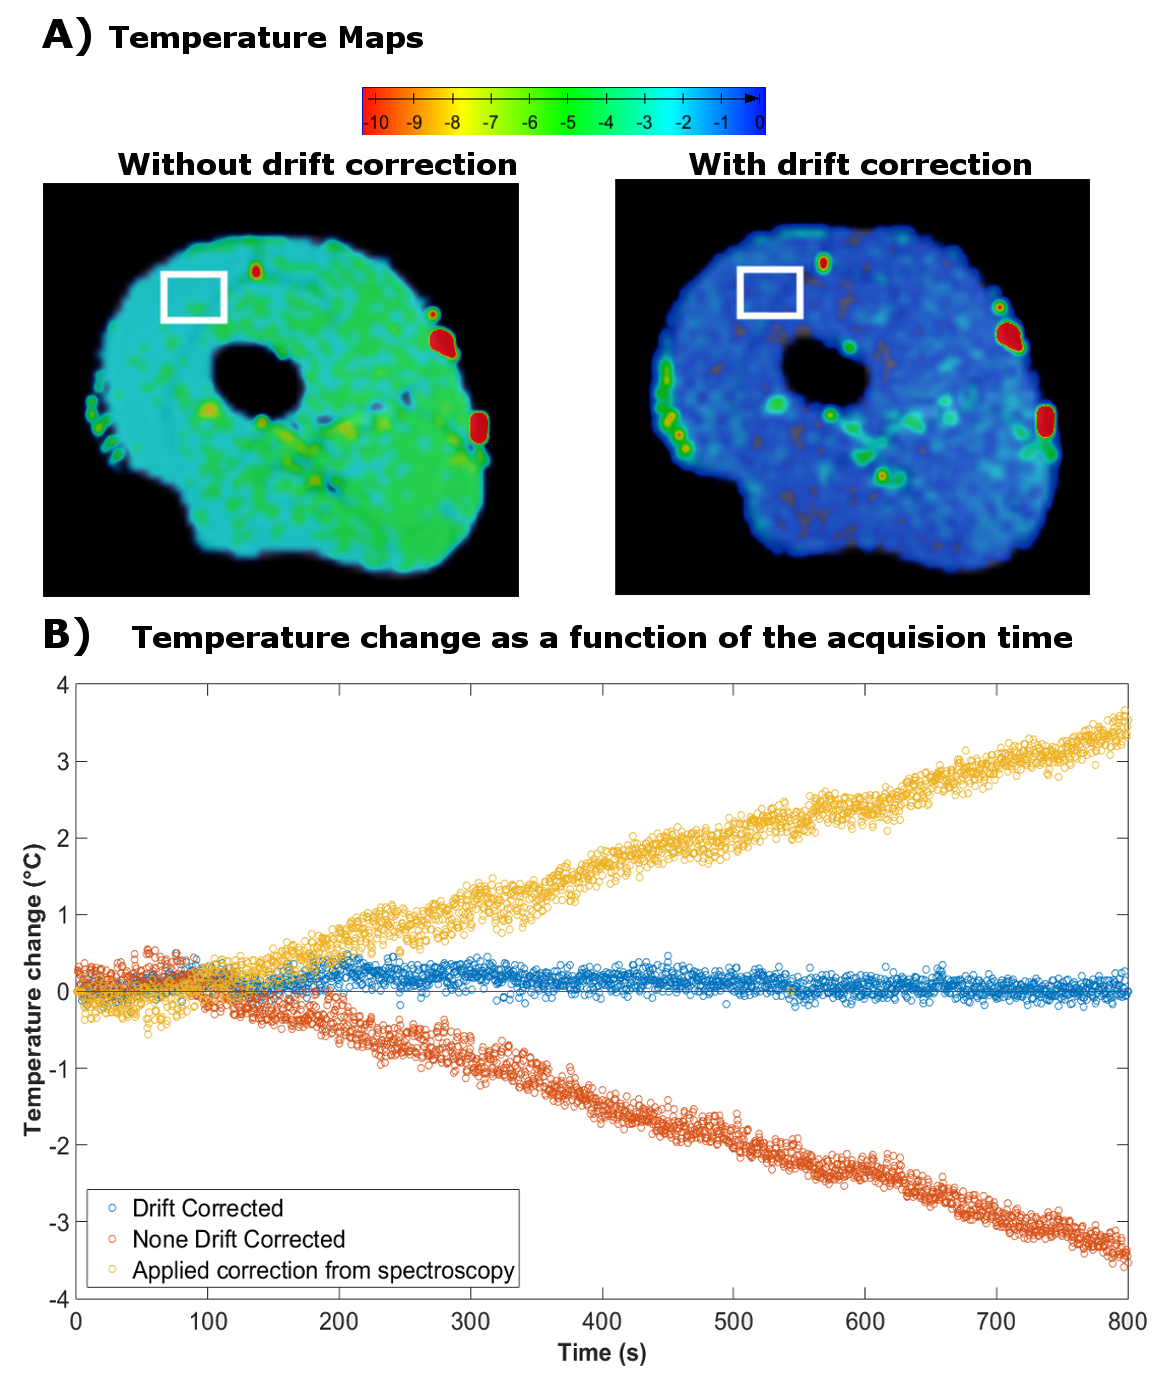
In the volunteer, without correction, after 15 min the temperature map showed an offset in the range of 2 to 5°C (Fig 3A). After correction the observed temperature change did not exceed 1°C. Over time, without correction a linear trend, increasing from 0 to 3.5°C was noticeable (Fig 3B). After correction, measurements were stable with a temporal standard deviation of 0.15°C and a mean of 0.10°C (Fig 3B).
When HIFU heating was applied, there was an overall 4°C difference between the last dynamic of the corrected and uncorrected temperature maps (Fig4A). Over time, in the non-heated area a linear temperature variation of 0 to 4°C was seen (Fig 4B). With correction, a slow variation from 0 to 0.8°C matching the reading from the optical probe remained. Also in the HIFU cell our drift corrected measurements closely matched the optical probe readings, while the uncorrected PRFS deviated by 1°C after the first sonication already, and up to 4°C after the last sonication.
Discussion
Our method allows automated field drift correction with a precision and accuracy better than 1 °C. This temperature precision would in principle allow hyperthermia control7. The presented approach does not require hardware modification nor user input. With a spoiled, TR-matched and flip angle-matched sequence, the FID acquisition takes less than 10ms, does not disturb temperature mapping, and allows for fast processing, which enables inline implementation for real time temperature control.Conclusion
Using standard receive coil elements for phase mapping interleaved with FID acquisitions allows to correct for main field drift in PRFS-based MRT.Acknowledgements
No acknowledgement found.References
1. de Senneville B.D, Mougenot C, et al. MR thermometry for monitoring tumor ablation. Eur Radiol (2007) 17: 2401.
2. Partanen A, et al. Mild hyperthermia with magnetic resonance-guided high-intensity focused ultrasound for applications in drug delivery, International Journal of Hyperthermia, 2012:28:4, 320-336
3. Gasselhuber A, Matthew R, et al. Targeted drug delivery by high intensity focused ultrasound mediated hyperthermia combined with temperature-sensitive liposomes: Computational modelling and preliminary in vivovalidation, International Journal of Hyperthermia, 2012:28:4, 337-348
4. El-Sharkawy AM, Schär M, et al. Monitoring and correcting spatio-temporal variations of the MR scanner's static magnetic field. MAGMA. 2006 Nov;19(5):223-36
5. Boer V. O, van der Velden T, et al. Drift compensation for MR thermometry using independent field probe, ISMRM 2014
6. Hernandez D, Ki Soo Kim, et al. Correction of B0 Drift Effects in Magnetic Resonance Thermometry using Magnetic Field Monitoring Technique, Magn Reson Engineering 2016 Vol.46B(2) 81–89
7. de Senneville B.D, et al. Magnetic resonance temperature imaging, International Journal of Hyperthermia, 2005:21:6, 515-531
Figures