5419
Monitoring Cryoablation using Short Inversion Recovery Ultrashort Echo Time (STIR-UTE) MRI1Radiology, Brigham and Women's Hospital and Harvard Medical School, Boston, MA, United States, 2Siemens Healthcare, Boston, MA, United States
Synopsis
We propose a new technique to delineate the area below the critical temperature in the frozen tissue during cryoablation using STIR UTE MRI. It relies on the temperature-dependency of the T1 in the frozen tissue. We demonstrated the technique in an ex vivo swine kidney sample using a 3T MRI scanner with a STIR PETRA sequence. To create a uniform temperature gradient, the sample was placed
Purpose
Percutaneous cryoablation is a well-established tumor treatment that avoids surgical morbidity and complications [1]. To achieve complete tumor ablation, image-based monitoring is essential. While MRI is a useful tool to monitor the tumor coverage with an ice ball shown as a signal void, conventional MRI sequences (with TE>1ms) cannot confirm tissue necrosis, as the critical temperature to induce cellular death is -10°C to -80°C [2], which is significantly lower than the boundary temperature of the ice ball. To delineate the area below the critical temperature, MRI-based temperature mapping of frozen tissue using ultrashort TE (UTE) imaging was proposed [3-6]. However, clinical application might not be straightforward, especially in regions with physiological motion or cryo-probe-related susceptibility artifacts, as the methods rely on multiple-echo images to obtain R2* values. In this study, we propose an alternative approach to delineate the area below the critical temperature using short inversion recovery (STIR) UTE and demonstrate it in an ex-vivo swine kidney using a STIR PETRA sequence [7].Methods
Theory. The approach relies on studies that showed that tissue T1 is strongly dependent on temperature and Larmor frequency [8]. It was shown that T1 drops sharply as temperature drops below -5 °C (from ~300 to ~90 ms at 1.5T), reaches a minimum at -40 °C, and then gradually grows as temperatures drop further. If the tissue’s T1 at the critical temperature is known, the region below this critical temperature can be delineated with a STIR sequence. In addition, since TE values below 0 °C are <100 ms, STIR must be combined with UTE. The boundary temperature is determined by the effective TI. For STIR UTE with a radial k-space acquisition, such as PETRA, and when a multi-spoke readout is applied after each inversion pulse (to keep the imaging time short), the effective TI is longer than the prescribed TI. Given the spoke’s repetition time TR, the effective TI for the ith spoke after each inversion is:
$$ T_{I Eff} = T_I + T_R \times i \quad (i = 1, 2, …, N), $$
where $$$ N $$$ is the number of spokes per pass. Therefore, the image amplitude (signal at the center of k-space) can be estimated by
$$M_z (T_R, T_1) = \frac{M_{0z}}{N} \times [1 - M_{inv} \sum_{i=1}^{N} \frac{\exp(-\frac{T_{IEffi}}{T_1})}{1+\exp(-\frac{T_{R0}}{T_1})}],$$
where $$$M_{inv}<2$$$, $$$T_{R0}=T_I+ N T_R +T_D$$$ the total time for each pass, and $$$T_D$$$ the delay (equilibration) time allowed after the readout, prior to the following inversion. This contrast produces a broad intensity peak, whose width depends on the longitudinal magnetization recovery that occurs during readout. If the recovery is ~zero, then contrast is primarily determined by the first TI ($$$T_{IEff} \sim T_I$$$ ) .
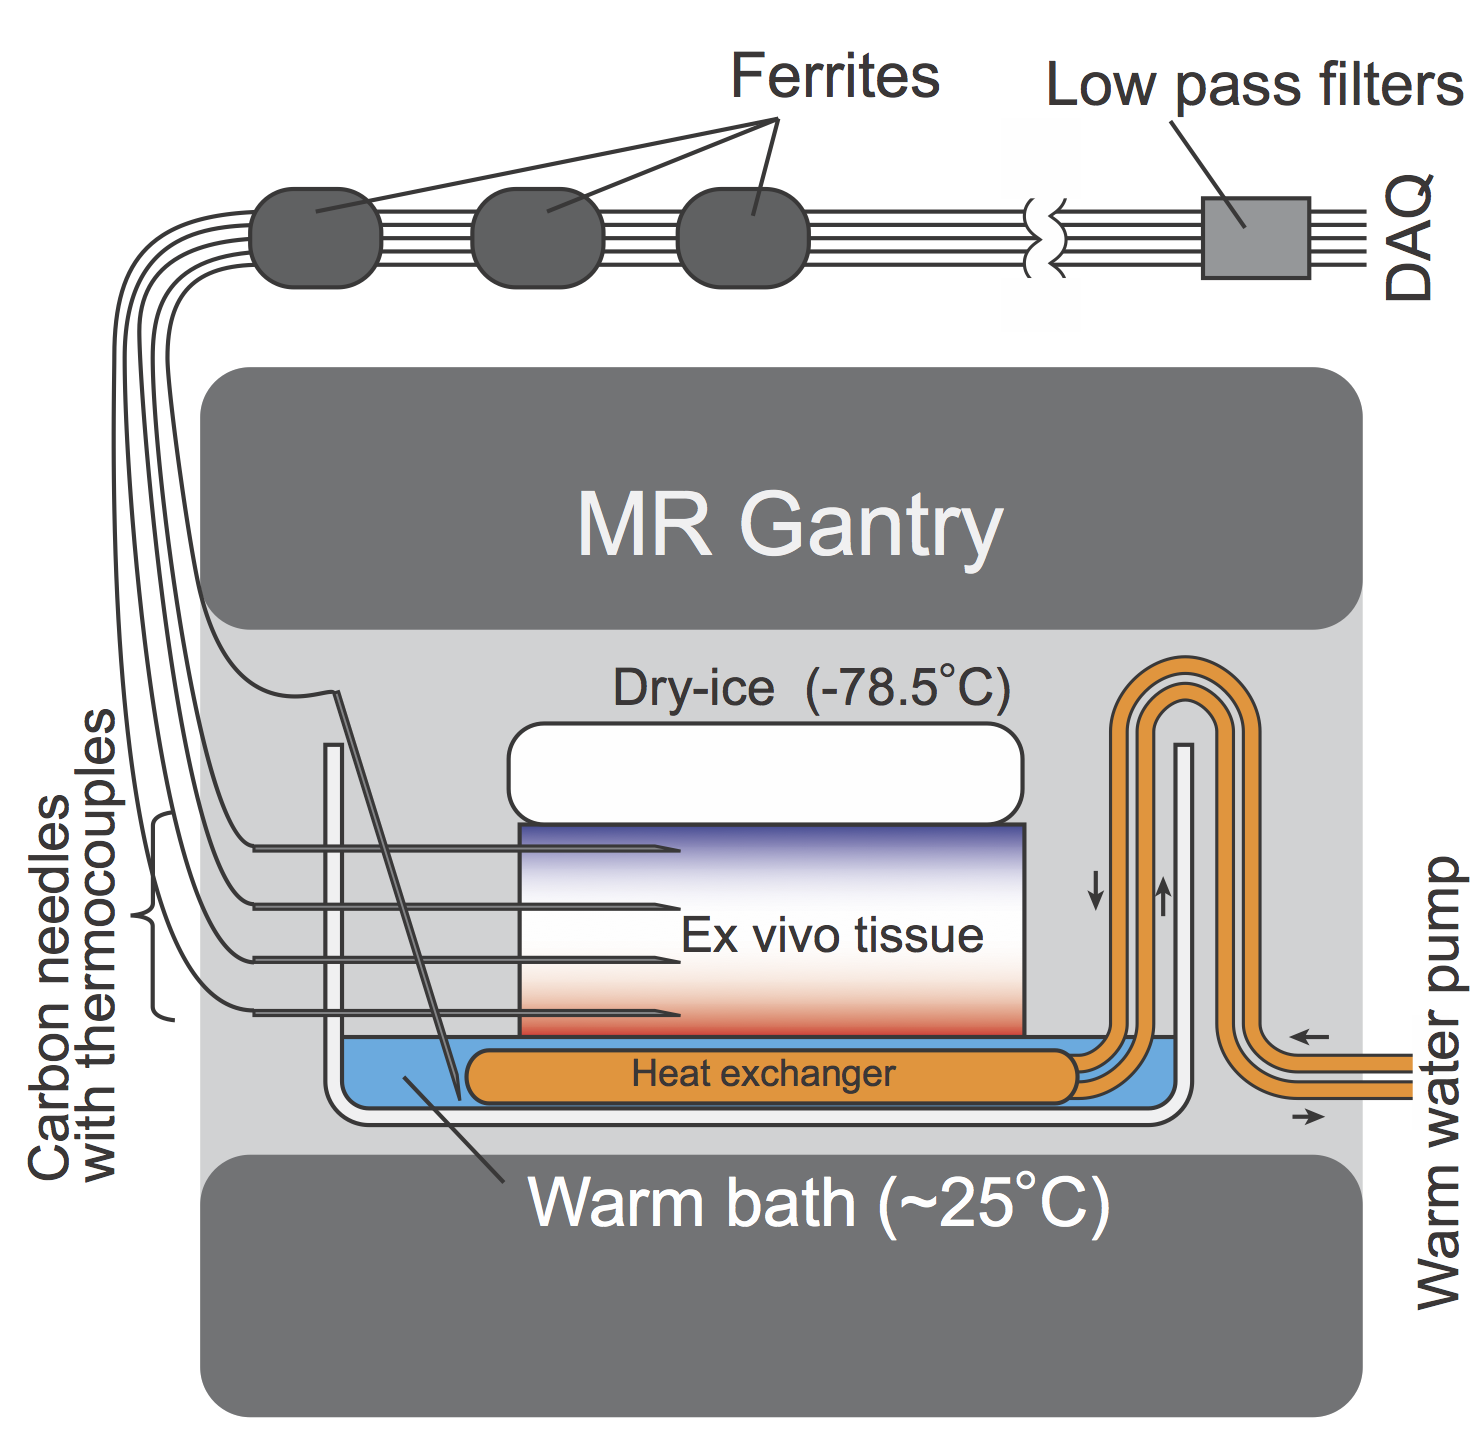
Ex Vivo Experiment. The proposed method was demonstrated in an ex vivo swine kidney in 3T MRI scanner (Verio 3T, Siemens). To create a uniform temperature gradient, the sample was placed below a block of dry-ice (-78.5°C) and above a warm bath (25°C) (Fig. 1). Reference tissue temperatures were measured at four locations using thermocouples embedded inside carbon-fiber needles. The tissue was scanned continuously using STIR PETRA. To further accentuate frozen-region contrast (create an “ice image”), signal from unfrozen (>0°C) tissue was saturated by using a short TI, TR, and TR0 (TI/TR0/TR/TE1/=200/400/2.1/0.07ms; N=40, 15000 spokes, 128×128 ×128, pixel size 2 mm3, FOV=350mm3, TA=80 s/volume). Dual-echo 3D UTE images were also acquired to estimate the temperature distribution based on R2* (TR/TE1/TE2=4.5/0.07/2.0ms; 1 projection/TR, 160×160×160; pixel size=2 mm3; flip angle=8°; FOV=350 mm3; 15000 spokes, TA=120 s/volume). The pixel-wise R2* values were computed by fitting an exponential decay to the first and second echo, and then converted to temperature [9].
Results
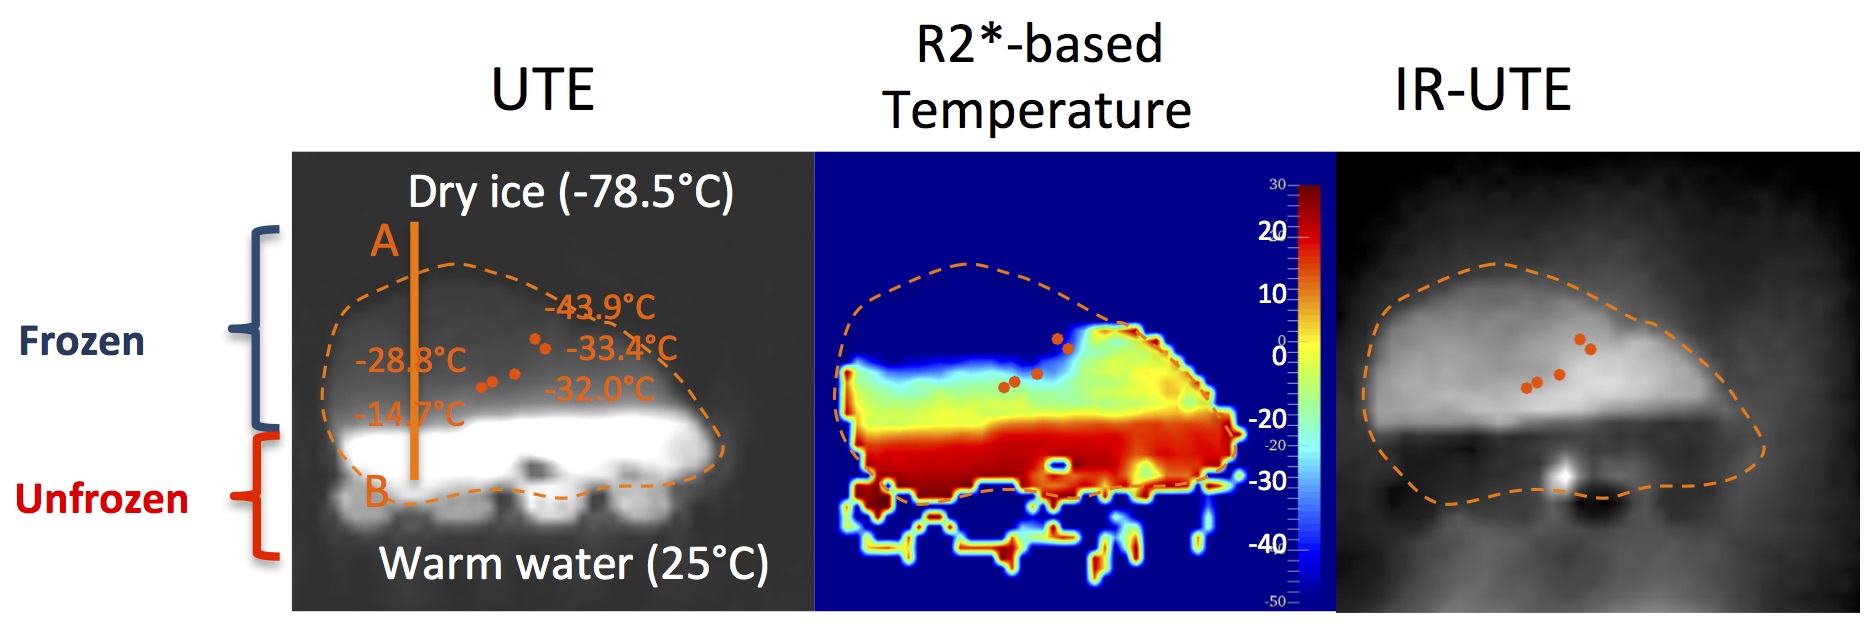
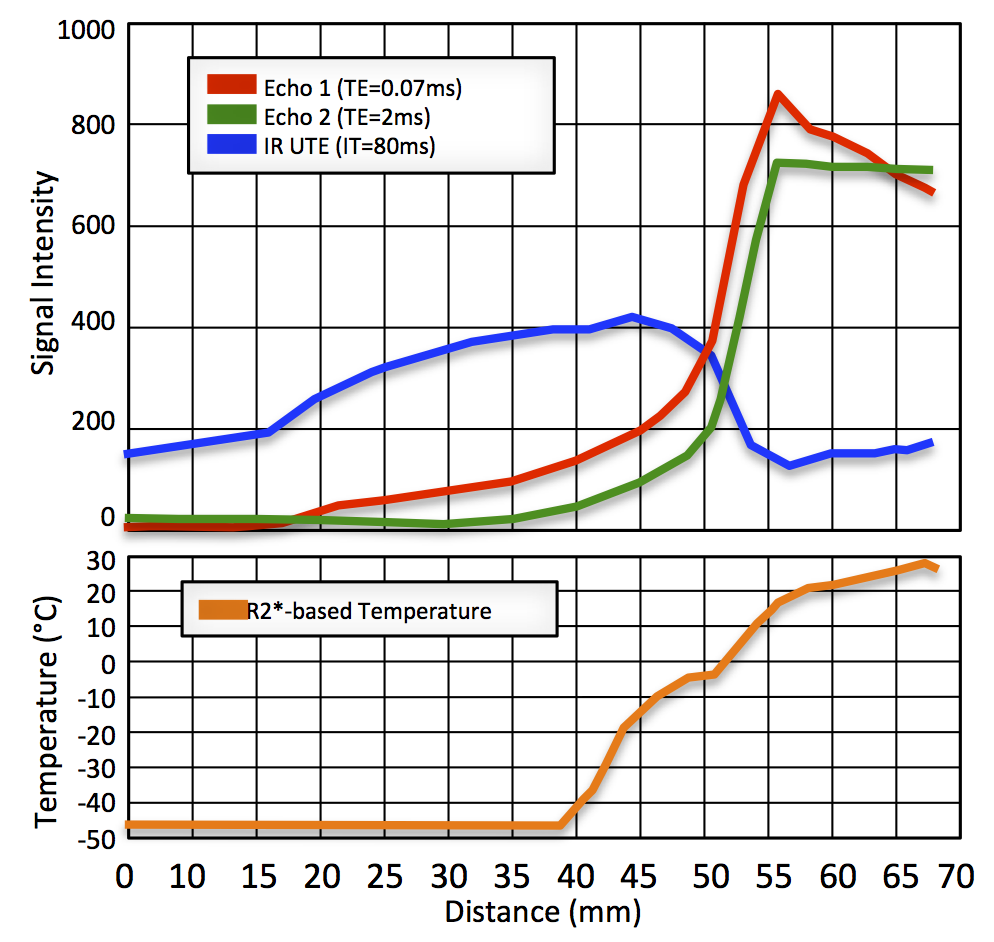
R2* to temperature calibration [9] provided the equation T = -0.0895 × R2*+31.0, where T is temperature in °C (-45°C < T < -5°C). Figure 2 shows a UTE R2*-based temperature map and a STIR UTE image of the same slice after ~2 hours of freezing. Signal profiles of the 1st and 2nd UTE echoes, STIR UTE, and R2*-based temperature map are shown in Figure 3. In the frozen area (<-10 °C), the STIR UTE image demonstrated hyper-intensity, relative to hypo-intensity in the 1st-echo UTE image.Discussion and Conclusion
The study demonstrated that STIR UTE provided positive contrast in the frozen tissue, and potentially provides an alternative approach to MR-based cryoablation monitoring. In this preliminary study, however, we could not delineate the area below the critical temperature (-40°C) with the STIR UTE, because the PETRA sequence did not allow setting TI below 80 ms. Sequence improvement is being performed to further investigate the method’s feasibility.Acknowledgements
NIH P41EB015898References
[1] Kiechle JE, Abouassaly R, Smaldone MC, Shah ND, Dong S, Cherullo EE, et al. National Trends of Local Ablative Therapy among Young Patients with Small Renal Masses in the United States. Urology 2015. DOI: 10.1016/j.urology.2015.08.016.
[2] 1. Hoffmann NE, Bischof JC. The cryobiology of cryosurgical injury. Urology. 2002 Aug;60(2 Suppl 1):40–9.
[3] Daniel BL, Butts K, Block WF. Magnetic resonance imaging of frozen tissues: temperature-dependent MR signal characteristics and relevance for MR monitoring of cryosurgery. Magn Reson Med 1999;41(3):627–30.
[4] Butts K, Sinclair J, Daniel BL, Wansapura J, Pauly JM. Temperature quantitation and mapping of frozen tissue. J Magn Reson Imaging 2001;13(1):99–104.
[5] Wansapura JP, Daniel BL, Vigen KK, Butts K. In vivo MR thermometry of frozen tissue using R2* and signal intensity. Acad Radiol;12(9):1080–4.
[6] Overduin CG, Fütterer JJ, Scheenen TW, 3D MR thermometry of frozen tissue: Feasibility and accuracy during cryoablation at 3T. J Magn Reson Imaging. 2016 May 10. doi: 10.1002/jmri.25301.
[7] Grodzki DM, Jakob PM, Heismann B, Ultrashort echo time imaging using pointwise encoding time reduction with radial acquisition (PETRA)., Magn Reson Med. 2012 Feb;67(2):510-8.
[8] Fung BM, et al., Biochim Biophys Acta 1974; 362:180-187.
[9] Tokuda J., Tuncali K., Kok L., Levesque VM., Seethamraju RT., Tempany CM., Schmidt EJ., Temperature Mapping for Predicting the kill zone in MRI-guided Cryoablation, ISMRM annual meeting 2016, Singapore, Singapore
Figures