5418
Quantitative Evaluation of Thermochemical Ablation Injections in Bovine Liver Phantoms using ²³Na MRI1Medical Physics in Radiology, German Cancer Research Center (DKFZ), Heidelberg, Germany, 2Interventional Radiology, The University of Texas MD Anderson Cancer Center, Houston, TX, United States, 3Institute of Radiology, University Hospital Erlangen, Erlangen, Germany
Synopsis
Thermochemical ablation (TCA), a novel minimally invasive ablation therapy, was quantitatively evaluated using 23Na MRI at 7T. In this study, eight TCA injection experiments were performed using eight ex vivo bovine liver phantoms. Normalization on the reference tubes and B1-correction of the 23Na images were performed to get quantitative values. This improved the maximum relative error of the estimated amount of substance by a factor of 3.6. The total injected amount was accurately determined. This study shows that quantitative 23Na MRI provides detailed information about TCA injections, which is important for computational modelling of the method and cell damage prediction.
Target Audience
Interventionalists interested in ablation therapies, especially thermochemical ablation (TCA) and scientists interested in quantitative 23Na MRI.Purpose
TCA represents a novel concept of minimally invasive ablation therapy in which two liquid reactants, for instance sodium hydroxide and acetic acid solutions, release heat as they react prior to entering tissue as sodium acetate (NaOAc) solution.1,2 The supplied heat causes thermal damage in the circumjacent tissue. Further damage results from the hyperosmolar environment after injection. Recently 23Na MRI was used to monitor TCA injections.3,4 In this study, feasibility of quantitative 23Na MRI of NaOAc distributions was investigated in eight bovine liver phantoms. Quantitative imaging will provide more detailed information about injected volumes advancing the understanding of TCA towards clinical translation.Methods
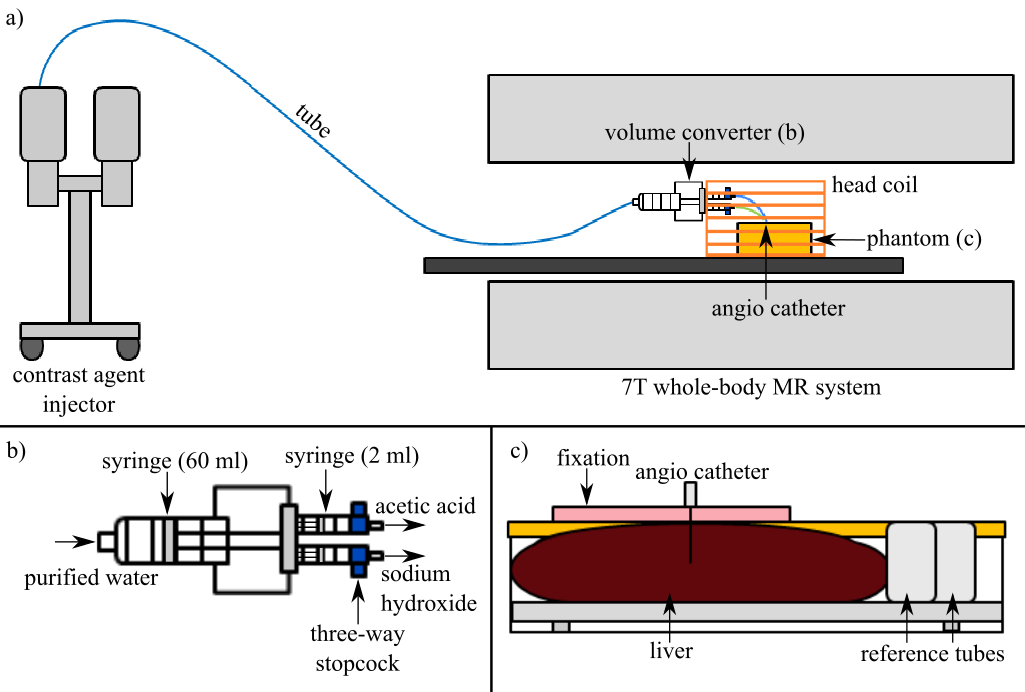
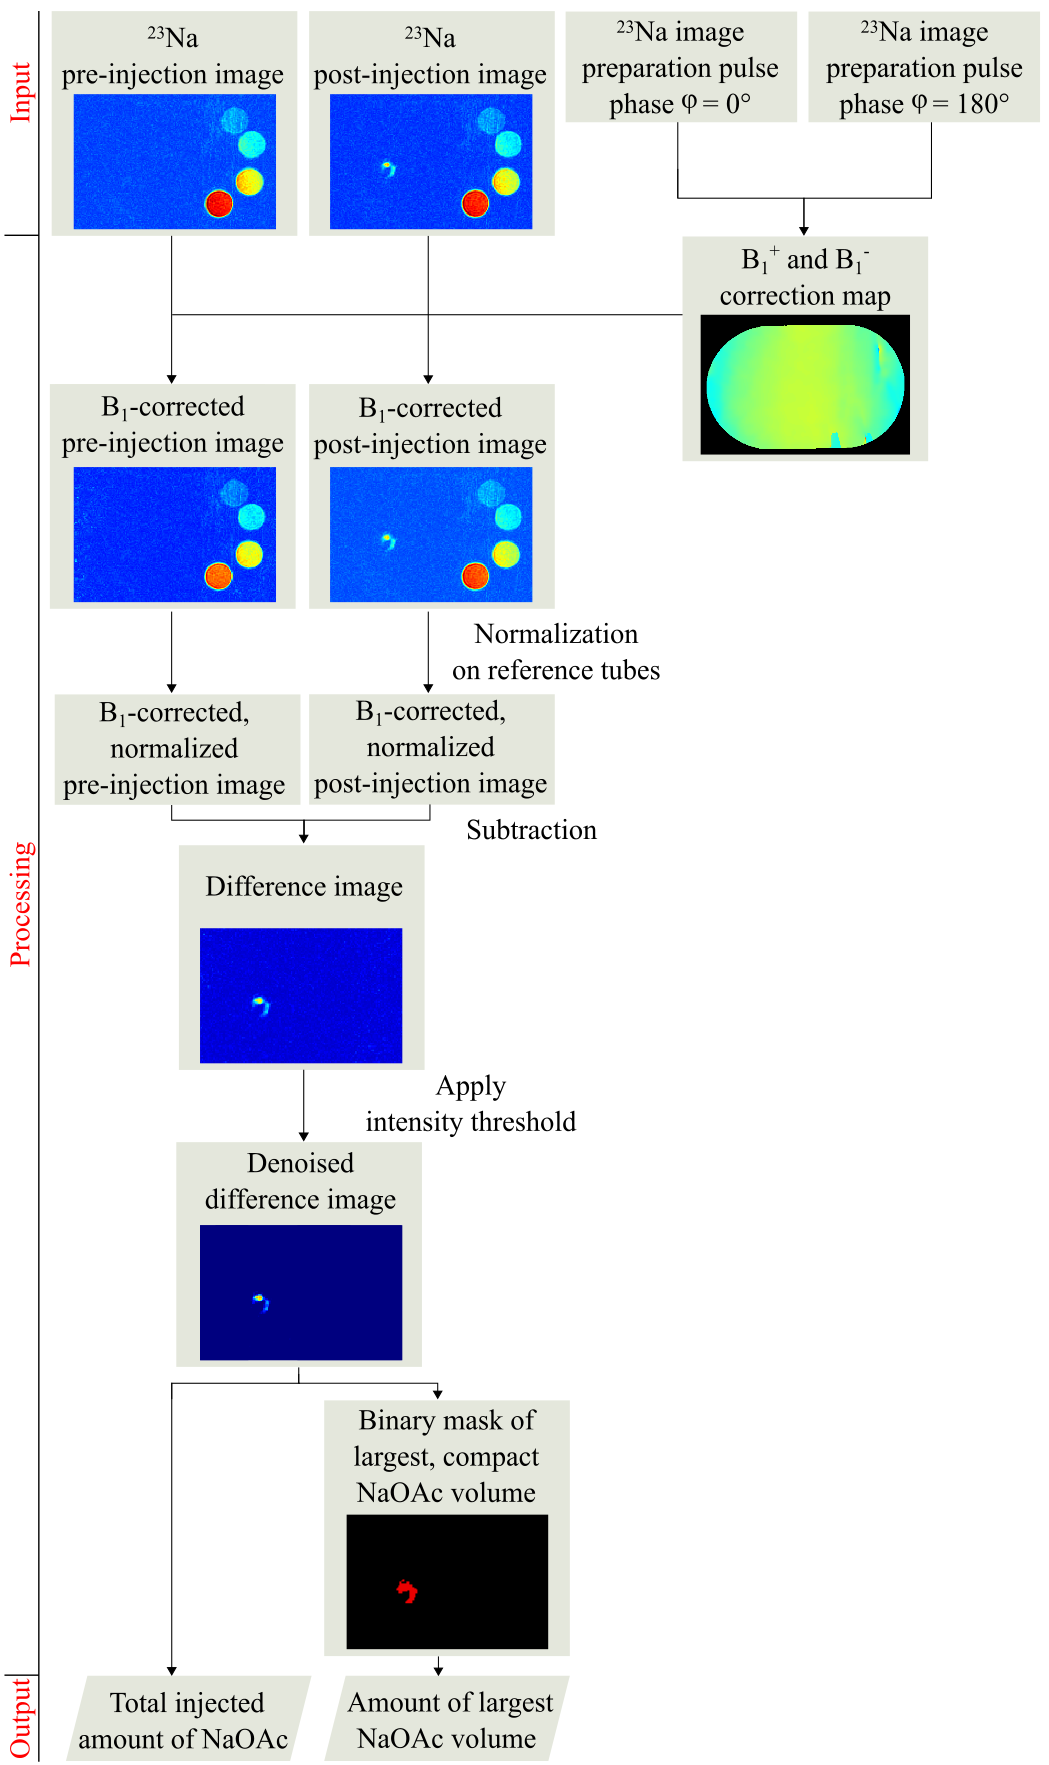
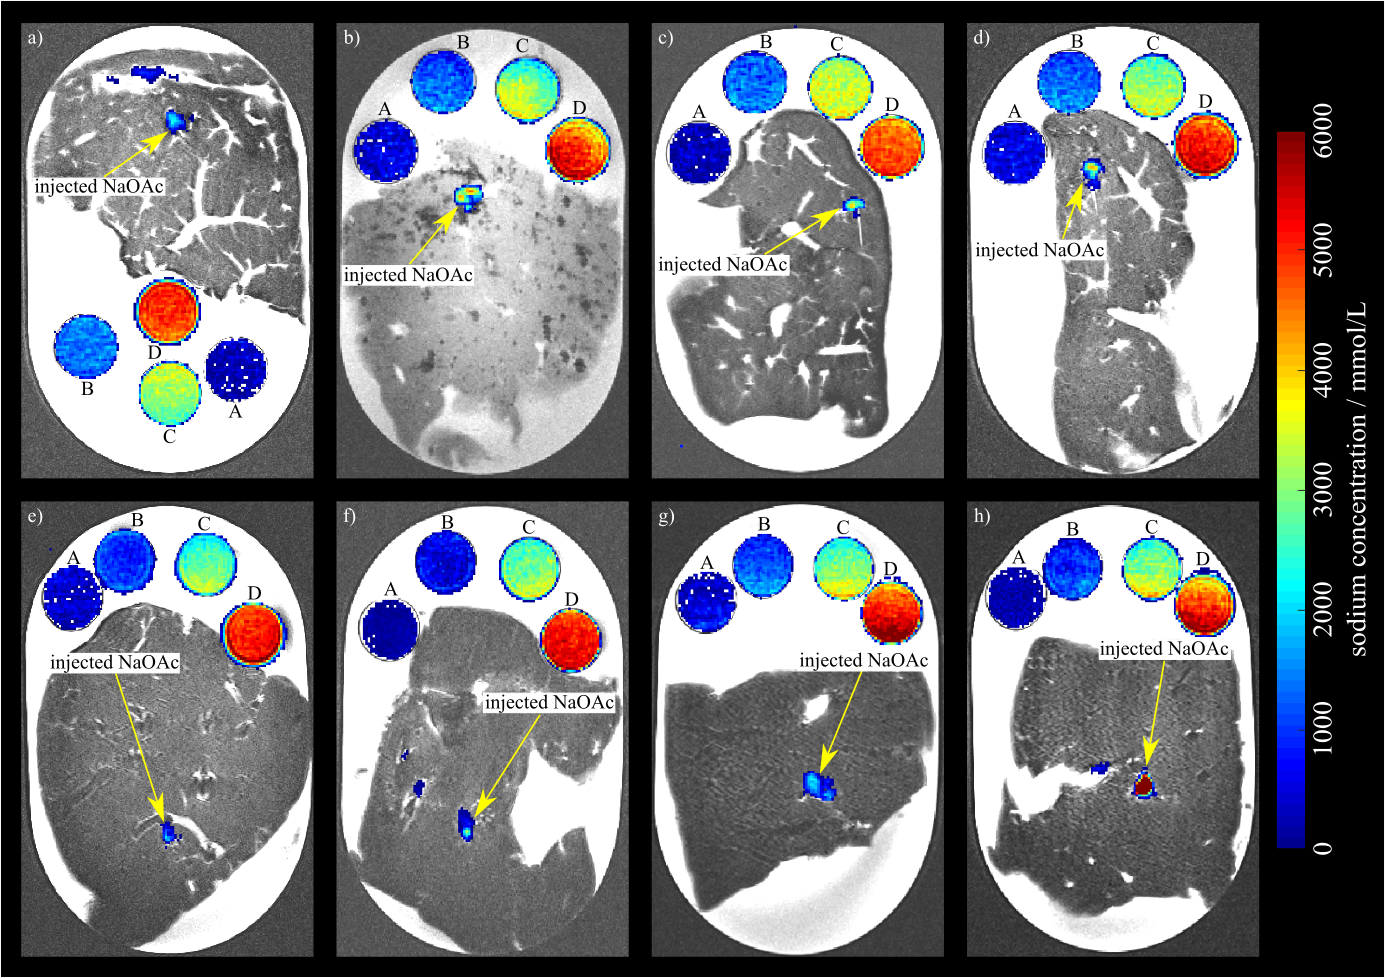
All experiments were performed on a 7T whole-body MR system (Magnetom 7T, Siemens Healthcare, Erlangen, Germany) using a double-resonant 1H/23Na birdcage coil (Rapid Biomed, Würzburg, Germany). A density adapted 3D radial pulse sequence5 was used for 23Na MRI: TE = 0.3 ms, TR = 25 ms, α = 52°, Nprojections = 20000, Δx3 = 1 mm3, matrix = 2563, Tacq = 8:20 min. T2w 1H images were obtained with a TSE pulse sequence. B1-maps were calculated6,7 based on two 23Na 3D data sets acquired with preparation pulse phases φ = 0° and φ = 180°. Injections were performed using a contrast medium injector (Accutron MR, Medtron AG, Saarbrücken, Germany) combined with an in-house built volume converter (1:5). In plastic trays, ex vivo bovine liver phantoms were embedded into 0.9% NaCl solution next to four reference tubes filled with NaOAc solutions (1 M, 2 M, 4 M, 5 M). During the experiments, sodium hydroxide (NaOH, 0.5 ml, 10 M) and acetic acid (CH3COOH, 0.5 ml, 10 M) were injected forming NaOAc (1 ml, 5 M) right before entering the liver through a 20 G angio-catheter (B. Braun Melsungen, Melsungen, Germany) with an injection rate of 0.02 ml/s within 50 s (cf. Fig.1). Eight experiments were performed with eight ex vivo bovine liver phantoms. 23Na MR images were acquired prior and 2:10 min after injections to quantify the distribution of NaOAc inside each liver. Post-processing was performed with MATLAB (The Mathworks, Natick, MA, USA). Inhomogeneity of the radiofrequency (RF) field (B1+ and B1-) was corrected.6,7 Signal intensities were normalized on the mean intensities of the reference tubes. B1-corrected, normalized intensities were assumed to be quantitative, representing NaOAc concentrations for each voxel. Difference images between 23Na MRI pre– and post–injection were calculated to quantify changes in concentration. Image noise was removed by applying an intensity threshold, which is defined to be three times the mean intensity of an ROI (25x25x25 mm3) positioned in air. Sums of normalized intensities of the difference images were calculated and the amounts of substance of injected NaOAc solutions determined. For each image the amount of substance of the largest, compact volume was computed using a binary mask (cf. Fig. 2).Results
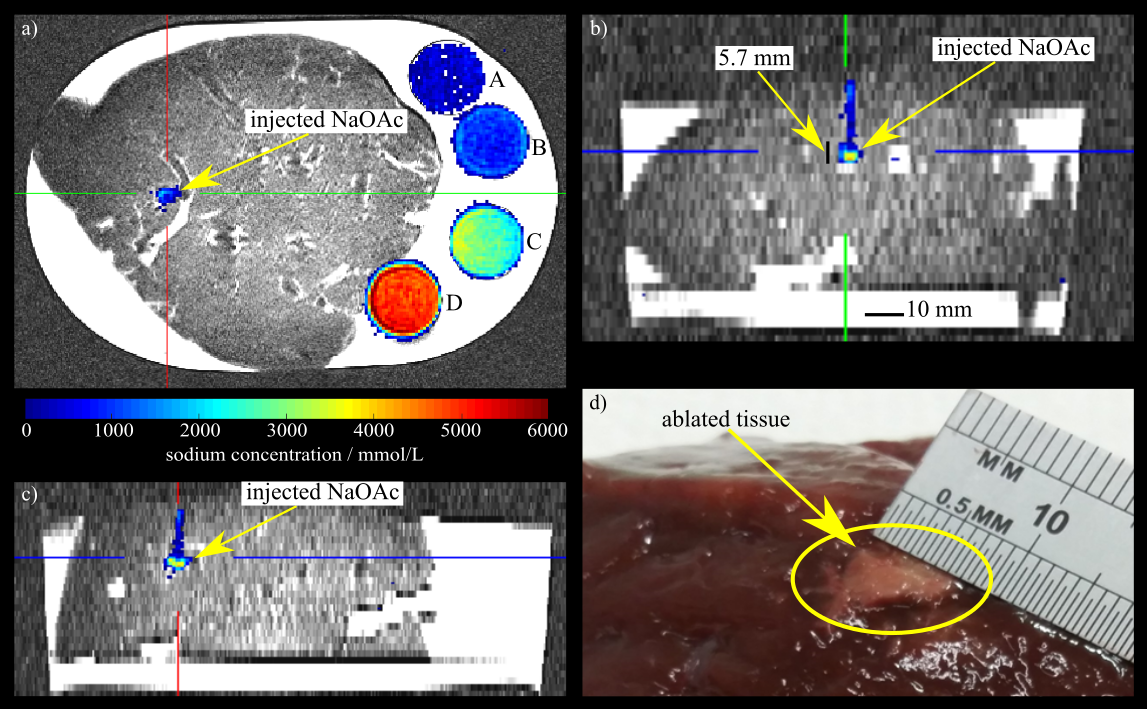
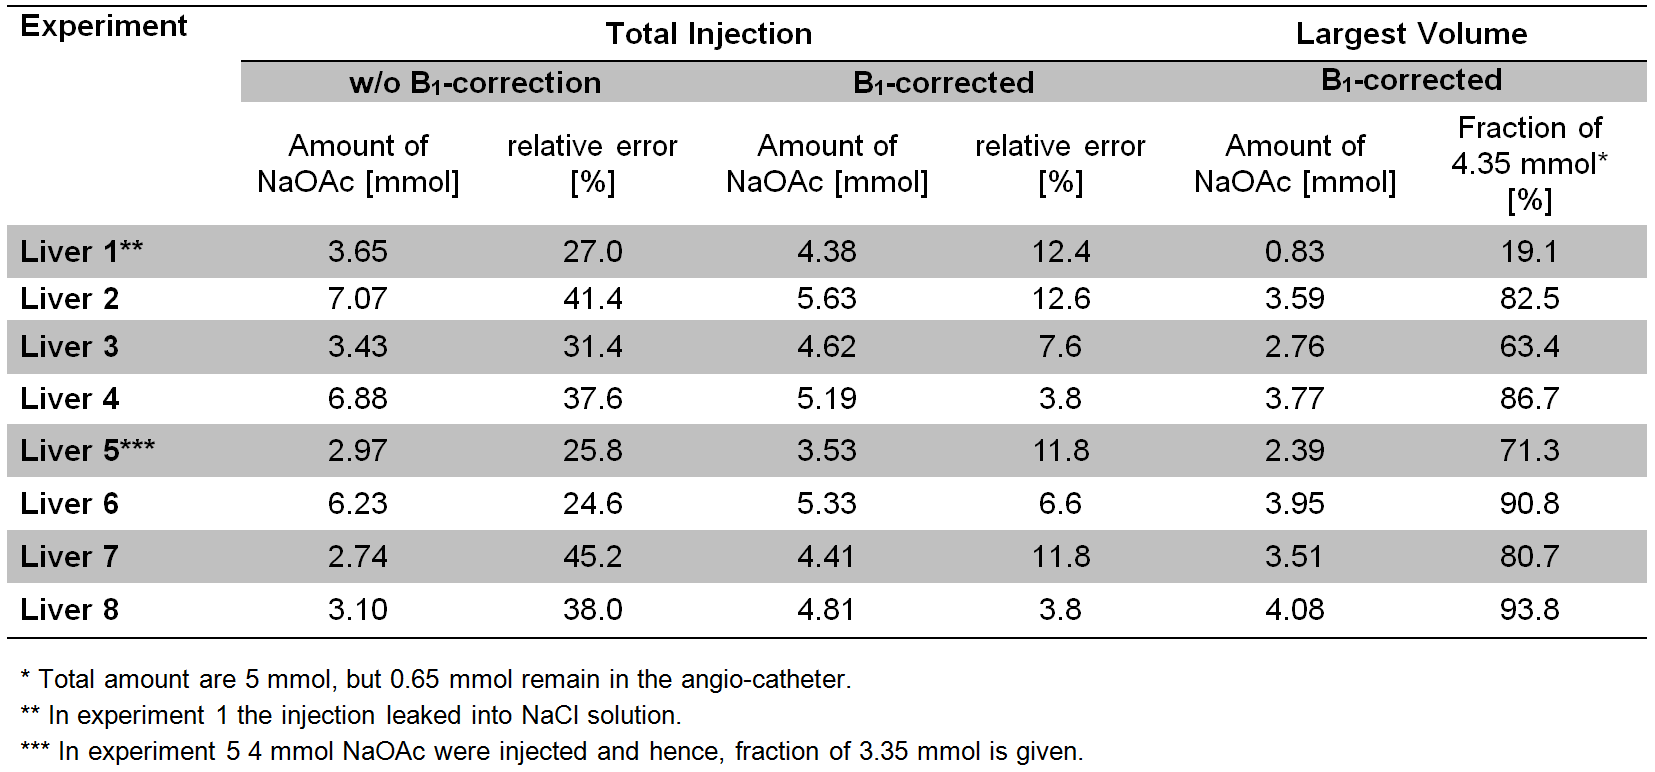
Figure 3 shows a post-injection image and a cross-section of the corresponding ablated volume. Table 1 lists the estimated amounts of NaOAc using normalized difference images with and without B1-correction. After B1-correction, the maximum relative error of the determined amounts of substance decreased from 45.2% to 12.6%. Table 1 also lists the amounts of NaOAc of the largest volumes, which were deposited in the liver. Except for experiment 1, where a major fraction of the injection leaked into the NaCl solution, these include between 63.4% and 93.8% of the total injected NaOAc (5.00 mmol) minus the amount of substance remaining in the angio–catheter (0.65 mmol) (cf. Fig. 4).Discussion
TCA involves high concentrations of NaOAc, which enable 23Na imaging of injected volumes with high spatial resolution. Evaluation showed that B1-corrected and normalized 23Na MR difference images allow accurate non-invasive quantification of NaOAc injections. Small remaining intensity gradients in the reference tubes indicate that B1 differences were not completely compensated by B1-correction in this area. However, B1-correction reduced the maximum relative error of the determined amounts of substance by a factor of 3.6. To further optimize accuracy of quantification, 23Na MR images can be corrected for differences in T1. Our study shows that B1-corrected 23Na MRI is a useful tool to quantify TCA injections. Compared to previous investigations1,2,3,4, this work directly quantified distributions of substance of TCA injections in tissue for the first time.Conclusion
Quantitative 23Na MRI provides detailed information about TCA injections non-invasively, which is important for computational modelling of the method and prediction of cell damage resulting from hyperosmolarity, and can advance the understanding of TCA towards clinical translation.Acknowledgements
The authors thank Dr. Philipp Biegger, Barbara Dillenberger, Rebekka Haffner, Christian Kindtner and Sebastian C. Niesporek for their support.References
[1] Cressman ENK, et al. Int J Hyperthermia. 2010; 26(4): 327–337.
[2] Cressman ENK, et al., Int J Hyperthermia 2012; 28(2): 113-121.
[3] Maier F, et al., Proc. Intl. Soc. Mag. Reson. Med. (2015) 23: 4147.
[4] Behl NGR, et al., Proc. Intl. Soc. Mag. Reson. Med. (2016) 24: 199.
[5] Nagel AM, et al. Magn Reson Med. 2009; 62(6): 1565–1573.
[6] Morrell GR, Magn Reson Med 2008, 60: 889–894.
[7] Allen SP, et al. Magn Reson Med 2010, 65(4): 1125–1130.
Figures