5415
Effect of DBS stimulation intervals on brain activity and dopamine release1Athinoula A. Martinos Center for Biomedical Imaging, Department of Radiology, Massachusetts General Hospital, Harvard Medical School, Charlestown, MA, United States, 2Laboratory of Neuro- and Psychophysiology, Katholieke Universiteit, Leuven, Belgium
Synopsis
In this study, deep brain stimulation with chronically implanted electrodes in the unilateral ventral tegmental area of a monkey was performed. The purpose was to determine stimulation paradigms for a range of inter-stimulation intervals that would enable the simultaneous observation of brain activity using fMRI and endogenous dopamine release using [11C]raclopride-PET. While long inter-stimulation intervals produced a unilateral focal CBV response in the striatum but no change in [11C]raclopride binding, short intervals produced a more widespread CBV response and displacement of [11C]raclopride. This study shows the effect of stimulation parameters on brain activity, neurotransmitter release and its limits of detectability.
Introduction
Deep
brain stimulation (DBS) along the mesocorticolimbic system is an emerging
therapy for neuropsychiatric disorders, such as addiction, schizophrenia or
ADHD and can modulate reinforcement learning and motivation1. The
neurotransmitter dopamine plays an equally important role in these disorders and
is a major driving factor of the functions of the mesolimbic system. Recently,
it has been reported that DBS evoked fMRI responses are insensitive to
stimulation frequencies in rodents2. However, other stimulation
parameters and their relationship to brain activity or neurotransmitter release
are not well understood and are challenging to measure non-invasively in vivo. The
goal of this study was to investigate the effect of inter-stimulation intervals
on brain activity, using fMRI, and simultaneously evaluate its dopaminergic
signature, using receptor-specific PET imaging of the D2/D3 receptor system. Methods
A female baboon with a chronic microstimulation implant in the right ventral tegmental area (VTA) was scanned under anesthesia (1.5% isoflurane) in 14 sessions on a human-sized integrated 3T PET/MR system with both fMRI and PET data acquired continuously during the session. Stimulation was applied through a constant current of 1 mA at two microwires (out of a bundle of 23 microwires) at a frequency of 100 Hz, in pulse trains of 200 ms of stimulation duration (=20 pulses) at a time. Stimulation trains were repeated every 1 to 32 seconds over a period of 5 to 20 minutes. Before stimulation, the D2/D3 receptor-specific radiotracer [11C]raclopride was administered as a bolus plus infusion until steady state was reached at 30-40 min. Ferumoxytol was used as a contrast agent to increase fMRI detection power and gradient-echo EPI data were acquired continuosly during the PET acquisition. fMRI data were analyzed with the GLM and converted into cerebral blood volume (CBV) changes3. PET data were analyzed with a 2-tisse tissue kinetic model, cerebellum as the reference region and a time-dependent binding term. Binding potential (BPND) was used as the outcome measure, from which occupancy was calculated.Results
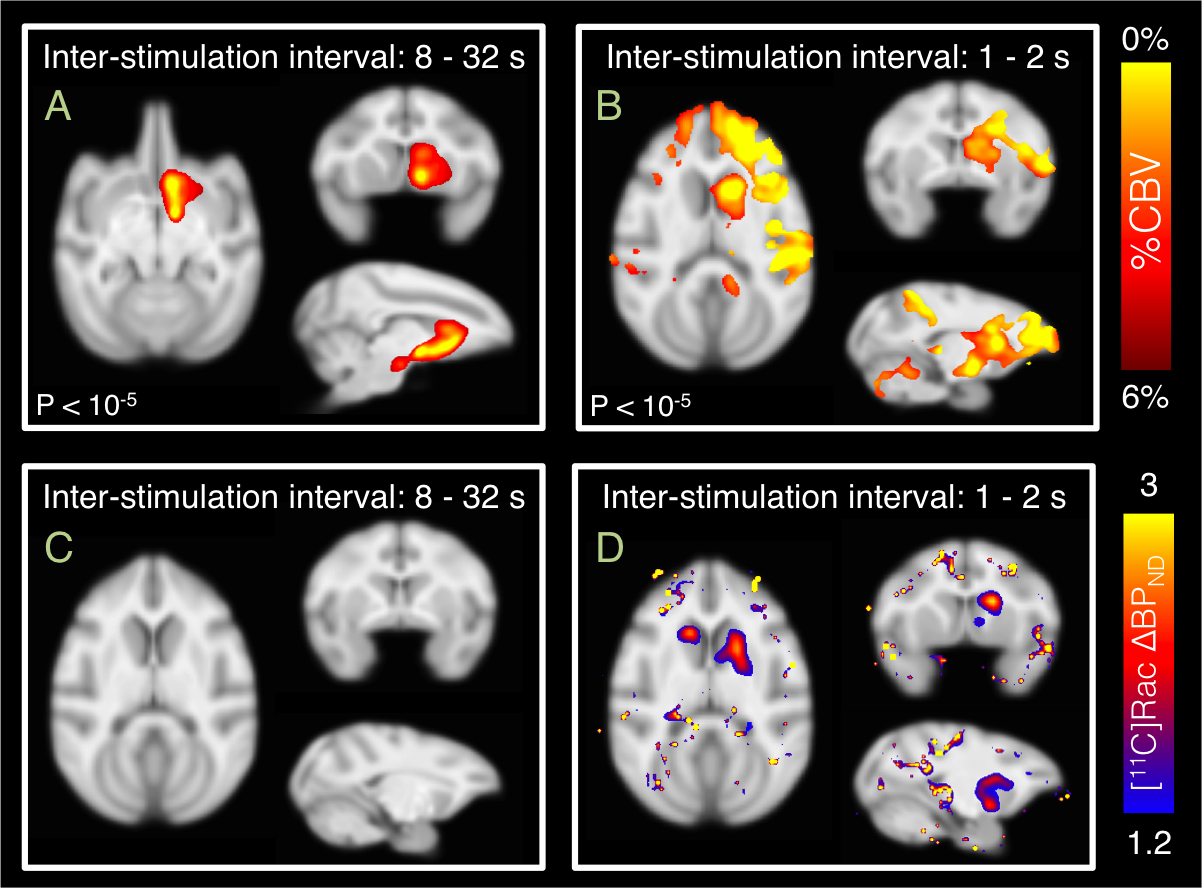
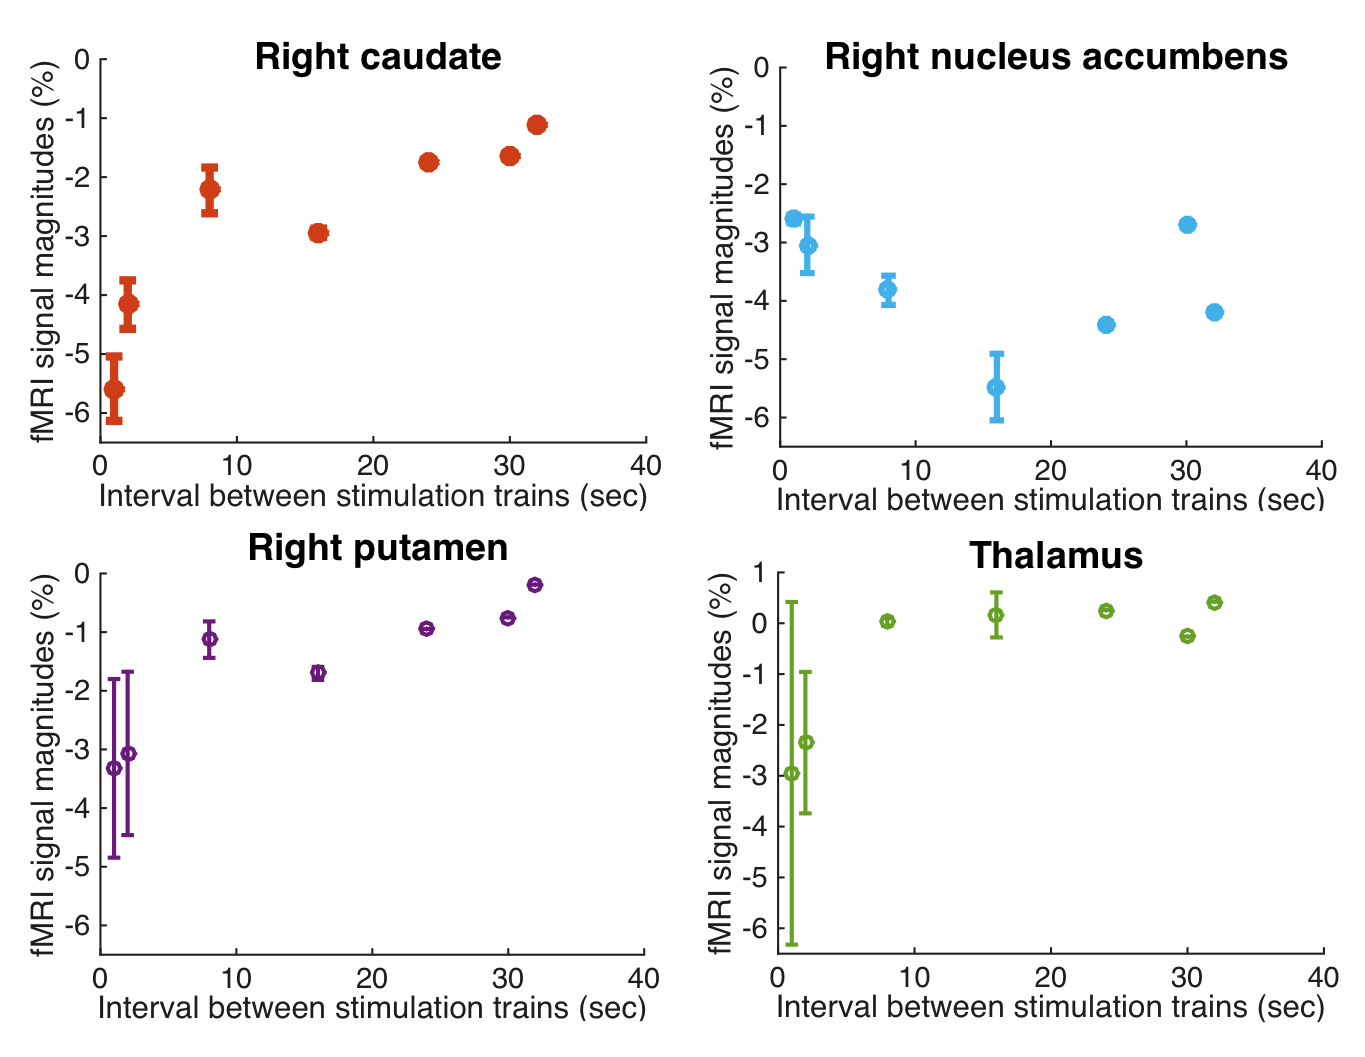
fMRI data from all stimulation sessions showed robust positive responses in CBV in the right (implanted) hemisphere, with largest CBV responses recorded in nucleus accumbens and caudate on the right side (Figure 1A-B). Inter-stimulation intervals between 8 and 32 seconds showed focal CBV responses in the nucleus accumbens and caudate in both single session and group analyses. Short inter-stimulation intervals of 1 and 2 seconds showed distributed activation with large CBV changes in right caudate (4.5%), nucleus accumbens (3.3%), putamen (2.8%), thalamus (2.4%) and prefrontal cortex. Whereas the right caudate showed the largest CBV increase with shorter inter-stimulation intervals, the right nucleus accumbens showed the largest CBV response of 4.5% at 16 seconds inter-stimulation intervals in a U-shaped response (Figure 2). For the 8 to 32 second inter-stimulation intervals, corresponding PET data showed decreases <10% in baseline BPND in subregions of the striatum, which were not significant in group analyses (Figure 1C). For the 1 to 2 second inter-stimulation intervals applied four times in one session, a 1.3 absolute change in BPND was observed, equivalent to 35% occupancy, during stimulation periods in the right caudate, corresponding to the area with largest fMRI activation (Figure 1D). Two other PET datasets with short inter-stimulation intervals had to be excluded due to motion artifacts during stimulation periods.Discussion
This study shows that the interval between repeated microstimulation can affect not only the magnitude but also the spatial distribution of fMRI. While shorter inter-stimulation intervals show a more distributed fMRI pattern with the largest response in caudate, longer inter-stimulation intervals show a more focal pattern with the largest response in nucleus accumbens. Using [11C]raclopride-PET, changes in specific binding that are larger than normal test-retest variability were only detected with inter-stimulation intervals of 1-2 seconds, not with longer inter-stimulation intervals. Literature results from cyclic voltammetry show that a stimulation-evoked dopamine response lasts for a duration of approximately 2 seconds. Since our PET images have time bins of 1 minute, the longer inter-stimulation interval may be too short to give a reliable signal change in PET due to temporal averaging within PET time bins. While [11C]raclopride has good sensitivity for the putamen and caudate, it only exhibits about half the specific binding in the nucleus accumbens due to its moderate affinity. Hence, the larger signal changes observed in the caudate may facilitate the detectability of dopaminergic release with [11C]raclopride.Acknowledgements
This work was supported by the MGH ECOR Fund for Medical Discovery and NIH grants R90DA023427, P41EB015896, S10RR026666, S10RR022976, S10RR019933 and S10RR017208.References
1. Arsenault JT et al. Role of the Primate Ventral Tegmental Area in Reinforcement and Motivation. Current Biology 2014, 24(12), 1347–1353. 2. Albaugh DL et al. Functional Magnetic Resonance Imaging of Electrical and Optogenetic Deep Brain Stimulation at the Rat Nucleus Accumbens. Nature Publishing Group, July 2016, 1–13. 3. Mandeville JB et al. Dynamic functional imaging of relative cerebral blood volume during rat forepaw stimulation. MRM 1998, 39(4), 615–624. 4. Schluter EW et al. Real-time dopamine measurement in awake monkeys. PLoS ONE, 2014, 9(6).
Figures