5414
Multi-scale peak detection method for an automatic cardioballistic artifact period determination directly from EEG-fMRI data1Laureate Institute for Brain Research, Tulsa, OK, United States, 2Stephenson School of Biomedical Engineering, University of Oklahoma, Norman, OK, United States, 3Center for Biomedical Engineering, University of Oklahoma, Norman, OK, United States
Synopsis
In simultaneous EEG-fMRI, the period of cardioballistic artifact (BCG) in EEG is required for the artifact removal. Recording the electrocardiogram (ECG) waveform during fMRI is difficult, often causing inaccurate period detection. Since the BCG artifact waveform in EEG-fMRI is relatively invariable compared to the ECG waveform, we propose a multiple-scale peak-detection algorithm to determine directly the BCG period from EEG-fMRI data. The algorithm achieves a high detection accuracy of the BCG artifact occurrence on a large EEG-fMRI dataset without using the ECG waveforms, virtually eliminating the need for ECG for BCG artifact removal.
Introduction
In
simultaneous EEG-fMRI, the cardioballistic artifact (BCG) in EEG can be significantly
removed by average artifact subtraction (AAS) or optimal basis set (OBS)
subtraction,1,2 followed by independent component analysis (ICA).3,4
Both algorithms require period detection of the BCG artifact in order to form the
subtraction templates. Electrocardiogram (ECG) recording is commonly used to acquire
the BCG period. Because of the strong static and varying
gradient magnetic fields in fMRI, the waveform of the
ECG is prone
to artifacts, sensitive to the probe position, and varies
substantially across subjects. With the common period detection algorithm
implemented in EEGLAB,2,5-7 inaccurate ECG period detection is often
observed (Fig.1). When large EEG datasets are considered, tremendous efforts are
needed for the correction. Nevertheless, the waveform of the BCG in EEG-fMRI is
relatively invariable as compared to that of the ECG recordings. Therefore, we
propose an automatic multiple-scale peak-detection algorithm applied to the BCG
artifact for the period determination. The proposed method measures directly the artifact
occurrence from EEG-fMRI data without the use of ECG waveforms.
Methods
The
simultaneous EEG-fMRI was conducted on a GE MR750 3T MRI with an 8-channel head
coil and 32ch MR-compatible EEG system (Brain Products GmbH). MRI artifacts were
removed, then ICA was applied to separate the BCG artifact. The cardioballistic
artifact components (CB-ICs) were automatically identified based on the
algorithm described in Ref.[8], with the algorithm extended to select all
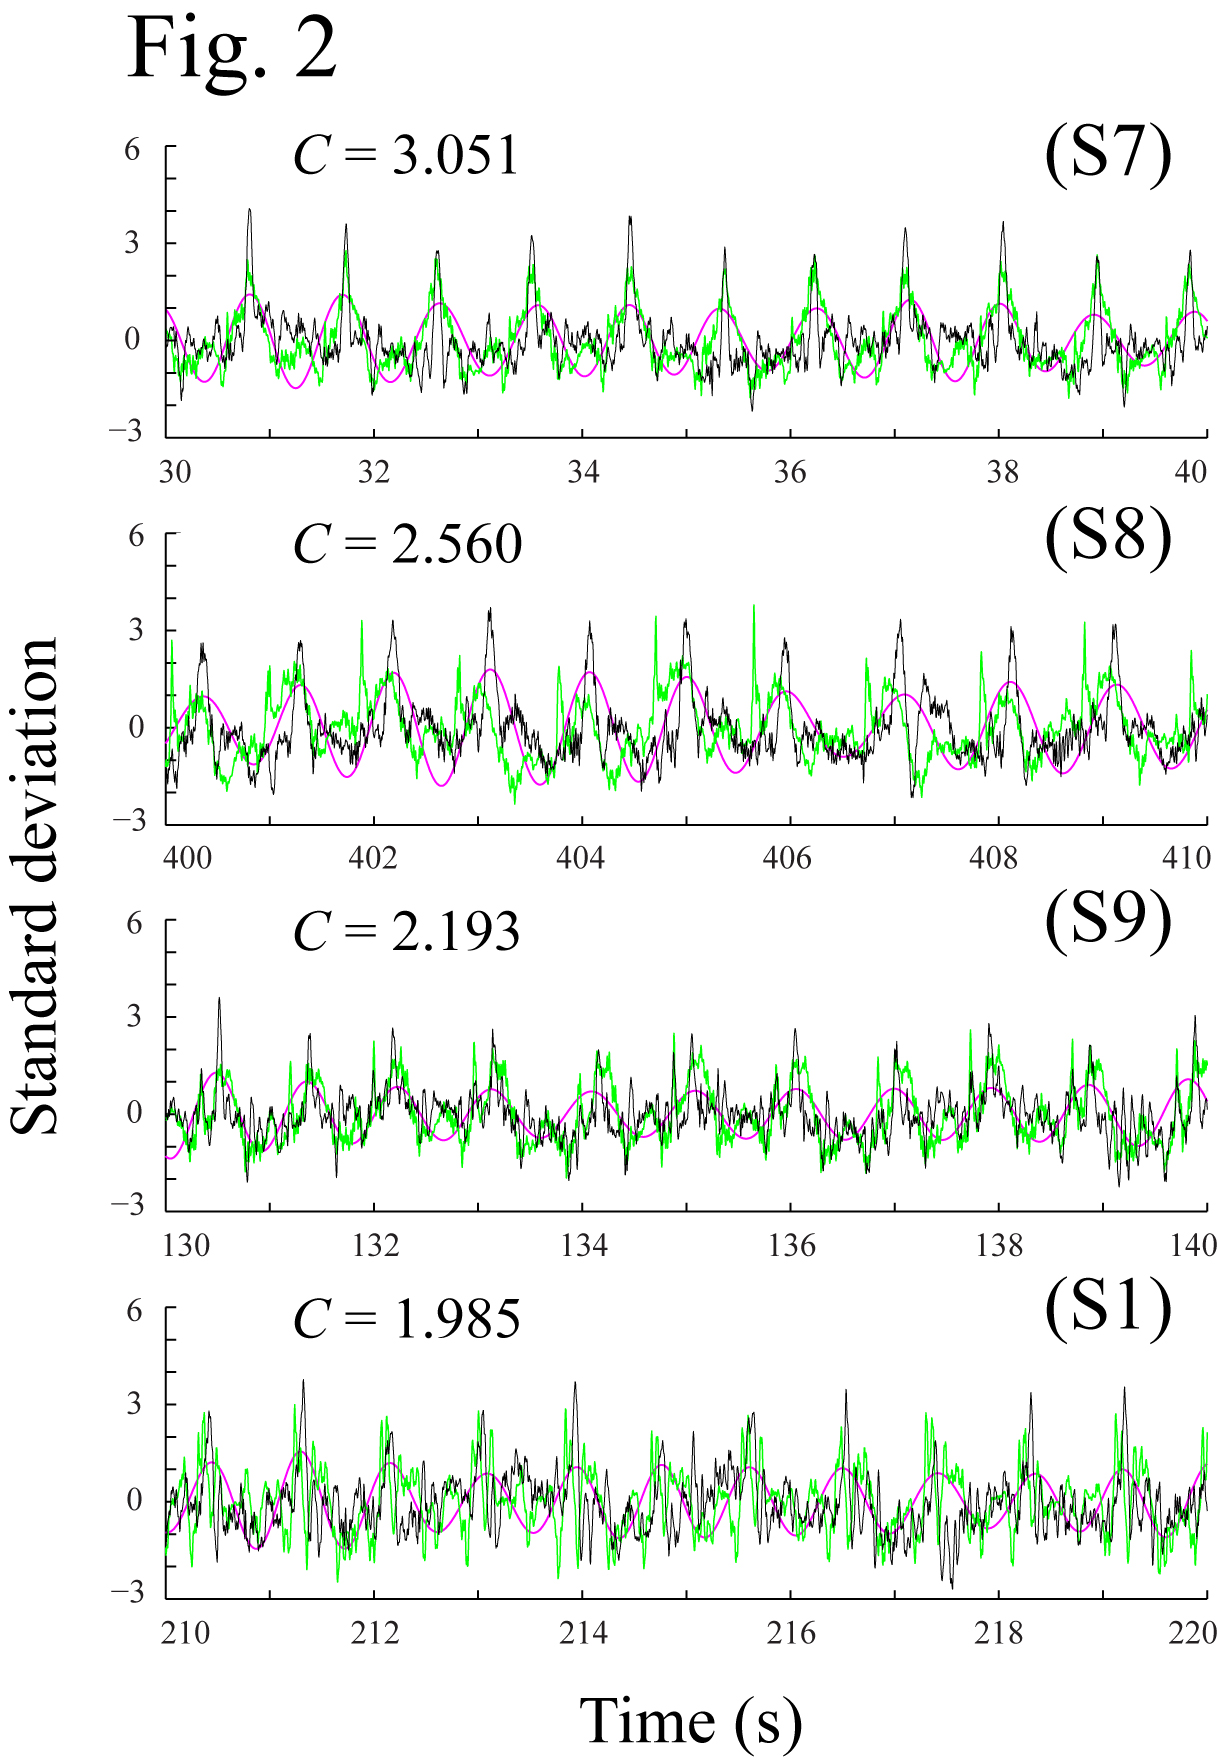
CB-ICs instead of only the motion-related CB-ICs. The CB-IC with the highest
peak contrast (C: mean amplitude of the
peaks that lie between 1-4
standard deviations) was selected for the period detection (Fig.2).
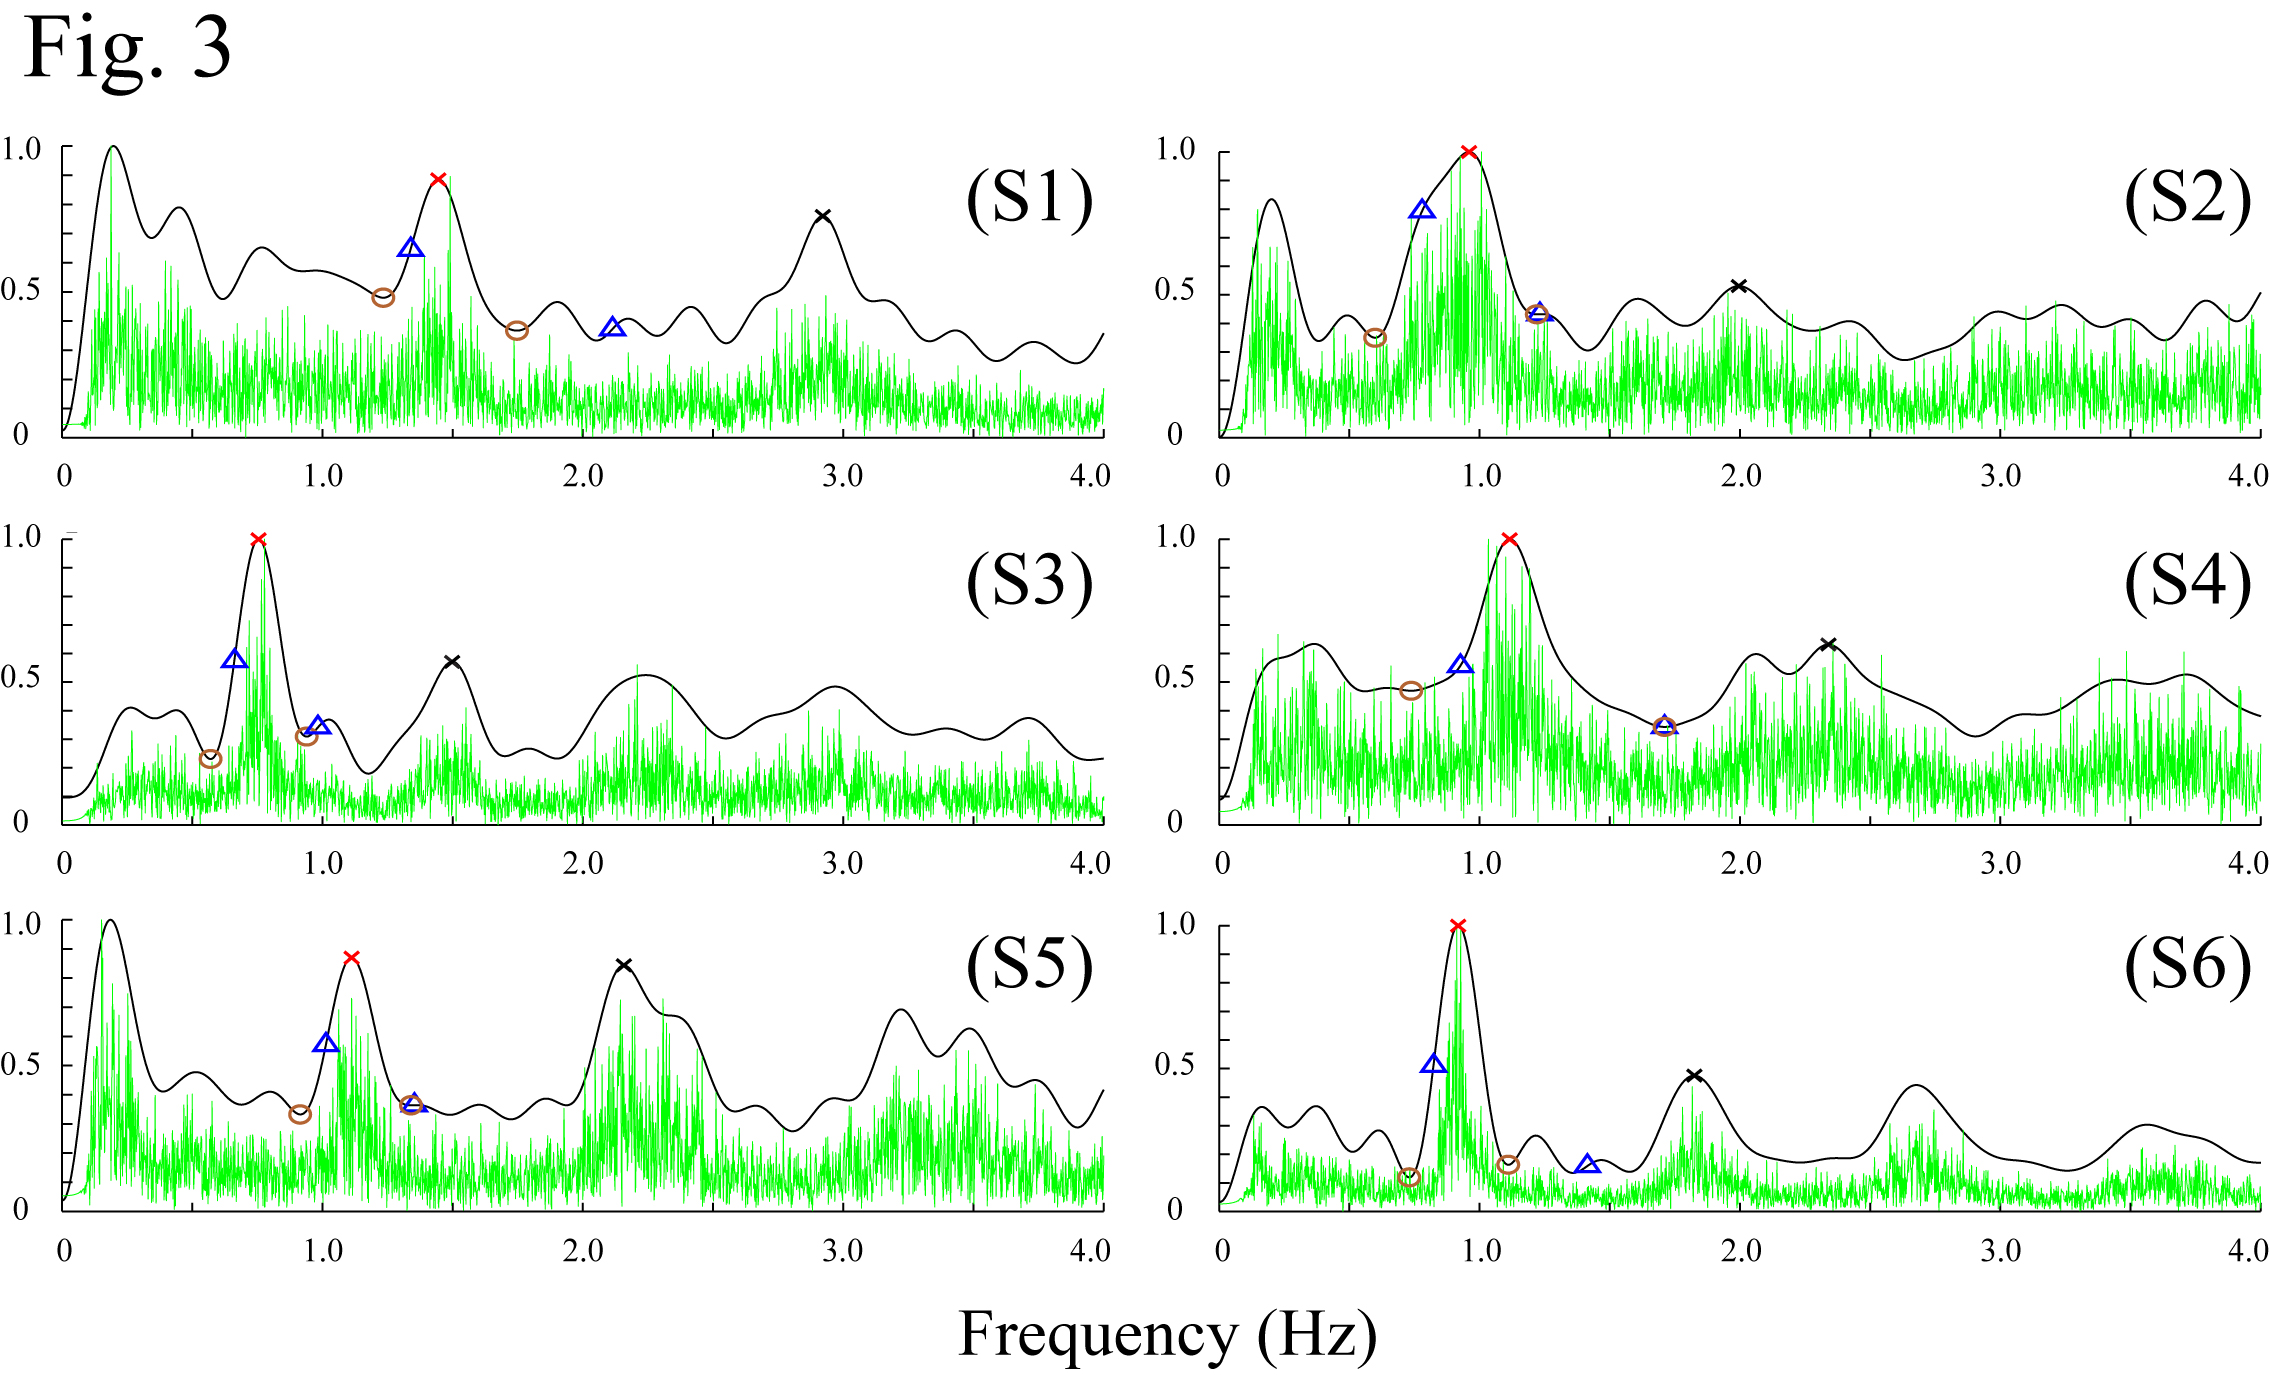
Multiple-scale peak detection was originally proposed for peak-to-peak period determination in ECG.9 Here the algorithm is refined for the BCG period detection. The algorithm included two steps of band-pass filtering. In Step 1, the band-pass filtering of CB-IC (bp1) aims to estimate the period (Fig.2). In this step, a smoothed spectrum of the CB-IC was calculated (Fig.3), from which the filtering frequency of bp1 was chosen around the identified fundamental frequency of the heart beats. In Step 2, the CB-IC was smoothed (bp2) by band-pass filtering between 0.1Hz and the MR slice acquisition frequency (17Hz). Then a peak was selected from bp2 in each bp1 period based on the peak amplitude, peak rise, slope, and the past periods variations. Finally, the detected peak locations were adjusted if they exceed certain threshold determined by the reference frequencies found in Step 1 (Fig.3).
The proposed algorithm was applied to 281 resting scans from 48 subjects. Each scan lasted 526s. The first 6s of the scan and the time segments with unrecognizable ECG or CB-IC waveform caused by subject motions were removed from consideration, giving a total recording time of 39.98 hours. The automatically detected peaks of the CB-IC were compared to the correct peak timing, which was acquired in reference to both the CB-IC and ECG waveforms with a resolution of 10ms.
Results
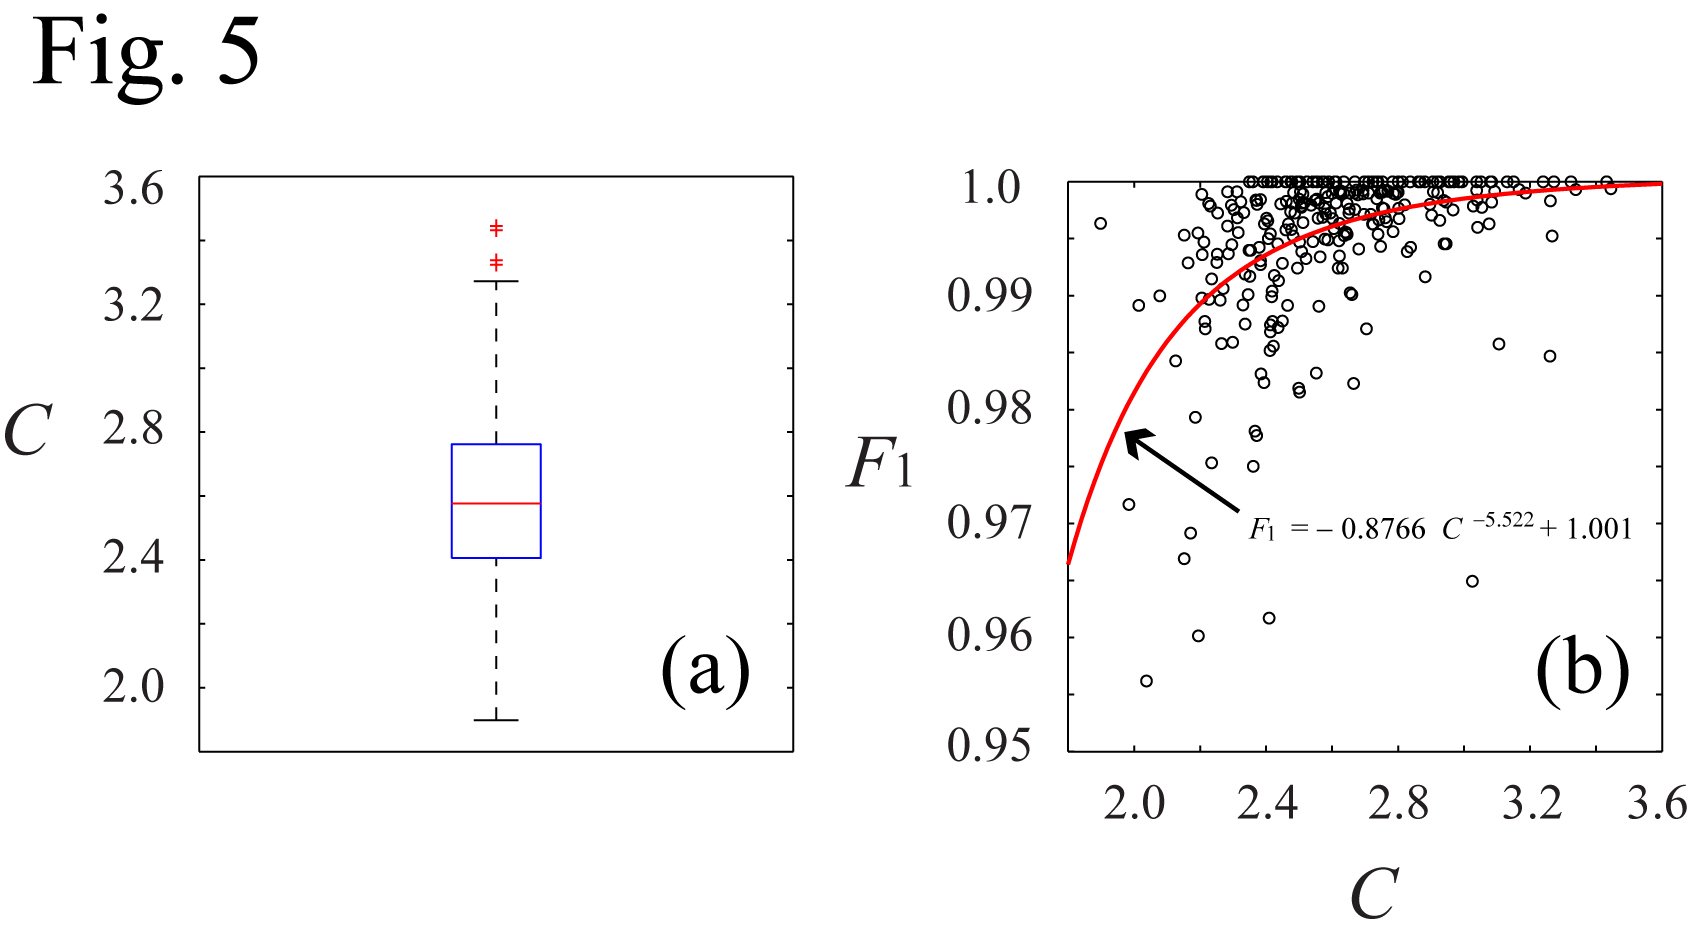
The peak detection time for each selected CB-IC is about 2.7s. Fig.2 shows the CB-ICs with different contrast value (C). Distinct peaks can usually be observed when C >2.3. The subject average heart rate can be found from the fundamental frequency of the smoothed spectrum (Fig.3), which varies from 44 to 91 beats per minute among the scans. Fig.4 shows the detected peaks of bp2. The detected peaks follow closely the R peaks of the ECG with a delay depending on the subject.1 High detection accuracy is achieved based on the relatively invariable CB-IC waveform. Fig.5 summarizes the detection accuracy and the distribution of C for all scans. The F1-score tends to be larger for a larger C. The total numbers of true positive, false positive and false negative detection are 150093, 570 and 848. The corresponding precision, recall and F1-score are 0.996, 0.994 and 0.995.Summary
The
multiple-scale peak detection of the BCG artifact is shown to achieve high accuracy
on a large EEG-fMRI dataset. The algorithm utilizes the relatively invariable BCG
waveform during fMRI and provides
a direct measurement of
the artifact occurrence
without using an external ECG recording. This approach not only simplifies
EEG-fMRI experiments by virtually eliminating the need to place the ECG electrode
on subject’s chest or back, and need for ECG recordings, for the BCG artifact correction,
but also make it possible to create and automate pipelines for a large dataset
processing.Acknowledgements
This works is supported by DOD award W81XWH-12-1-0607.References
1. Allen PJ, Polizzi G, Krakow K, et al. Identification of EEG events in the MR scanner: the problem of pulse artifact and a method for its subtraction. NeuroImage. 1998;8:229-239.
2. Niazy RK, Beckmann CF, Iannetti GD, et al. Removal of fMRI environment artifacts from EEG data using optimal basis sets. NeuroImage. 2005;28:720-737.
3. Bell AJ and Sejnowski TJ. An information-maximization approach to blind separation and blind deconvolution. Neural Comput. 1995;7:1129-1159.
4. Debener S, Strobel A, Sorger B, et al. Improved quality of auditory event-related potentials recorded simultaneously with 3-T fMRI: removal of the ballistocardiogram artefact. NeuroImage. 2007;34:587-597.
5. Christov II. Real time electrocardiogram QRS detection using combined adaptive threshold. BioMed. Eng. Online. 2004;3:28.
6. Kim KH, Yoon HW and Park HW. Improved ballistocardiac artifact removal from the electroencephalogram recorded in fMRI. J. NeuroScience Methods. 2004;135:193-203.
7. Delorme A. and Makeig S. EEGLAB: an open source toolbox for analysis of single-trial EEG dynamics (pdf, 0.7MB). J. Neuroscience Methods. 2004;134:9-21.
8. Wong CK, Zotev V, Misaki M, et al. An automatic EEG-assisted retrospective motion correction for fMRI (aE-REMCOR). NeuroImage. 2016;129:133-147.
9. Wong CK, Zotev V, Yuan H, et al. Cardiac cycle detection in EEG with residual MRI gradient artifact by multiple-scale peak detetion. Proc. Org. Hum. Brain Map. 2014;20:2262.
Figures