5412
SomatoMotor Mapping in MEG1School of Physics, University of Nottingham, Nottingham, United Kingdom
Synopsis
Sensorimotor mapping allows separation of the brain’s representation of individual digits. This is possible using functional magnetic resonance imaging (fMRI), but is more challenging in magnetoencephalography (MEG) where it has been demonstrated by mapping evoked responses. Here, we use ultra-high field (7T) fMRI to map digits in a finger-tapping experiment, and contrast our findings to equivalent results showing the spatial signatures of beta band oscillatory responses measured in MEG. We show that the MEG beta rebound can be mapped topographically.
Introduction
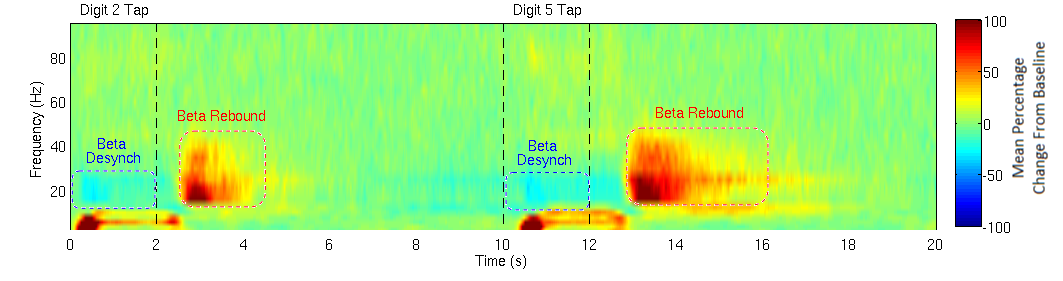
Sensorimotor mapping of the hand’s individual digits has been demonstrated using fMRI1,2, but is more challenging using magnetoencephalography (MEG) due to errors in co-registration, and movement. However, it has been shown using evoked responses3,4. Importantly, the temporal precision of MEG signals provides the ability to assess not only the evoked response, but also changes in neural oscillations. The sensorimotor cortex is dominated by oscillations in the beta band (13-30 Hz), with voluntary movement eliciting a localised decrease in the power of oscillations (beta desynchronisation), followed by an increase above baseline on movement cessation (beta rebound: known to be of clinical importance in disorders such as schizophrenia5 and MS6). Here, we use ultra-high field (7T) fMRI to map the motor activity to Digit 2 (D2) and Digit 5 (D5), and compare these to the spatial signatures of the beta rebound.Methods
Data Acquisition
A single subject was scanned 8 times (male, age 26) whilst carrying out a finger-tapping paradigm of D2 and D5 (2 s tap/8 s rest, 44 trials for each digit) using a 275-channel MEG system. A subject-specific, 3D printed headcast was worn for each MEG scan, allowing the 8 separate datasets to be easily compared. The subject repeated the paradigm (8 s tap, 20 s rest, 6 times for each digit) whilst fMRI data (GE-EPI, TR = 2 s, resolution = 1.5 mm3, FOV = 192x39x192 mm, FA = 75°, TE = 25 ms) were acquired using a Philips 7T MRI system. High-resolution, T2*-weighted axial images (0.25 × 0.25 × 1.5 mm3 resolution; TE/TR = 9.3/457 ms, FA = 32°, SENSE factor = 2) with the same slice prescription and coverage as the functional data were also collected.
Data Analysis
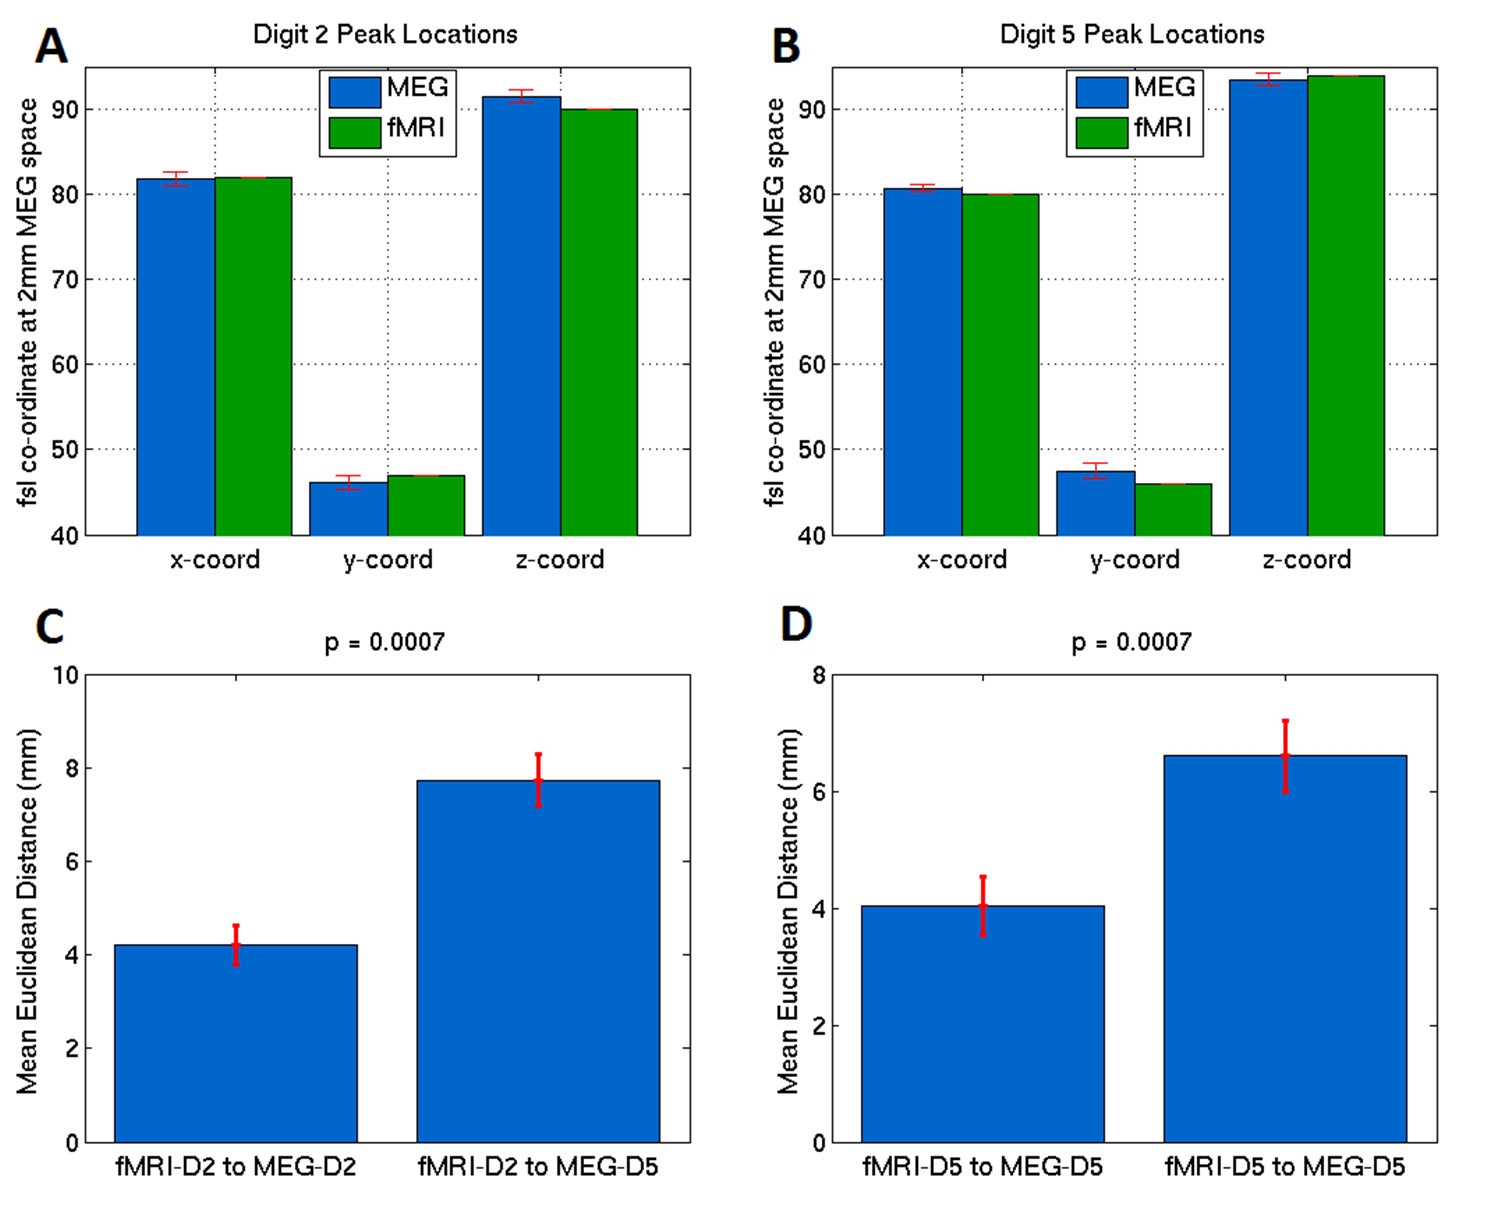
The fMRI data were analysed using FSL FEAT7 to define peak locations in the sensorimotor cortex of D2 and D5, excluding large veins by generating venous vessel masks from the phase of the high resolution, T2*-weighted images. MEG data were frequency filtered between 1-150 Hz and bad trials removed, and co-registered to an MRI anatomical image. Beamformer pseudo-T-statistical images, contrasting the beta rebound [0-2s from tapping offset] to rest [5-7s from tapping offset] were constructed for each digit tap, on each run to determine a peak location in sensorimotor cortex. The mean Euclidean distance was calculated between D2 as defined from fMRI and MEG, and this distance contrasted with the mean Euclidean distance between the peak location of D2 as defined from fMRI and the location of D5 from MEG (and vice versa).
Results
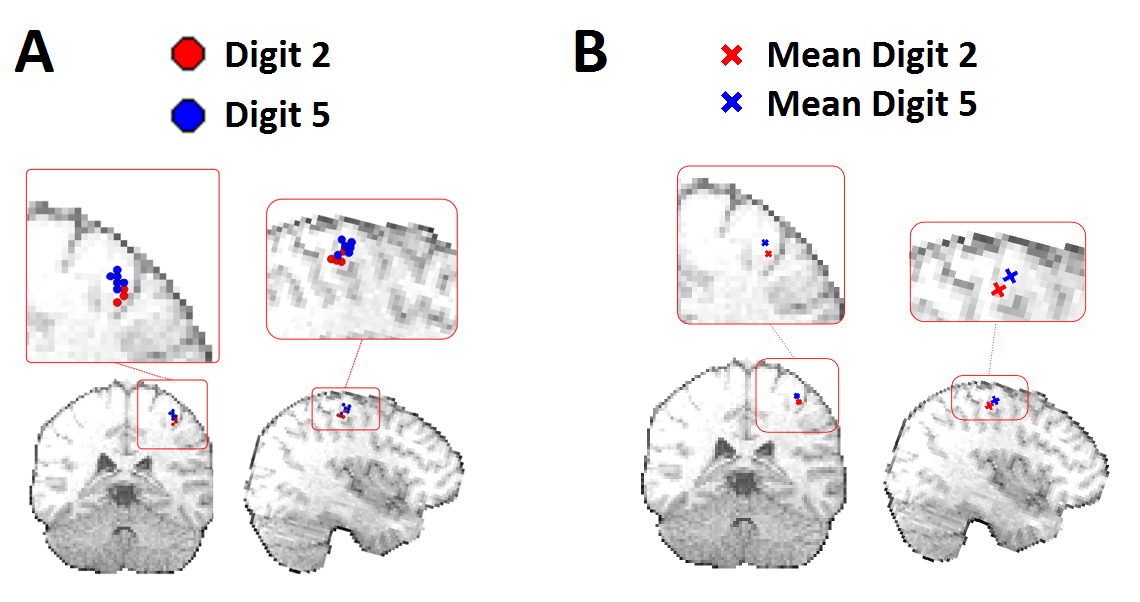
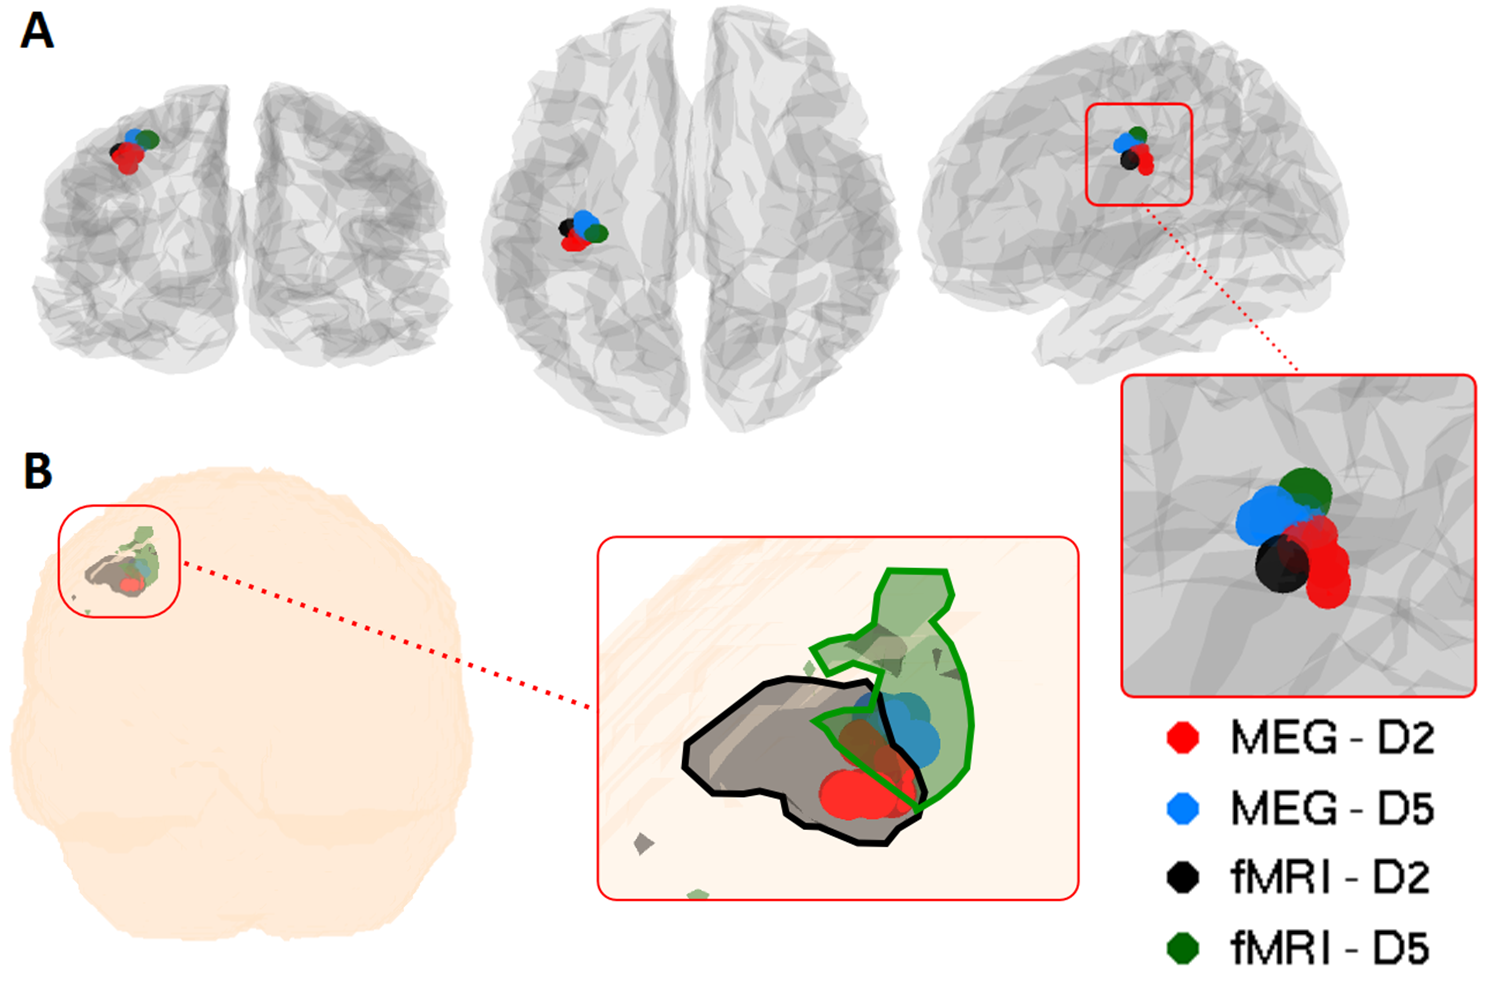
Figure 1 shows the average time-frequency spectrogram in the sensorimotor cortex, where finger tapping occurred at 0-2s for D2, and 10-12s for D5. Figure 2 shows the peak locations for MEG data of D2 and D5 for each of the 8 runs (Figure 2A), as well as the mean peak locations (Figure 2B) - D2 in red, D5 in blue. Figure 3 shows the peak locations for fMRI (D2 in black, D5 in green) and MEG (D2 in red, D5 in blue), both in MNI space (Figure 3A) and individual (Figure 3B) space. A significant (p<0.001) increase in the z-direction (4±1.5mm [mean±SD]) was seen moving from D2 to D5, as well as a significant (p = 0.002) shift in the medial direction (2.3±1.3mm [mean±SD]). Figure 4 compares the spatial position of D2 and D5 between fMRI and MEG. Co-ordinates of peak locations are shown in A and B, with the mean Euclidean distances between fMRI and MEG peak locations plot in C and D.Discussion
Here, we aimed to topographically map the beta rebound. Given the small change in location between the two digits (Figure 2), we expected a number of repeated measurements with minimised coregistration error to be required, and this was facilitated using a subject specific headcast. A clear similarity can be seen between the MEG beta rebound spatial position and the fMRI peak locations for Digit 2 and Digit 5 in MNI space (Figure 3A) and individual space (Figure 3B), with fMRI data overlapping with MEG data for each digit. Figure 4 shows the fMRI results agree significantly with those from MEG (p = 0.0007 for both directions).Conclusion
We have shown that the beta rebound can be mapped topographically, adding to previous literature on the strong relationship between neural oscillations and the BOLD response. The combination of MEG and UHF-fMRI data yields cortical mapping with uniquely high spatial and temporal precision, and this can methodology can be applied in patients with somatosensory cortex disorders.Acknowledgements
This work was funded by an MRC grant.References
[1] Kurth, Ralf, et al. "fMRI shows multiple somatotopic digit representations in human primary somatosensory cortex." Neuroreport 11.7 (2000): 1487-1491.
[2] Sanchez-Panchuelo, Rosa Maria, et al. "Mapping human somatosensory cortex in individual subjects with 7T functional MRI." Journal of neurophysiology 103.5 (2010): 2544-2556.
[3] Jamali, Shahab, and Bernhard Ross. "Somatotopic finger mapping using MEG: Toward an optimal stimulation paradigm." Clinical Neurophysiology 124.8 (2013): 1659-1670.
[4] Nakamura, Akinori, et al. "Somatosensory homunculus as drawn by MEG." Neuroimage 7.4 (1998): 377-386.
[5] Robson, Siân E., et al. "Abnormal visuomotor processing in schizophrenia." NeuroImage: Clinical (2015).
[6] Barratt, Eleanor L., et al. “Abnormal neural oscillations in multiple sclerosis patients [abstract]. In: The 20th International Conference on Biomagnetism (BioMag); 2016 Oct 1-6; Seoul, South Korea: Abstract no: We-P004.
[7] Woolrich, Mark W., et al. Neuroimage 45.1 (2009): S173-S186.
Figures