5411
Detecting gamma frequency neural activity using simultaneous multiband EEG-fMRI1Centre for Human Brain Health (CHBH), University of Birmingham, Birmingham, United Kingdom, 2SPMIC, School of Physics and Astronomy, University of Nottingham, Nottingham, United Kingdom
Synopsis
We establish a methodology for optimal combination of simultaneous EEG recording with sparse multiband fMRI that preserves high resolution, whole brain fMRI coverage with broad-band EEG signal measurement uncorrupted by MR gradient artefacts. We demonstrate the ability of this approach to record gamma frequency (>50Hz) EEG signals, that are usually obscured during continuous fMRI data acquisition. In a novel application to a motor task we observe a positive correlation between gamma and BOLD responses, supporting and extending previous findings concerning the coupling between neural and haemodynamic measures of brain activity.
Purpose of Work
To assess the feasibility (safety and image quality) of simultaneously recording multiband fMRI with EEG and to show its potential for investigating relationships between EEG gamma activity and BOLD responses.Background
Multiband fMRI can provide shorter TR, increased brain coverage 1,2 for a given TR, or shorter acquisition time in sparse fMRI which extends quiet periods for stimulus presentation. Sparse multiband fMRI has great potential for improving simultaneous EEG recordings where residual gradient artefacts typically obscure gamma frequency neural activity 3,4. However, due to the additional RF power of multiband excitation the safety of multiband EEG-fMRI acquisitions must be assessed 5 and the effect of EEG 6 and multiband 7 on EPI image quality.Methods and Analysis
MRplus EEG amplifiers and 64-channel EEG cap (Brain Products) were used with a 3T Philips Achieva MRI scanner and multiband acquisition (Gyrotools, Zurich), with MR-EEG clocks synchronised.
Initial testing
Safety testing
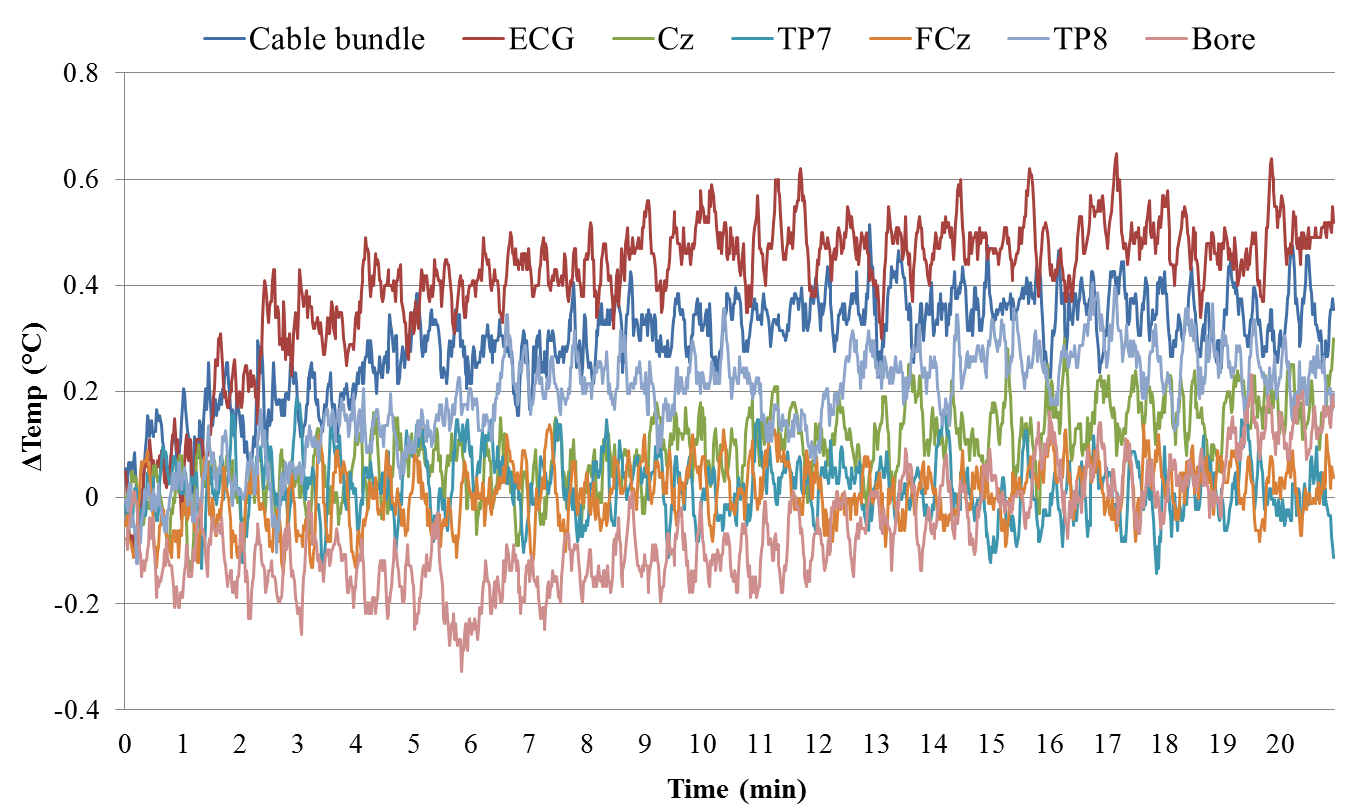
The EEG cap was connected to a conductive agar phantom. Fibre-optic thermometers (Luxtron) monitored the temperature of electrodes (ECG, Cz, TP7, FCz & TP8), cable bundle and the scanner bore throughout two 20-minute scans testing the upper bound of SAR: 1) GE-EPI (TR/TE=1000/40ms, slices=48, B1 RMS=1.09μT, SAR/head=22%); 2) PCASL-GE-EPI (TR/TE=3500/9.8ms, slices=32, B1 RMS=1.58μT, SAR/head=46%). Multiband factor 4 and SPIR fat suppression were used for both sequences.
Image quality
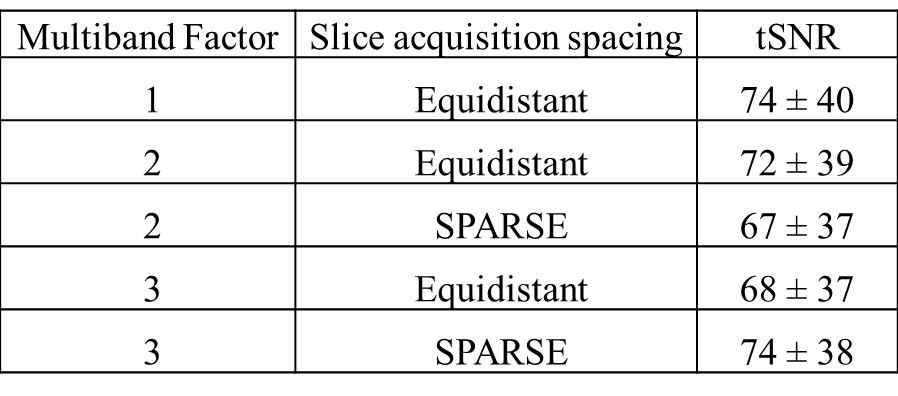
Data were recorded on 3 healthy-subjects during five different GE-EPI sequences: multiband factor=1-3 combined with slice acquisition spacing: equidistant or SPARSE (providing a quiet period with no gradients) all with TR/TE=3060/40ms, SENSE=2, slices=36, FA=79°, 41 volumes (see Fig 2). A T1-weighted anatomical was acquired and grey matter segmented (FSL FAST) and to mask the fMRI data. Image quality was assessed by comparing grey matter temporal signal-to-noise ratio (tSNR).
EEG-fMRI motor study
Paradigm
A trial consisted of four abduction movements of the right-hand index finger, auditory cued (2.5Hz), performed within the MR quiet period of the SPARSE scan, with a 18s resting baseline interval. 8 subjects completed 4 runs of 30 trials inside the MR scanner.
Data acquisition
EEG-fMRI were acquired using a SPARSE GE-EPI scheme (TR/TE=3000/40ms, multiband factor=3, 33 slices (acquisition time=0.75s, quiet period=2.25s), voxels=3mm3, 192 volumes, SAR/head<7%). Simultaneous EMG was recorded from right first dorsal interosseous. VCG recordings were acquired to aid pulse artefact correction. A T1-weighted anatomical image and electrode locations were recorded (Polhemus Fastrak) allowing EEG source localization.
Data analysis
EEG
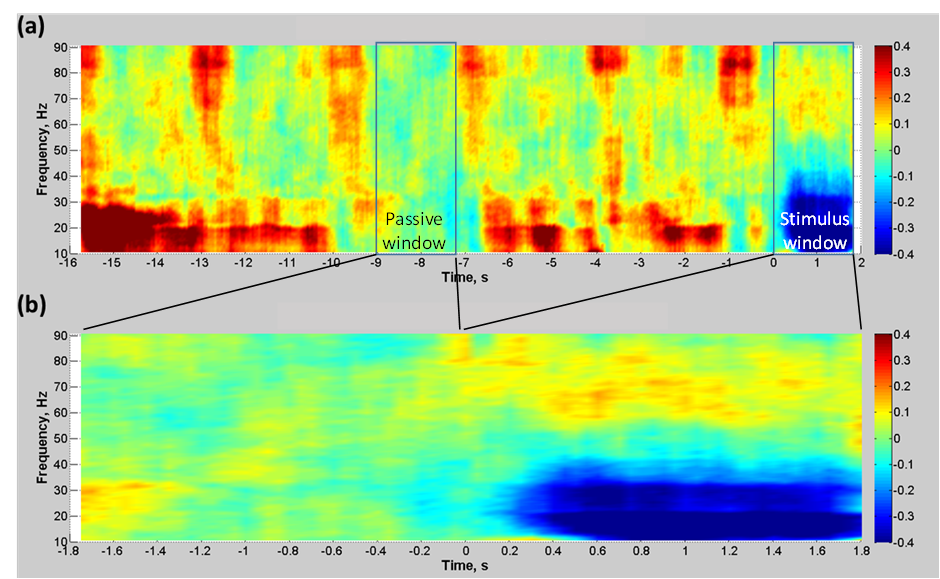
Gradient and pulse artefacts were corrected, data downsampled (600Hz) and epoched from -16–2s relative to auditory cue onset (BrainVision Analyzer2). Trials contaminated with large artefacts/baseline EMG movements were removed. ICA was used to remove eye-blinks/movements (EEGLAB) and data were average referenced. A Linearly Constrained Minimum Variance beamformer was employed with individual boundary element head models (Fieldtrip 8) to localise changes in gamma frequency (55–80Hz) power to abduction movements by creating pseudo T-statistic images [active: 0–1.8s and passive: -9.0 to -7.2s windows]. A broadband (1-120Hz) timecourse of neural activity was extracted from the peak T-statistic location in the contralateral primary motor cortex (M1). Time-frequency spectrograms were calculated using a multitaper wavelet approach 4. The mean gamma power per trial (0-1.5s after auditory cue onset) formed a regressor for fMRI analysis.
fMRI
fMRI data were motion corrected, spatially smoothed (5mm) and normalised to the MNI template (FSL). One subject was excluded due to stimulus-correlated motion. First-level GLM analysis employed 2 regressors: 1) boxcar abduction movement, 2) parametric modulation of single-trial gamma neuronal activity, convolved with the HRF. Data were grouped over runs and subjects using second- and third-level, fixed effects analysis.
Results and Discussion
The GE-EPI showed the greatest heating effect in the ECG channel (~0.5° increase) with nominal heating in other channels (Fig 1). The higher SAR of the PCASL resulted in a greater heating effect (ECG ~0.9°). This heating was within safe limits but these data highlight the potential dangers with multiband sequences for EEG-fMRI where high SAR values can arise from the increased B1 9. The variation in tSNR with multiband factor and slice spacing acquisition was relatively small (Fig 2). Multiband=3 with SPARSE spacing was chosen for the EEG-fMRI experiment, maximising MR quiet-period duration for EEG measurements.
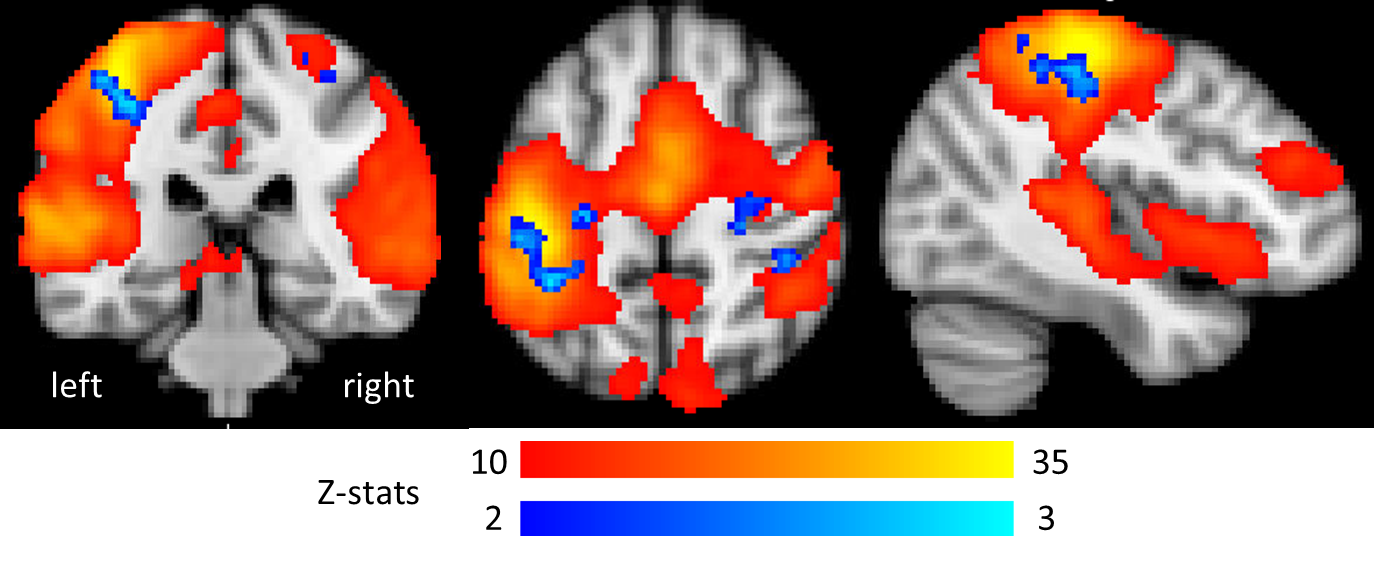
Gamma EEG responses to finger abductions (Fig 3) were localised to contralateral M1. We observed both significant main-effect BOLD activation to the abduction movements (peak=-40,-28,56mm) and positive gamma-BOLD correlation in contralateral M1(peak=-30,-38,50mm) (Fig 4). This correlation was focal to the central sulcus and motor hand-knob, supporting a tight coupling of natural variability in BOLD and gamma task responses 4,10. These findings show the potential value of multiband EEG-fMRI for advanced study of brain function.
Acknowledgements
We thank the Birmingham-Nottingham Strategic Collaboration Fund for funding this research.References
1. Feinberg, D.A., et al., Multiplexed echo planar imaging for sub-second whole brain FMRI and fast diffusion imaging. PLoS One, 2010. 5(12): p. e15710.
2. Moeller, S., et al., Multiband multislice GE-EPI at 7 tesla, with 16-fold acceleration using partial parallel imaging with application to high spatial and temporal whole-brain fMRI. Magn Reson Med, 2010. 63(5): p. 1144-53.
3. Mullinger, K.J. and R. Bowtell, Combining EEG and FMRI. Methods in molecular biology (Clifton, N.J.), 2011. 711: p. 303-26.
4. Scheeringa, R., et al., Neuronal Dynamics Underlying High- and Low-Frequency EEG Oscillations Contribute Independently to the Human BOLD Signal. Neuron, 2011. 69(3): p. 572-83.
5. Auerbach, E.J., et al., Multiband accelerated spin-echo echo planar imaging with reduced peak RF power using time-shifted RF pulses. Magn Reson Med, 2013. 69(5): p. 1261-7.
6. Mullinger, K., et al., Effects of simultaneous EEG recording on MRI data quality at 1.5, 3 and 7 tesla. Int J Psychophysiol, 2008. 67(3): p. 178-88.
7. Chen, L., et al., Evaluation of highly accelerated simultaneous multi-slice EPI for fMRI. Neuroimage, 2015. 104: p. 452-9.
8. Oostenveld, R., et al., FieldTrip: Open source software for advanced analysis of MEG, EEG, and invasive electrophysiological data. Comput Intell Neurosci, 2011. 2011: p. 156869.
9. Collins, C.M. and Z. Wang, Calculation of radiofrequency electromagnetic fields and their effects in MRI of human subjects. Magn Reson Med, 2011. 65(5): p. 1470-82.
10. Logothetis, N.K., The underpinnings of the BOLD functional magnetic resonance imaging signal. J Neurosci, 2003. 23(10): p. 3963-71.
Figures