5410
Alterations of white matter integrity and hippocampal functional connectivity in type 2 diabetes without cognitive impairment1Department of Radiology, Tangdu Hospital, Fourth Military Medical University, Xi’an, People's Republic of China, 2Department of neurology, Xuan Wu Hospital, Capital Medical University, People's Republic of China, 3Department of Radiology, Tangdu Hospital, Fourth Military Medical University, People's Republic of China
Synopsis
Researchers and clinicians interested in neuroimaging and type 2 diabetes mellitus without cognitive impairment, with a particular interest in diffusion tensor imaging (DTI) and resting state functional magnetic resonance imaging (rs-fMRI)
Introduction
More than 415 million of the adults have diabetes in worldwide, among which type 2 diabetes mellitus (T2DM) account for 90% [1]. T2DM is a major risk factor for mild cognitive impairment (MCI) [2] and has been consistently associated with an increased risk of dementia [3]. However, the occurrence of MCI in T2DM patients was an irreversible process, which has lost the opportunity to intervene. Thus, it is significance to explore whether the central nervous system has been involved prior to MCI in T2DM patients. If so, it could potentially lead to an early predictors in T2DM patients before they develop into MCI.
T2DM related neuroanatomical and functional alterations maybe revealed by structural magnetic resonance imaging (sMRI) and functional magnetic resonance imaging (fMRI), respectively. Diffusion tensor imaging (DTI) has been used to quantify microstructural alterations in white matter (WM) that may also impact cognition. DTI techniques provide information about tissue integrity. Fractional anisotropy (FA) and mean diffusion (MD) values derived from DTI reflect overall WM health, maturation, and organization [4]. Resting state functional magnetic resonance imaging (rs-fMRI) contributes to a better understanding of mechanism in neuropsychiatric disorders [5].
Our research aims 1) to detect WM integrity and functional connectivity (FC) impairments using DTI and rs-fMRI, respectively; 2) and to analyze the correlation between brain microstructure impairments and FC alterations in T2DM patients without MCI.
Method
This study was approved by the Ethics Committee of Tangdu Hospital of the Fourth Military Medical University, and informed consent was obtained. Twelve T2DM patients (4 men, 8 women; age, 67.33 ± 4.72 years) and 24 controls (8 men, 16 women; age, 66.67 ± 5.42 years) with inclusion criteria as follows: T2DM patients were diagnosed by physician and had a history of using oral antidiabetic medications or insulin. Controls with normal blood glucose and no evidence of T2DM. Exclusion criteria: Type 1 diabetes mellitus and secondary diabetes mellitus; Neurological diseases, cerebrovascular accidents, psychiatric or serious cardiovascular disease; Cognitive complaints that cause impairment in social or occupational functioning; Any T1WI scans with structural abnormalities, such as tumor or stroke, variations.
WM abnormalities were observed on T2WI and FLAIR images. All participants received physical examinations, which including body mass index (BMI), blood pressure (BP), oral glucose tolerance test (OGTT), glycated hemoglobin (HbA1c), triglycerides, total cholesterol, and high-density lipoprotein (HDL). MR imaging was performed on a 3.0 Tesla Magnetom Trio Tim scanner (Siemens, Erlangen, Germany) using an 8-channel phased-array head coil. Conventional T1WI, T2WI and FLAIR images be obtained to exclude serious brain diseases.
DTI data using single shot spin echo-echo planar imaging (SS-SE-EPI) sequence in 30 independent, non-collinear directions of a b = 1000 and 0 s/mm2. The parameters were: TR = 11000 ms, TE = 98 ms, FA = 90°, matrix = 128 × 128, FOV = 256 × 256 mm2, slices = 60, thickness = 2 mm. Rs-fMRI were collected by using an echo-planar imaging (EPI) sequence, with the following parameters: TR = 2000 ms, TE = 40 ms, FA = 90°, matrix = 64 × 64, slices = 28, thickness = 4 mm, gap = 1 mm.
Tract-based spatial statistics (TBSS) combining region of interests (ROIs) analysis were used to investigate the alterations of DTI data and Pearson’s functional correlation coefficients (transformed to standard z values) were measured to analyze rs-fMRI data in T2DM and control groups.
Results
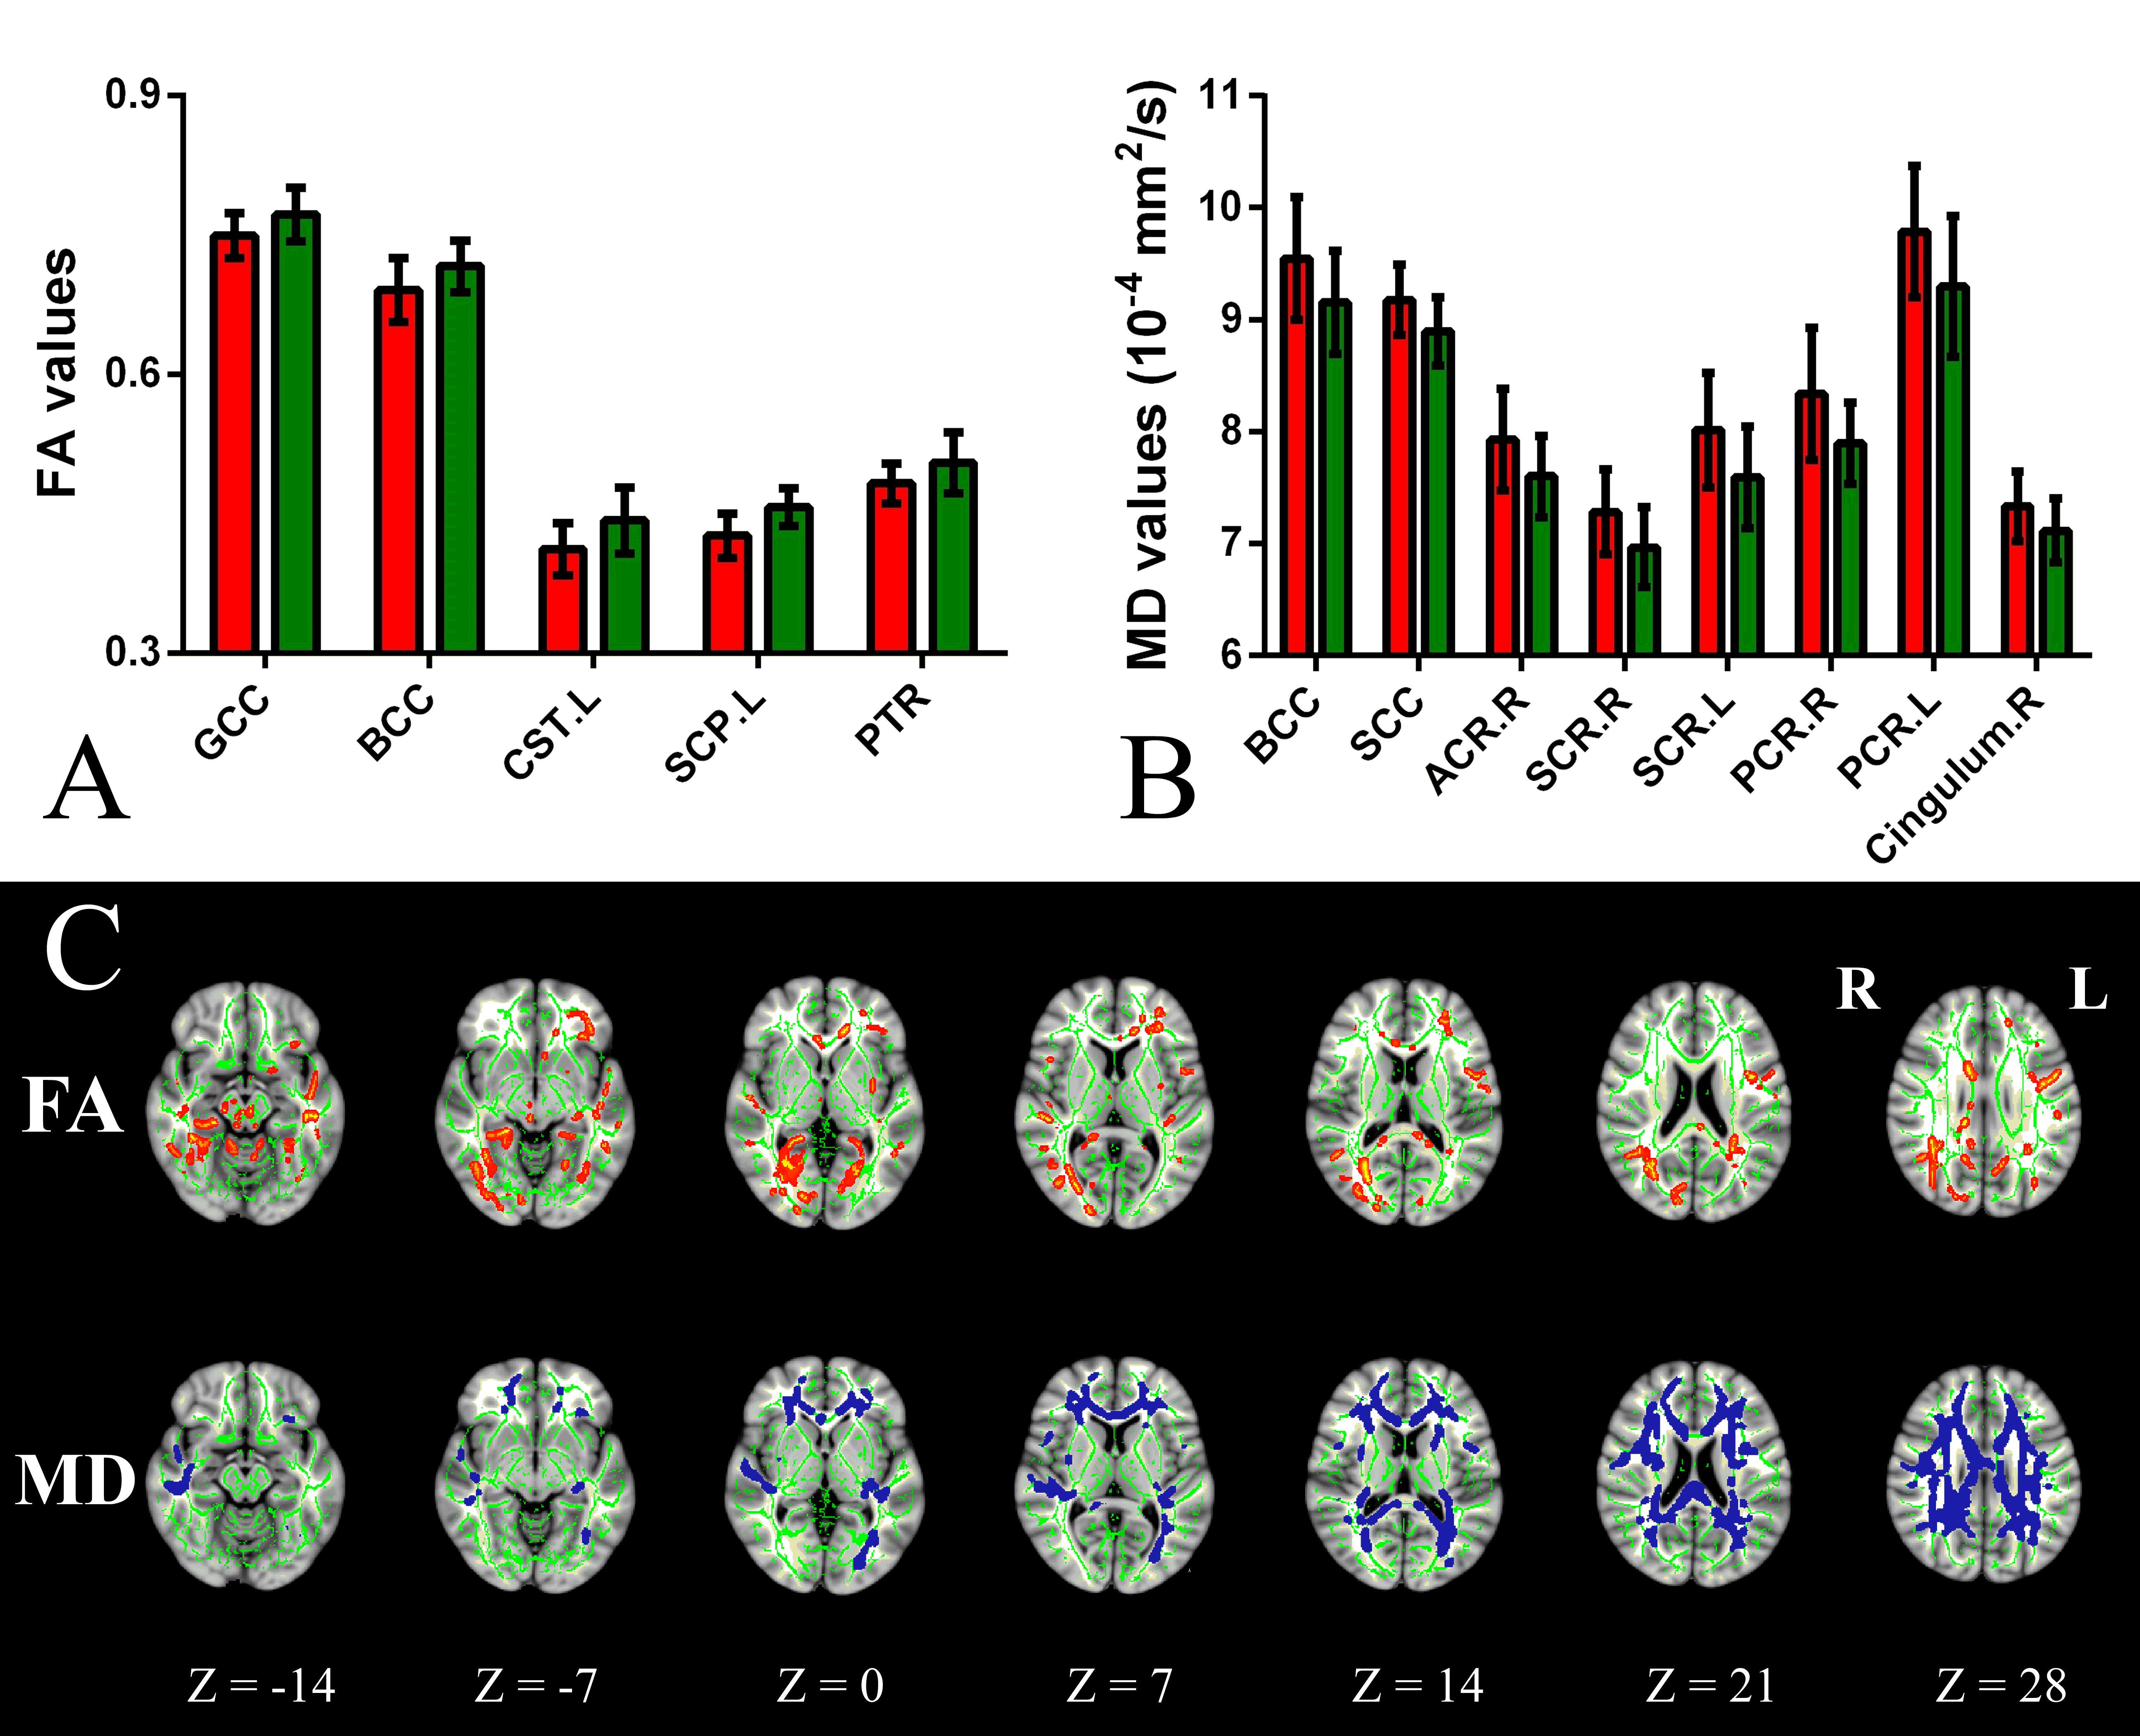
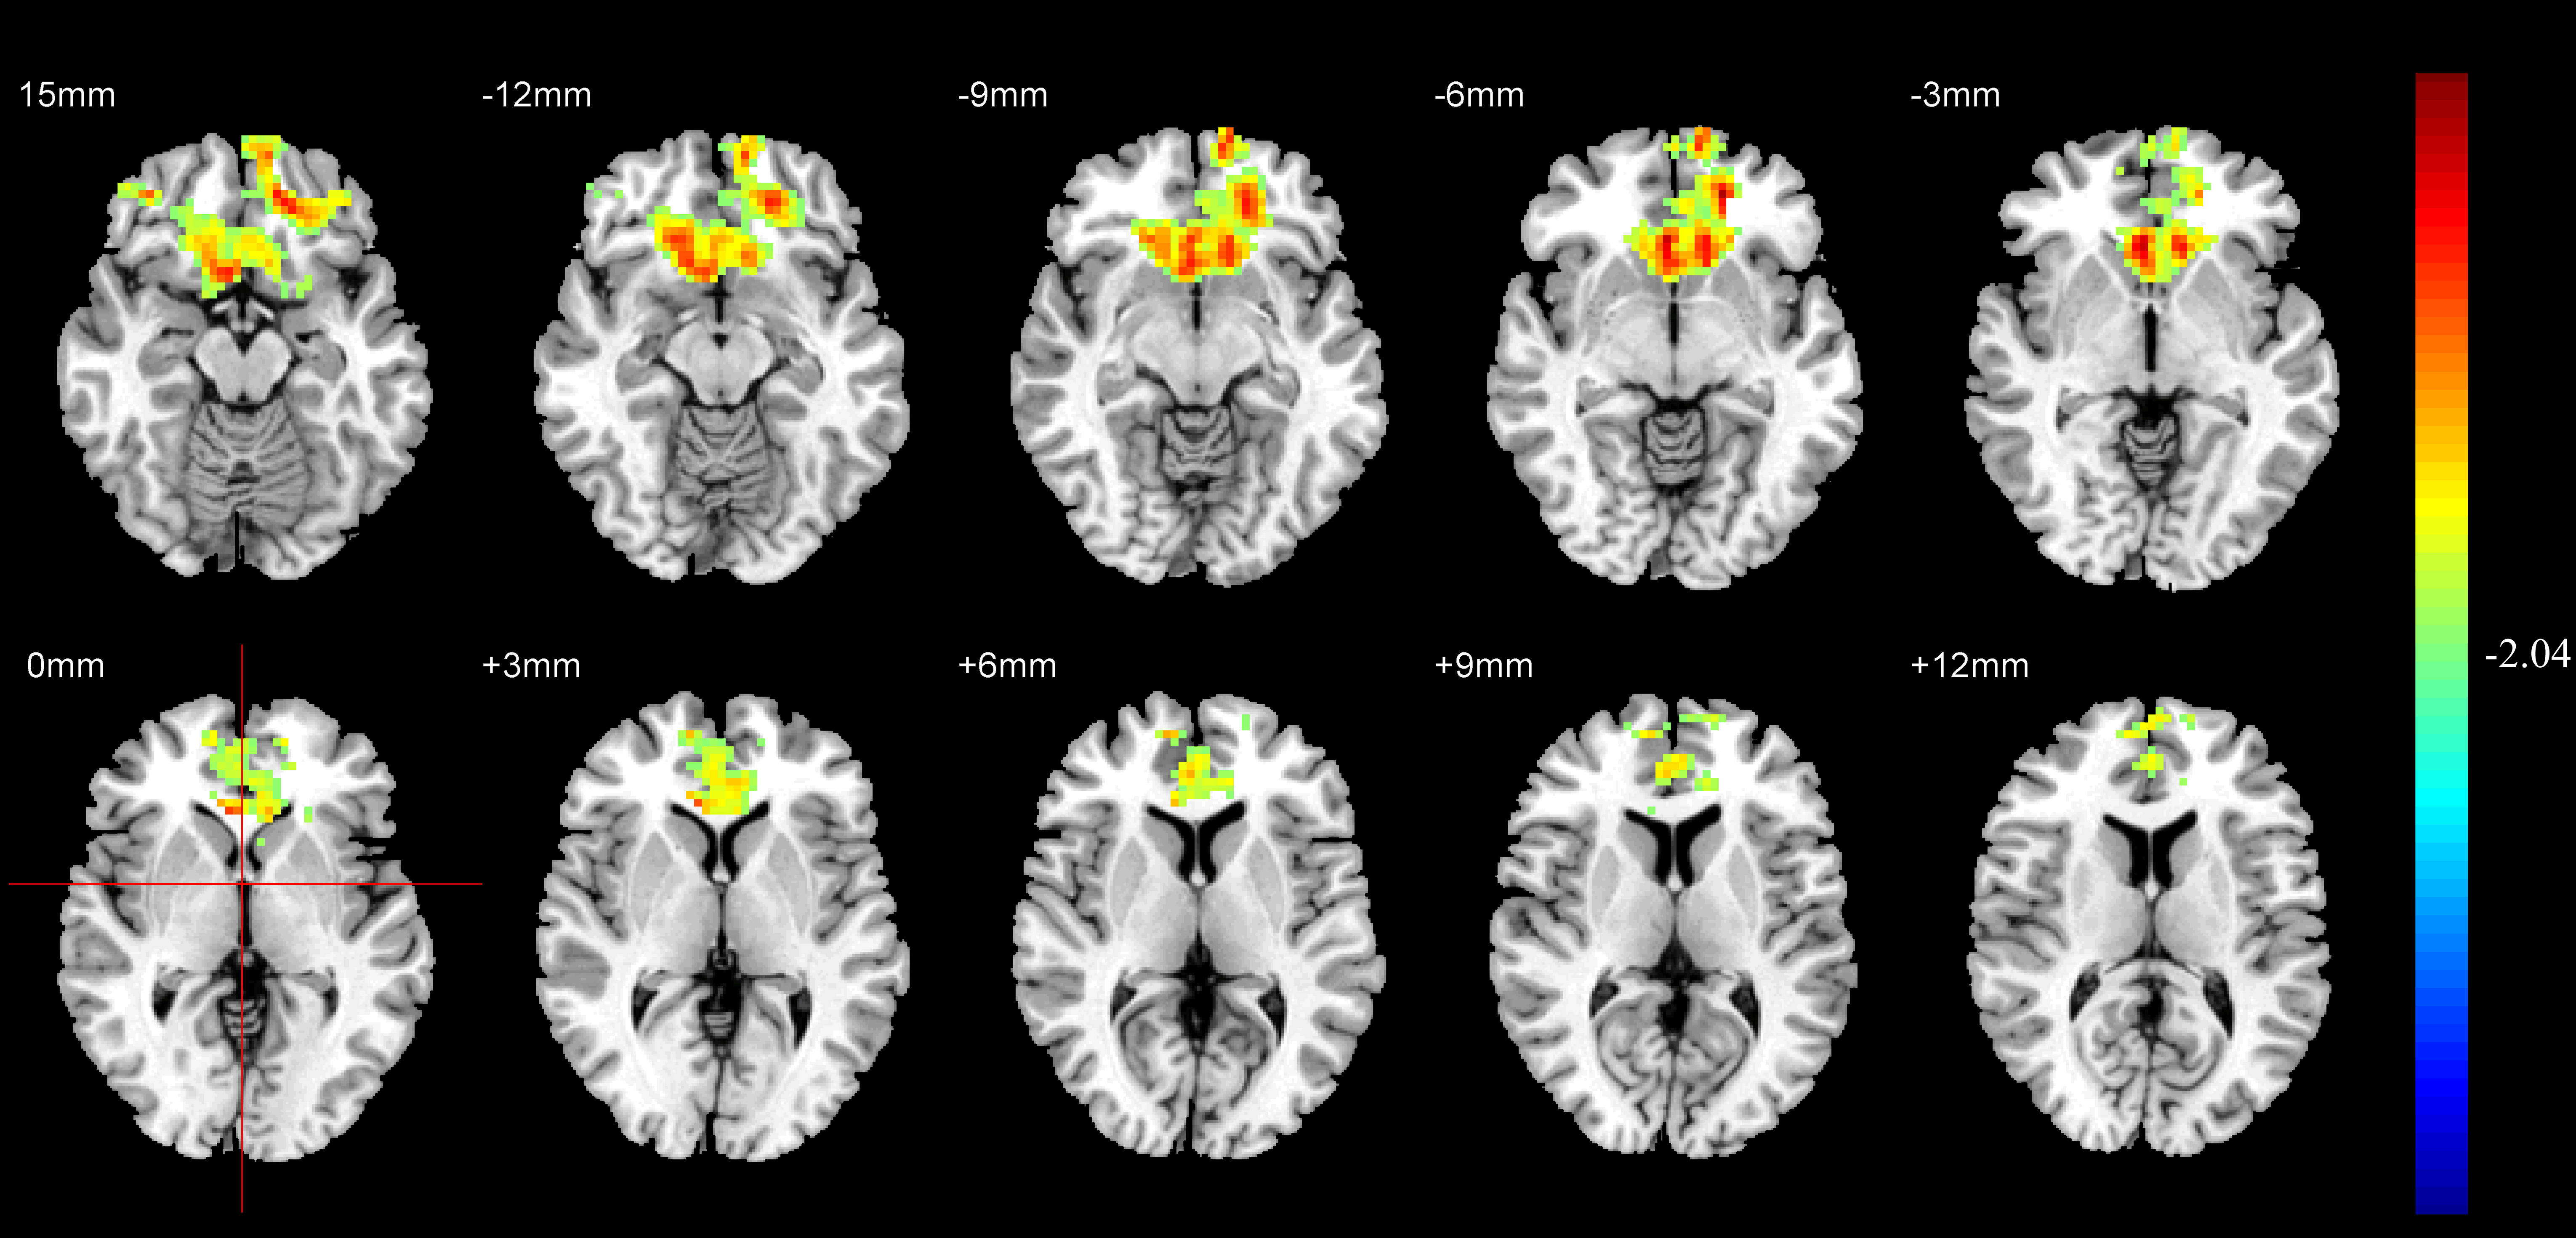
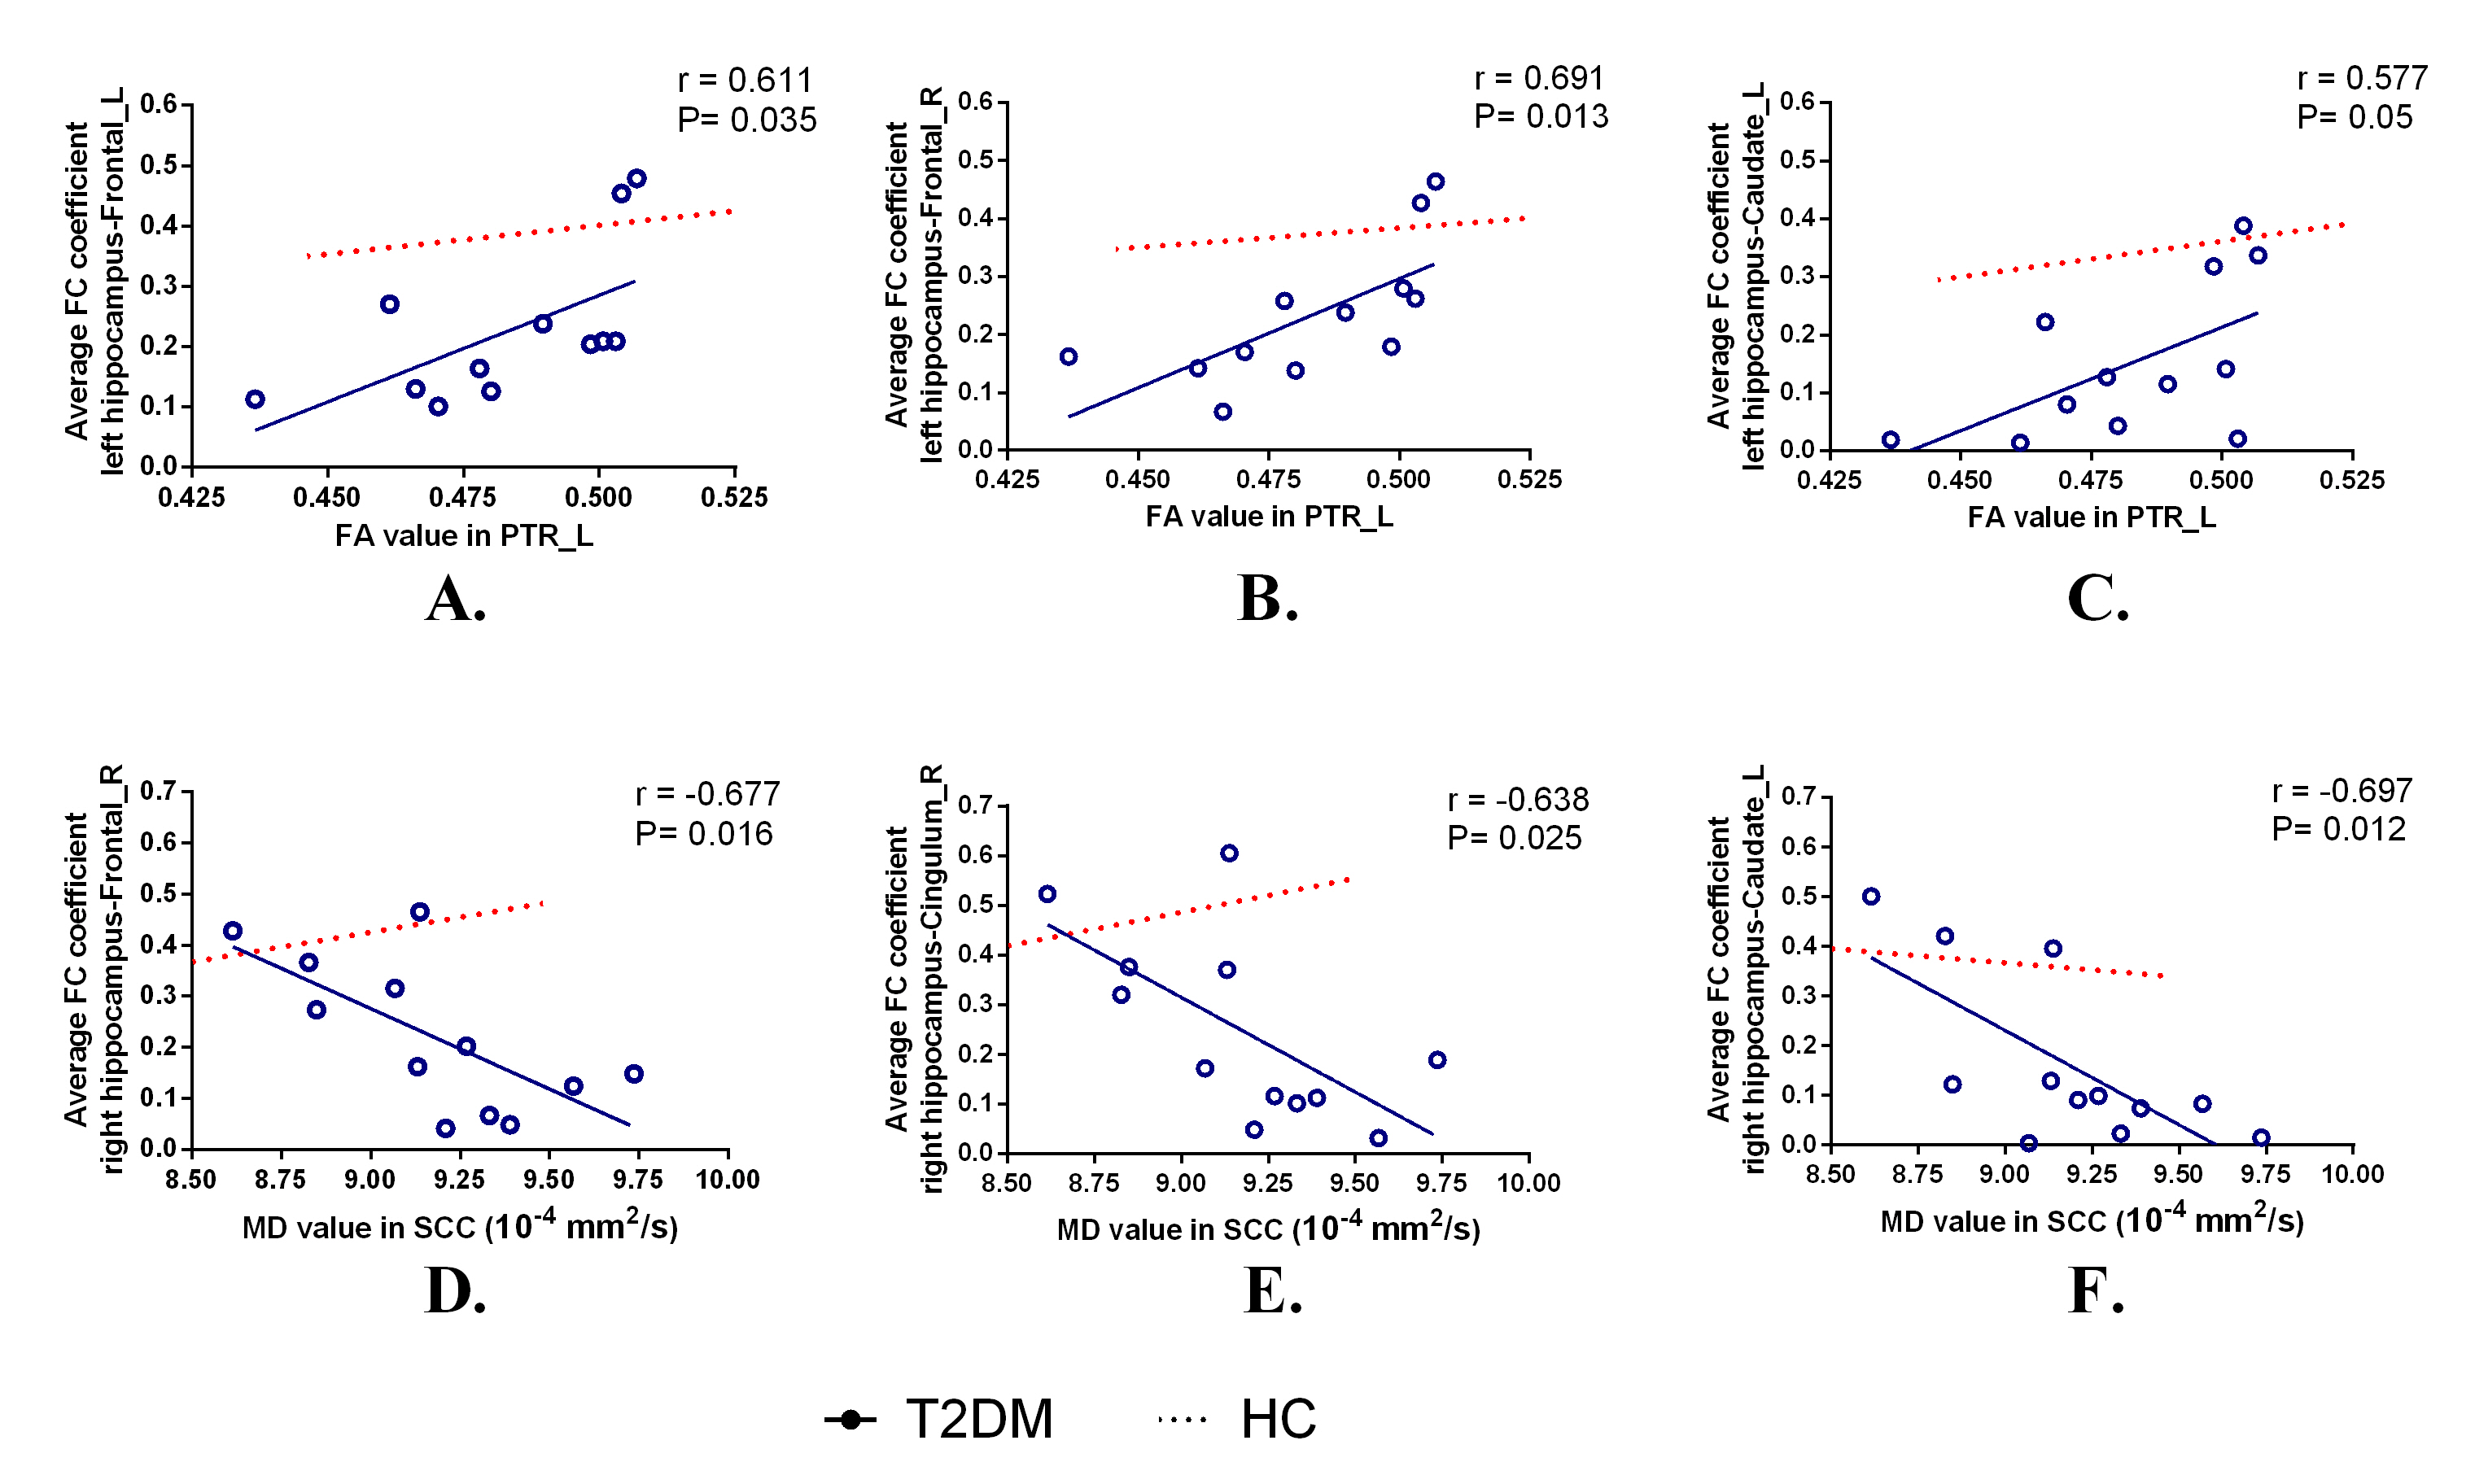
TBSS analyses revealed significantly decreased FA and increased MD values in widespread WM tracts in T2DM (P < 0.05, FWE corrected) (Fig. 1C), especially including body of corpus callosum (BCC), splenium of corpus callosum (SCC), cingulum, anterior coronal radiate (ACR), posterior coronal radiate (PCR), posterior thalamic radiation (PTR), tapetum (Fig. 1A-B). Rs-fMRI analysis showed that decreased of hippocampal FC among several brain regions, especially in the bilateral anterior cingulate cortices, olfactory cortices, caudate nucleus, and frontal cortices (P < 0.05, AlphaSim corrected). Figure 3 illustrates the mean FA value of left PTR were significantly positive correlation with decreased FC coefficients between the left hippocampal and bilateral frontal lobes and left cingulum, respectively (Fig. 3A-C); the mean MD values of SCC were significantly negative correlation with decreased FC between right hippocampal region and right frontal lobe, right cingulum, and left caudate (Fig. 3D-F). Compared with T2DM group, the correlation were vanished in the control group.Discussion and Conclusion
The study showed brain microstructure and hippocampal FC alterations in T2DM patients without MCI, and WM changes like to determine different functions. DTI combined rs-fMRI technology can be more objective to show the brain changes prior to MCI in patients with T2DM.Acknowledgements
The authors would like to acknowledge all participating patients. And we would like to thank Department of neurology, Xuan Wu Hospital, Capital Medical University, Beijing, for providing the T2DM patients and the clinical data.References
1. IDF Diabetes Atlas - Seventh Edition. http://www.diabetesatlas.org/. 2015.
2. Reijmer, Y.D., et al., Microstructural white matter abnormalities and cognitive functioning in type 2 diabetes: a diffusion tensor imaging study. Diabetes Care, 2013. 36(1): p. 137-44.
3. Mayeda, E.R., R.A. Whitmer, and K. Yaffe, Diabetes and cognition. Clin Geriatr Med, 2015. 31(1): p. 101-15, ix.
4. Qiu, C., et al., Diabetes, markers of brain pathology and cognitive function: the Age, Gene/Environment Susceptibility-Reykjavik Study. Ann Neurol, 2014. 75(1): p. 138-46.
5. Greicius, M., Resting-state functional connectivity in neuropsychiatric disorders. Curr Opin Neurol, 2008. 21(4): p. 424-30.
6. Zhou, H., et al., Impairments in cognition and resting-state connectivity of the hippocampus in elderly subjects with type 2 diabetes. Neurosci Lett, 2010. 473(1): p. 5-10.
7. Tuligenga, R.H., et al., Midlife type 2 diabetes and poor glycaemic control as risk factors for cognitive decline in early old age: a post-hoc analysis of the Whitehall II cohort study. Lancet Diabetes Endocrinol, 2014. 2(3): p. 228-35.
Figures