5407
A Comparison of BOLD Signal Amplitude and Electrical Activity During Task Performance in MS and Healthy Control Subjects: Evidence of Neurovascular Decoupling1Imaging Institute, Cleveland Clinic, Cleveland, OH, United States, 2Neurlogic Institute, Cleveland Clinic, Cleveland, OH, United States
Synopsis
Recent reports indicate that cerebrovascular reactivity (CR) may be impaired in multiple sclerosis (MS). Here we report initial studies to use simultaneous measurements of electroencephalography (EEG) and BOLD during performance of a motor task. Using EEG-derived predictors of BOLD response, we show that, while EEG robustly predicts the amplitude of the BOLD signal in healthy control subjects, the estimation is very poor in MS patients. This could be direct evidence of cerebrovascular decoupling of the BOLD signal in MS.
Purpose
It is
known that multiple sclerosis results in decreased cerebral metabolic rate of
oxygen and blood flow1, 2. Both of these are critical elements in
cerebrovascular reactivity (CR) to neuronal activation. Using simultaneous
BOLD/ASL, we previously measured BOLD activation during a visual task and
cerebrovascular reactivity using a hypercapnia challenge in a cohort of
multiple sclerosis (MS) patients and matched control subjects3. Here we use simultaneous
scalp-recordings of electrical activity to model the predicted BOLD response
based on previously published transfer functions4, 5. We compare the robustness of the methodology to
predict the BOLD signal in healthy subjects and age and gender matched MS
patients. Our results indicate that the recorded electrical activity does not
show the same relationship to measured BOLD activity in healthy controls and MS
patients.Methods
Data were acquired in six healthy subjects (age 49.7yo, 2 male), and six MS patients (EDSS: mean 4.7, age, 51.4yo, 2 male). Simultaneous EEG-fMRI was acquired using a 96 channel MRI-compatible EEG system (Brain Products, Germany) and a Siemens 3T Prisma (Erlangen, Germany) with a 32 receive channel head coil.
MR images were acquired using a dual-echo ASL sequence, which provides a perfusion weighted signal from the first echo and a BOLD weighted signal form the second echo6. In 7:30 of scan time, and 4 ½ cycles of 32 sec ON/OFF bilateral complex finger tapping was performed. During this time, EEG data were acquired as well.
Data Analysis
EEG Analysis: The EEG data were corrected for scanner artifacts using the MRI master clock signal and volumetric trigger signal, then corrected for ballistocardiogram artifact using an additional ECG signal. Data was decomposed with principal component analysis and the first component selected (linear correlation with appropriate C3/C4 signals was > 0.9, confirming good projection to a cortical loading relevant for the experiment). Component was filtered to various canonical EEG bands (alpha, beta, delta, theta, gamma) using a Morlet transform.
In order to relate the observed electrical activity to BOLD or CBF during task performance, it is necessary to derive a metric from the EEG signal to assess total electrical power during the task compared to rest. This is done by applying a transfer function to translate the observed electrical activity into a timeseries of total power at the temporal resolution of the BOLD measurement. We tested a number of candidates, including each of the EEG band power normalized to total power, as well as the three transfer functions proposed by by Rosa et al.5.
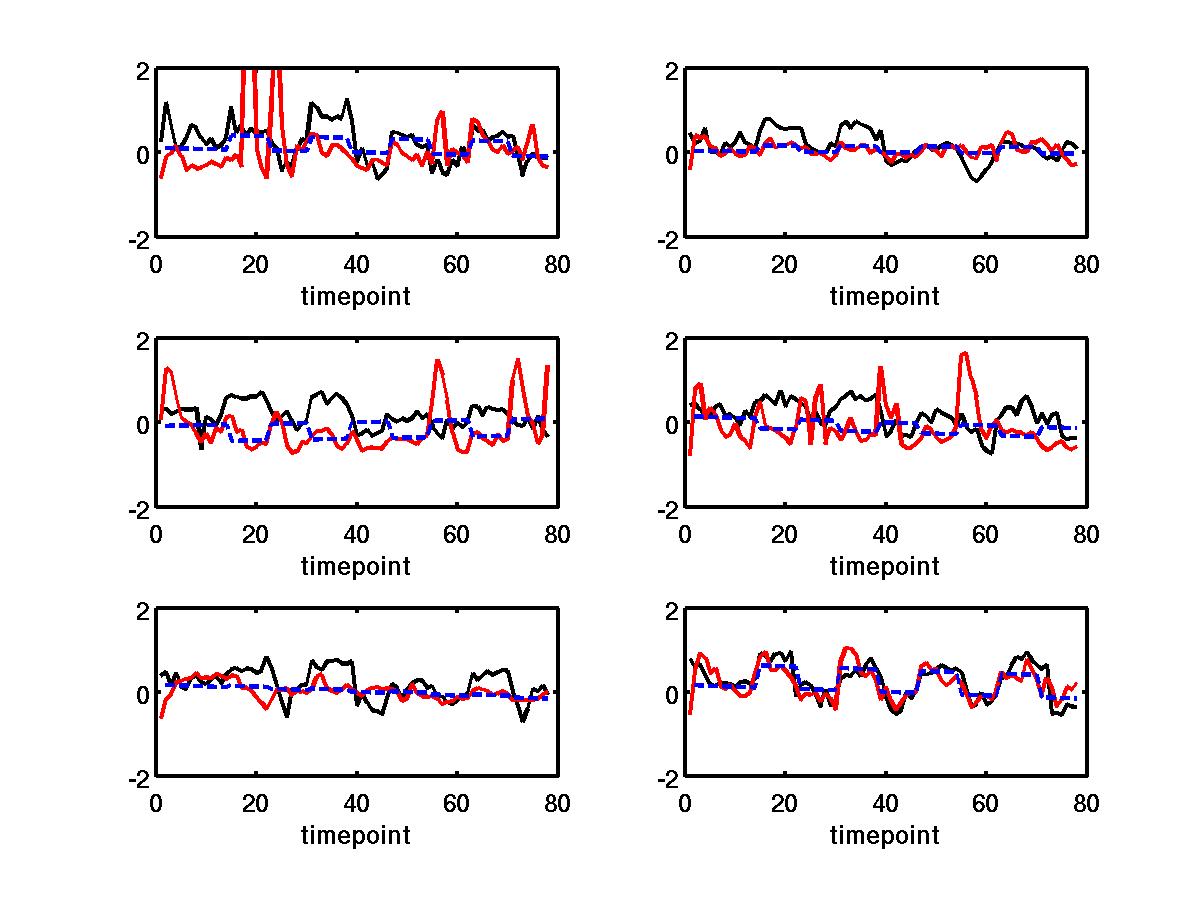
BOLD-ASL analysis: Briefly, the first 4 volumes from each ASL and BOLD time series are discarded. Perfusion-weighted images are constructed by performing a running subtraction of consecutive control and tagged images using the first acquired echo in each volume. BOLD-weighted images are constructed by performing a running average of the BOLD-weighted second echo. The data were retrospectively motion corrected. Resulting BOLD, ASL, and EEG predictors were least-squares fit to a boxcar function representing the paradigm design (see Fig 1). The amplitude of the response for each was a free parameter in the fit.
Results
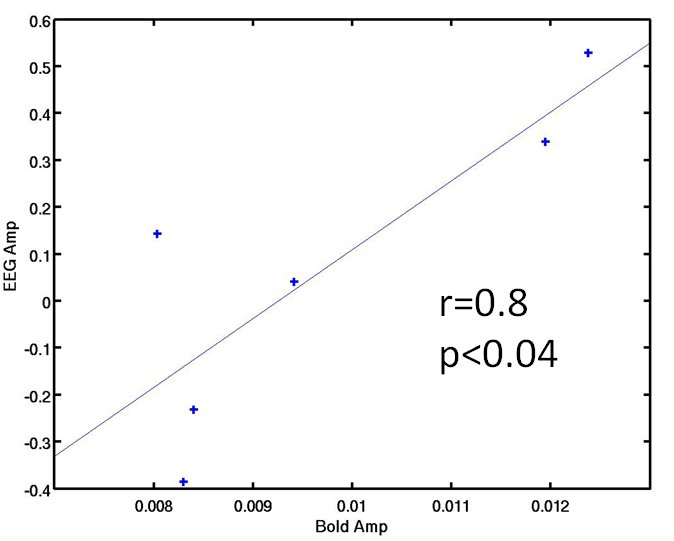
The EEG predictor that performed best at both predicting the temporal BOLD response and amplitude in healthy controls was normalized gamma band power (see Fig 1). Figure 1 shows the simultaneous BOLD and EEG transfer function during alternating finger tapping and rest. There is a good correspondence in the onset of activation for all signals. In addition, Figure 2 shows that there was a significant correlation between the fit amplitude for the EEG predictor and the BOLD timeseries data (r=0.8, p<0.04).
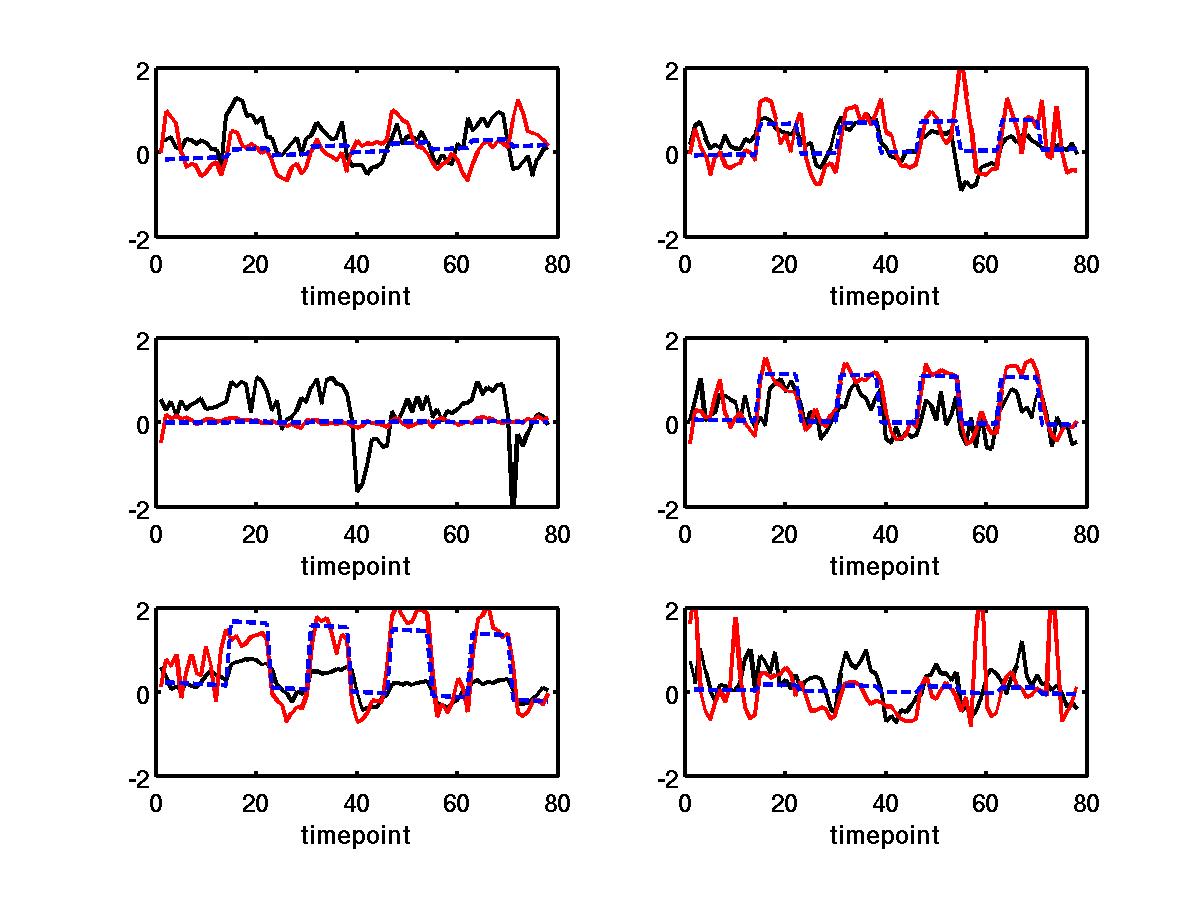
For MS patients, the normalized gamma power predictor represented the temporal BOLD response well (see Fig 3), but the fit amplitude did not significantly correlate with the fit BOLD amplitude.
Discussion and Conclusion
We
demonstrate that it is possible to derive a metric based on brain electrical
activity that is a good predictor of the BOLD response during task performance
in healthy controls, both temporally within a subject and the fit amplitude across
subjects. This is potentially a very important tool in validating the
relationship between true underlying neuronal activity during task perfomance and BOLD response
in patient populations. We show that, although the EEG predictor resulted in a timeseries that has a high temporal correlation to the BOLD timeseries in
MS, the amplitude of the EEG predictor across MS subjects is not correlated to
the BOLD amplitude. This may be a reflection of previous reports of
cerebrovascular decoupling in the BOLD response in MS3, 7, 8.Acknowledgements
This work was supported by a grant from the National Institutes of Health.References
1. Brooks, DJ, Leenders, KL, Head, G, Marshall, J, Legg, NJ, Jones, T: Studies on regional cerebral oxygen utilisation and cognitive function in multiple sclerosis. Journal of neurology, neurosurgery, and psychiatry, 47, 1182-91, (1984).
2. Inglese, M, Adhya, S, Johnson, G, Babb, JS, Miles, L, Jaggi, H, Herbert, J, Grossman, RI: Perfusion magnetic resonance imaging correlates of neuropsychological impairment in multiple sclerosis. J Cereb Blood Flow Metab, 28, 164-71, (2008).
3. Lowe, MJ, Shin, W, Bermel, R, Stone, L, Phillips, MD, BOLD, Blood Flow and Hypercapnic Challenge Reveals Cerebrovascular Decoupling in Multiple Sclerosis, in "Proc., Internation Society for Magnetic Resonance in Medicine 23rd Annual Meeting, Toronto, Canada, 2015," p.
4. Kilner, JM, Mattout, J, Henson, R, Friston, KJ: Hemodynamic correlates of EEG: a heuristic. NeuroImage, 28, 280-6, (2005).
5. Rosa, MJ, Kilner, J, Blankenburg, F, Josephs, O, Penny, W: Estimating the transfer function from neuronal activity to BOLD using simultaneous EEG-fMRI. NeuroImage, 49, 1496-509, (2010).
6. Luh, WM, Wong, EC, Bandettini, PA, Ward, BD, Hyde, JS: Comparison of simultaneously measured perfusion and BOLD signal increases during brain activation with T(1)-based tissue identification. Magn Reson Med, 44, 137-43, (2000).
7. Lowe, MJ, Koenig, KA, Zhou, X, Shin, W, Bermel, R, Stone, L, Phillips, MD, Resting State Fluctuation Amplitude Indicates Impaired Cerebrovascular Reactivity in Multiple Sclerosis, in "Proc., Internation Society for Magnetic Resonance in Medicine 23rd Annual Meeting, Toronto, Canada, 2015," p.
8. Marshall, O, Lu, H, Brisset, JC, Xu, F, Liu, P, Herbert, J, Grossman, RI, Ge, Y: Impaired cerebrovascular reactivity in multiple sclerosis. JAMA Neurol, 71, 1275-81, (2014).
Figures