5403
Simultaneous trimodal MR-flumazenil-PET-EEG imaging in a rest-task-rest design in humans1Institute of Neuroscience and Medicine 4 (INM4), Forschungszentrum Juelich GmbH, Juelich, Germany, 2Department of Psychiatry, Psychotherapy and Psychosomatics, RWTH Aachen University, Aachen, Germany, 3JARA – BRAIN – Translational Medicine, Juelich, Germany, 4TRIMAGE-consortium, Juelich, Germany, 5Department of Psychiatry, Psychotherapy and Psychosomatics, University Hospital of Psychiatry, Zurich, Switzerland, 6Institute of Neuroscience and Medicine 5 (INM5), Forschungszentrum Juelich GmbH, Juelich, Germany, 7Department of Nuclear Medicine, RWTH Aachen University, Aachen, Germany, 8Department of Neurology, RWTH Aachen University, Aachen, Germany, 9Department of Electrical and Computer Systems Engineering, and Monash Biomedical Imaging, School of Psychological Sciences, Monash University, Melbourne, Australia
Synopsis
How quickly does the human brain switch back from a task mode to the resting state condition? This question is addressed in a small sample of healthy volunteers employing a simultaneous trimodal MR-flumazenil-PET-EEG approach at 3T. Based on the fMRI results, we observe an increase in ReHo - a measure of local connectivity - coupled with a slight decrease in the binding potential of [11C] Flumazenil in the PCC which is a major hub of the default mode network; this indicates a change of the GABA-ergic driven inhibitory tonus. This is accompanied with changes in the alpha band over parietal electrodes.
Purpose
One of the salient characteristic features of the human brain is switching between task related and resting state networks. Immediately after the task, does the human brain switch back to the resting state? In this study we employed an MR-PET-EEG trimodal approach to simultaneously measure resting state fMRI, [11C] flumazenil (FMZ) PET - targeting the GABA-ergic system - and electroencephalography (EEG) investigating simultaneously the metabolic and spatio-temporal dynamics of resting state activity via a rest-task-rest design.Methods
Data acquisition: fMRI, FMZ-PET and EEG were recorded simultaneously from 4 healthy male volunteers (mean age = 26 ± 3.7 years) in a 3T hybrid MR-BrainPET system (Siemens, Germany) equipped with a 64-channel, MR compatible EEG system (Brain Products, Germany).
MR data: MPRAGE was used for structural MR imaging (TR=2250ms; TE=3.03ms; GRAPPA factor = 2). Resting state fMRI data were acquired before and after an auditory paradigm (T2*-weighted EPI sequence (TR=2200ms; TE=30ms; FOV200mm; 6 minutes/eyes closed).
PET data: 407.5 ± 28.20 MBq of [11C]flumazenil injected via bolus-constant infusion (kBol=1.8/h), list mode acquisition (100 minutes), iteratively reconstructed using PRESTO algorithm1, (30 frames, 153 slices, voxel 1.25 mm isotropic, template-based attenuation correction using MPRAGE).
EEG data: EEG signals were recorded simultaneously using a 64-channel MR compatible EEG system (Brain Products GmbH, Germany). EEG Signals were sampled at 5000 Hz, with a bandwidth of 0.016 to 250 Hz.
Data Processing:
fMRI: Regional Homogeneity (ReHo) was computed for pre- and post-task resting state conditions for every voxel and its 26 neighbouring voxels2 after pre-processing (normalisation (MNI 3mm), slice timing, motion, nuisance signal correction, temporal filtering 0.01 to 0.1 Hz). Smoothing (6 mm) was performed and ReHo measures were converted to standard Z scores. Mean ReHo values of the posterior cingulate cortex (PCC) were extracted.
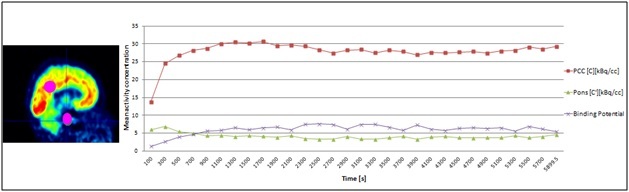
PET: PET images were smoothed (3mm), motion corrected and the binding potential was calculated for the PCC (by defining a 10 mm spherical ROI) using PMOD software package (Version 3.5). The binding potential (BP) of FMZ was calculated as (C-C’)/C, where C denotes the activity concentration in an area of high GABA–receptor density (PCC) and C’ denotes activity concentration in an area of very low receptor density (Pons).
EEG: EEG data were pre-processed using EEGLAB3 and exported to MNE-Python4 for further analysis. Gradient5,6, cardioballistic and ocular artefacts7 were corrected. Bad channels were removed and data were resampled to 1000 Hz and low pass filtered with a cut-off frequency of 70 Hz. Further artefact components were identified and removed using the MARA toolbox8. The preprocessed resting state data were segmented into 5-second epochs. The power spectral density (PSD) for each individual epoch was calculated using Welch’s method for a frequency range of 1 to 20Hz. Electrodes were grouped into representative brain regions and virtual electrodes were constructed from these electrodes by averaging. Permutation cluster tests9, as implemented in MNE-Python, were performed between PSDs of pre- and post- task conditions. Clusters with strong differences in PSD values were identified and correction for multiple comparisons at cluster level was performed using 10 000 permutations.
Results
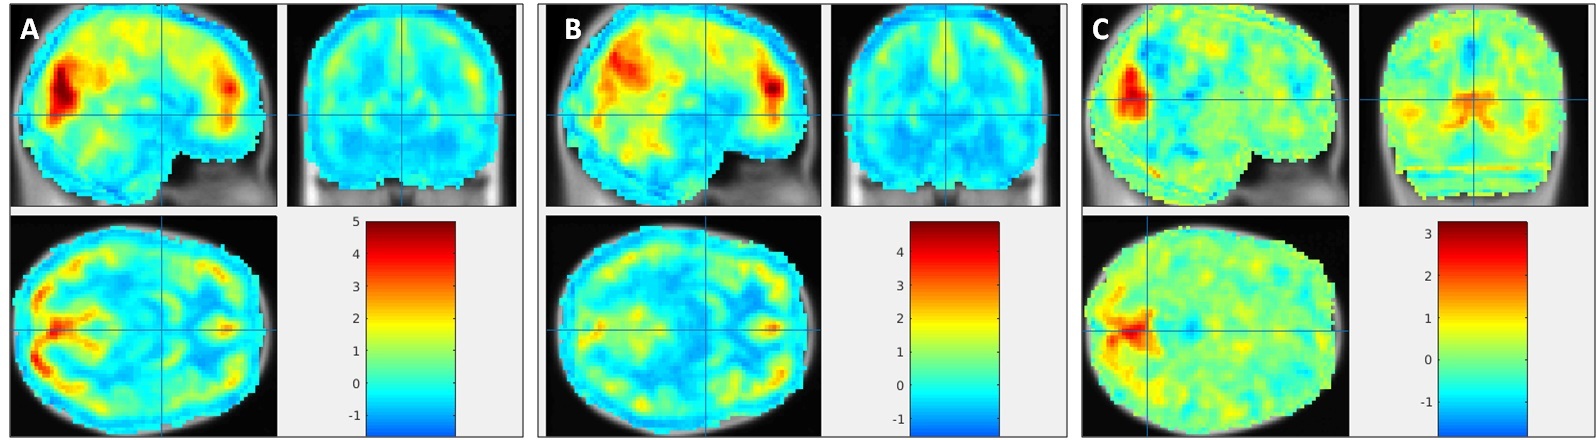
fMRI – ReHo: Mean ReHo values of PCC region of post task resting state showed increased values comparing to pre task resting sate .
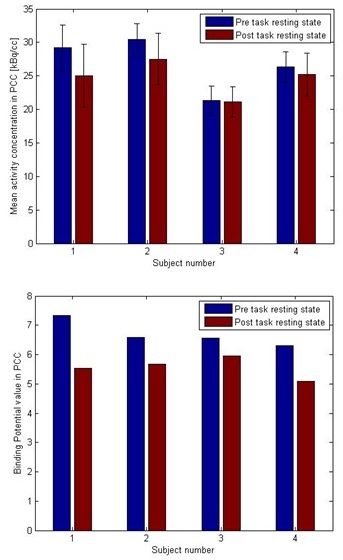
PET: In all four subjects the mean activity concentration (KBq/cc) and the binding potential value in the PCC slightly decreased in the post task resting condition (Fig. 3).
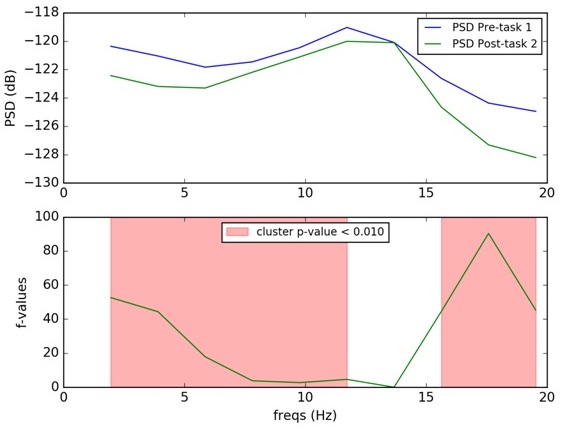
EEG: Cluster of parietal electrodes (CP1, CPz, CP2, P1, Pz, P2, PO3, POz, PO4) showed significant differences in PSD values in the parietal in the alpha band (Fig. 4).
Discussion
The presented results show the feasibility of the simultaneous trimodal approach. Given the small sample size results are discussed as first trends in need of replication in a much larger sample. ReHo, as a measure of local connectivity, shows an increased value in the post task resting state condition indicating that the PCC as a main hub of the default mode network did not switch back to resting state immediately after the task. Significant changes in EEG alpha frequency band underpin this statement. Binding potential values from FMZ-PET image indicate a trend for a decrease during post task resting condition, indicating a mutual change within the inhibitory GABAergic tonus.Conclusion
These explorative pilot data indicate that the PCC as a major hub of the default mode network does not immediately switch back to the resting state condition after the end of the task as supported by the EEG and PET results.Acknowledgements
We thank Andrea Muren, Magdalene Vögeling, Cornelia Frey, Silke Frensch and Suzanne Schaden for their technical assistance.References
1. Scheins, J. J., Herzog, H. & Shah, N. J. Fully-3D PET Image Reconstruction Using Scanner-Independent , Adaptive Projection Data and Highly Rotation-Symmetric Voxel Assemblies. IEEE Trans. Med. Imaging 30, 879–892 (2011).
2. Zang, Y., Jiang, T., Lu, Y., He, Y. & Tian, L. Regional homogeneity approach to fMRI data analysis. 22, 394–400 (2004).
3. Delorme, A. & Makeig, S. EEGLAB: An open source toolbox for analysis of single-trial EEG dynamics including independent component analysis. J. Neurosci. Methods (2004). doi:10.1016/j.jneumeth.2003.10.009.
4. Gramfort, A. et al. MEG and EEG data analysis with MNE-Python. 7, 1–13 (2013).
5. Niazy, R. K., Beckmann, C. F., Iannetti, G. D., Brady, J. M. & Smith, S. M. Removal of FMRI environment artifacts from EEG data using optimal basis sets. Neuroimage 28, 720–737 (2005).
6. Allen, P. J., Josephs, O. & Turner, R. A method for removing imaging artifact from continuous EEG recorded during functional MRI. Neuroimage 12, 230–239 (2000).
7. Go, G. et al. Automatic Removal of Ocular Artifacts in the EEG without an EOG Reference Channel. (2006).
8. Winkler, I., Haufe, S. & Tangermann, M. Automatic Classification of Artifactual ICA- Components for Artifact Removal in EEG Signals. 1–15 (2011).
9. Maris, E. & Oostenveld, R. Nonparametric statistical testing of EEG- and MEG-data. 164, 177–190 (2007).
Figures