5401
Low frequency activity from somatosensory thalamus propagates brain-wide and modulates top-down visual processing1Laboratory of Biomedical Imaging and Signal Processing, The University of Hong Kong, Hong Kong, Hong Kong, 2Department of Electrical and Electronic Engineering, The University of Hong Kong, Hong Kong, Hong Kong
Synopsis
Top-down/descending control is a critical stage in sensory processing that underlies numerous cognitive processes. Recent studies uncovered the prevalence of converging long-range networks across multiple sensory modalities as anatomical substrates that likely mediate sensory top-down control. Using an optogenetic fMRI technique that we recently developed to examine patterns of large-scale brain-wide interactions mediated by the somatosensory
Purpose
Sensory processing is an important attribute of the mammalian brain. It involves a dynamic and interactive network of ascending projections (periphery to cortex) to route signals from the surroundings and descending projections (cortex to periphery) to control the ascending information flow1. Despite the ubiquitous nature of an external sensory stimulus, our knowledge of the stages involved in sensory processing, specifically top-down/descending control of ascending signals is incomplete. Furthermore, a recent study2 identified long-range projections from the frontal cortex to sensory regions, and between sensory cortices as anatomical substrates mediating top-down processing. This indicates the involvement of other non-associated sensory and non-sensory regions through numerous long-range projections. Hence, it is imperative that we approach the study of sensory top-down processing, specifically how it is facilitated, by employing a multi-modal approach and encompassing aspects of large-scale brain-wide interactions. Using optogenetic fMRI in combination with electrophysiological recordings, we demonstrated spatiotemporally specific patterns of large-scale brain-wide interactions that are mediated by the somatosensory thalamo-cortical-thalamic network at low frequency3. Finally, we addressed whether propagating low frequency activity underlying such interactions could play a role in modulating top-down control of visual processing.Methods
Animal preparation: AAV5-CaMKIIα::ChR2(H134R)-mCherry was injected to ventral posteromedial thalamus (VPM) of adult rats (n=15, 200-250g, male, SD strain). Four weeks after injection, an optical fiber cannula (d=450μm) was implanted at the injection site to deliver optical stimulation. Optical fiber cannulas were made opaque to prevent light leakage that may cause undesired visual stimulation. All experiments were performed under 1.0% isoflurane.
Optogenetic fMRI (n=6) and In-vivo Electrophysiological Experiment (n=3): For optogenetic stimulation, blue (473nm) light was delivered to VPM at 1Hz (10% duty cycle, 40mW/mm2) in a block design paradigm of 20s on and 60s off periods.
Visual and Optogenetic Stimulation (n=6): For binocular visual stimulation, blue light was presented via a separate optical patch cable at 20mm in front of both eyes, with power calibrated at 0.5mW. For optogenetic stimulation (OG-On), blue light was presented continuously at 1Hz (10% duty cycle, 40mW/mm2). Visual stimulation (1Hz and 10% duty cycle) was presented in a block design paradigm of 20s on and 40s off periods. Each fMRI session included 4 blocks of visual stimulation. Fifteen fMRI sessions were performed on each animal, five before (Baseline), five during (OG-On) and five after (OG-Off) optogenetic stimulation.
fMRI Acquisition and Analysis: fMRI data was acquired at 7T using GE-EPI (FOV=32×32mm2, matrix=64×64, α=56°, TE/TR=20/1000ms, 16 contiguous slices with 1mm thickness). Standard fMRI preprocessing was performed before GLM analysis was applied to identify significant BOLD responses (P<0.001).
LFP recordings and analysis: Simultaneous LFP recordings at five brain regions were performed using single tungsten microelectrodes (1MΩ; digitized at 30kHz). Recording data were downsampled to 2kHz, band-pass filtered (1-300Hz) and notch filtered for 50Hz.
Results
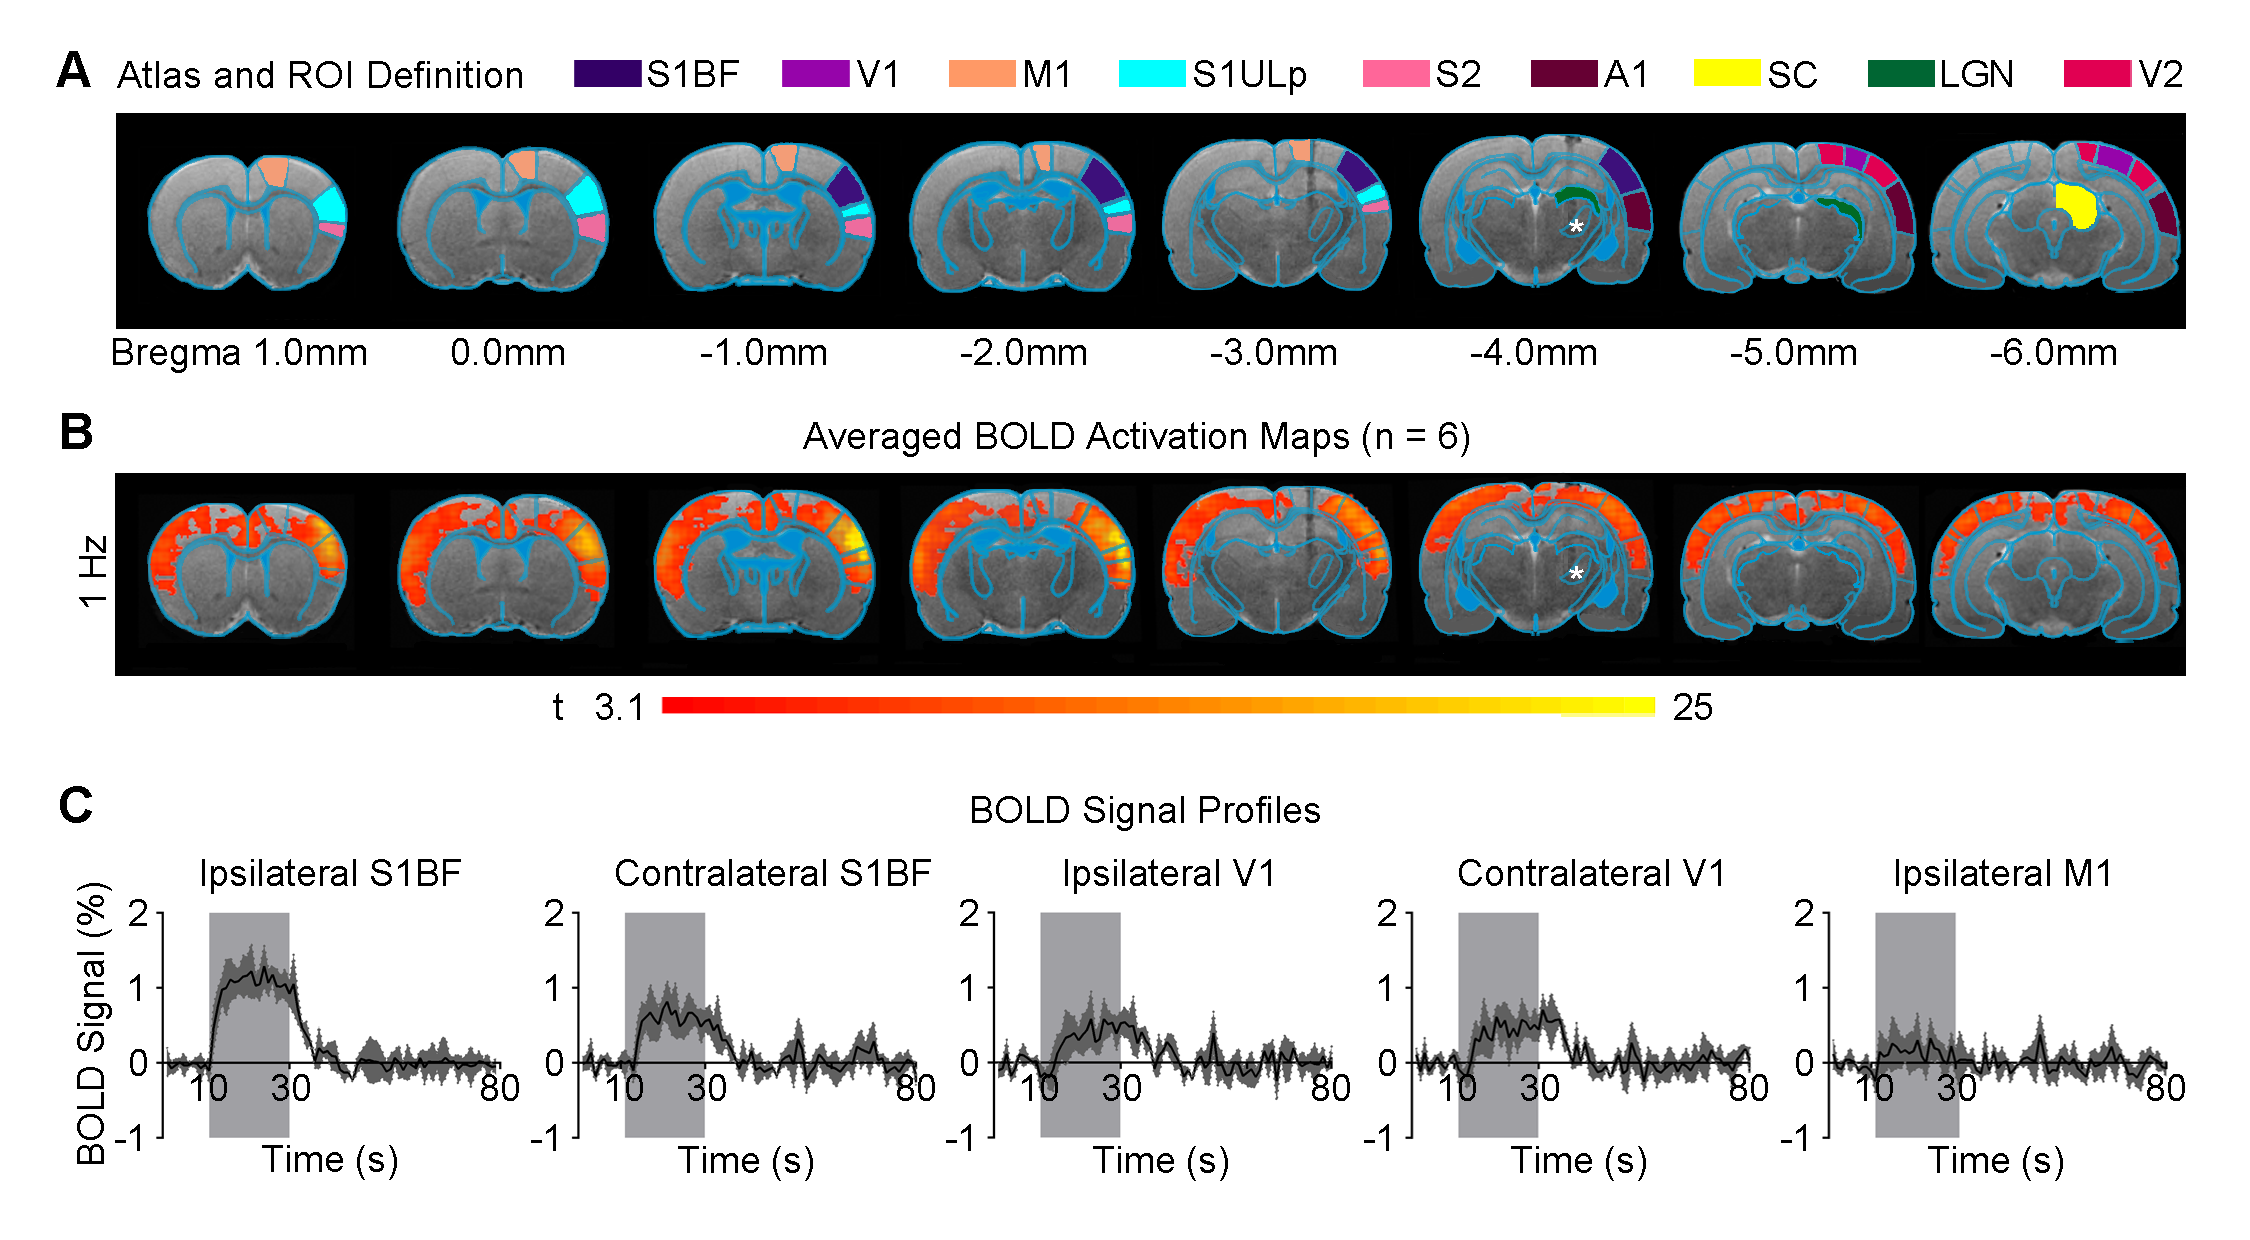
Figure 1 shows that 1 Hz optogenetic excitation of VPM thalamocortical excitatory neurons evoked brain-wide positive BOLD activations in remote and bilateral sensory cortices (e.g., primary visual cortex, V1).
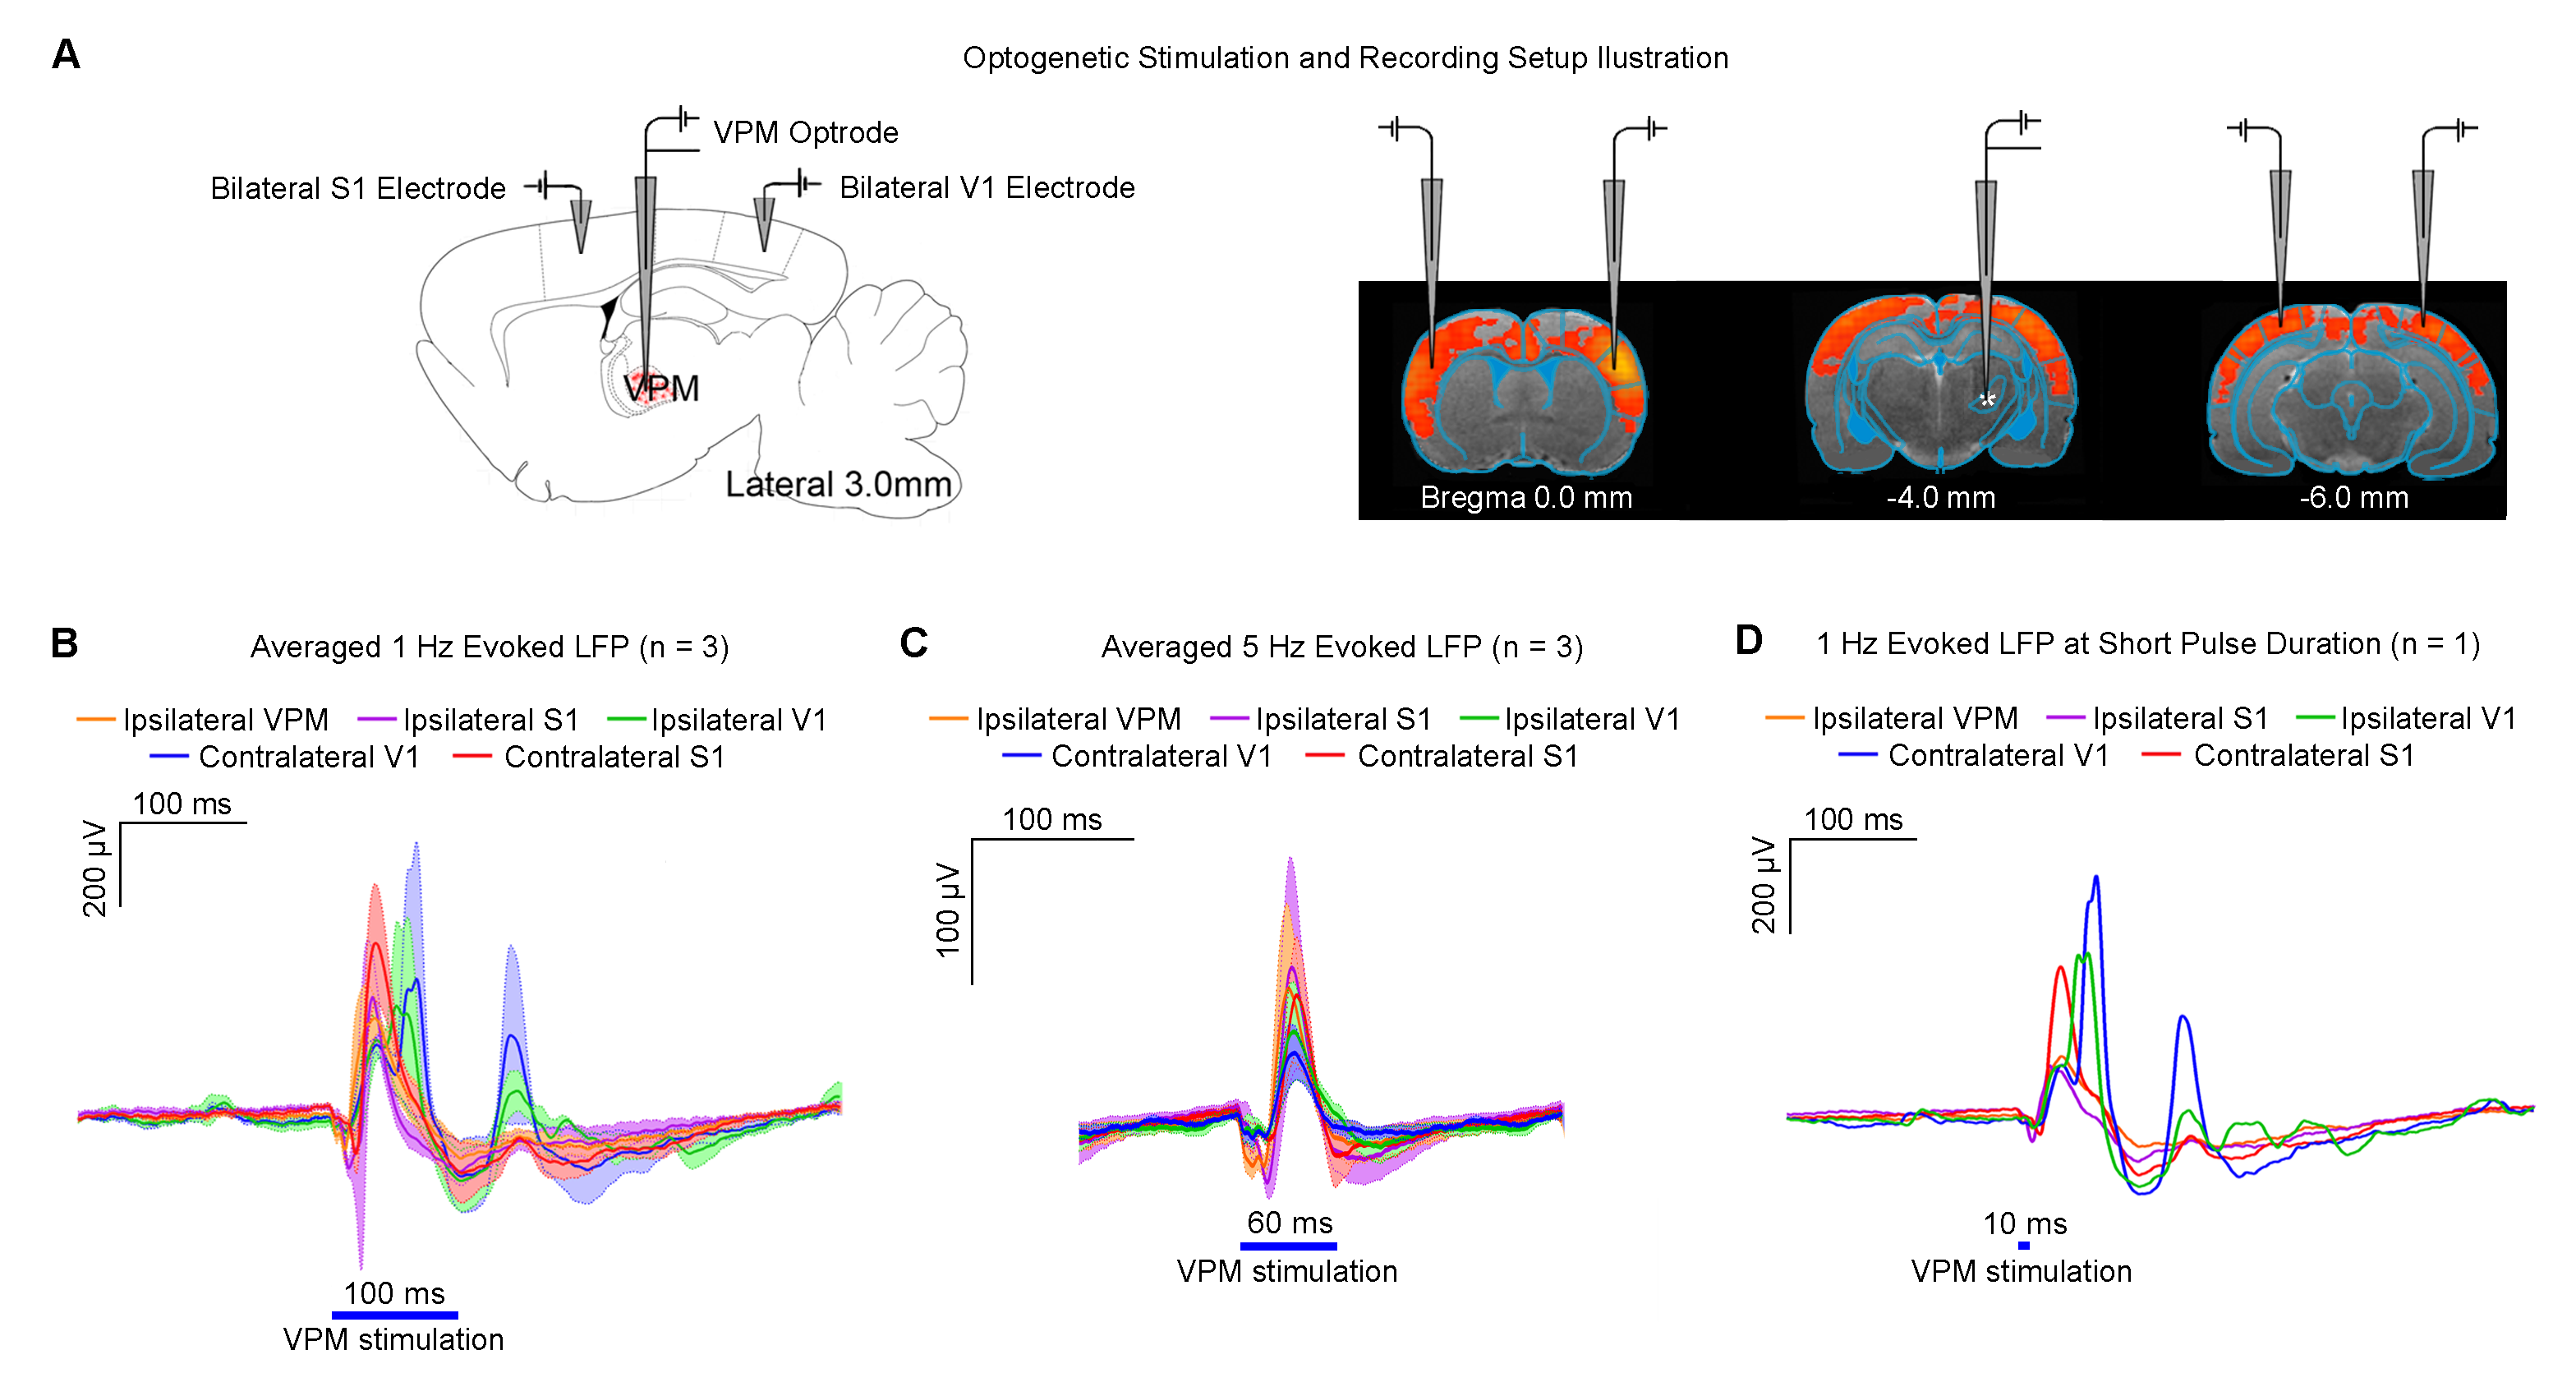
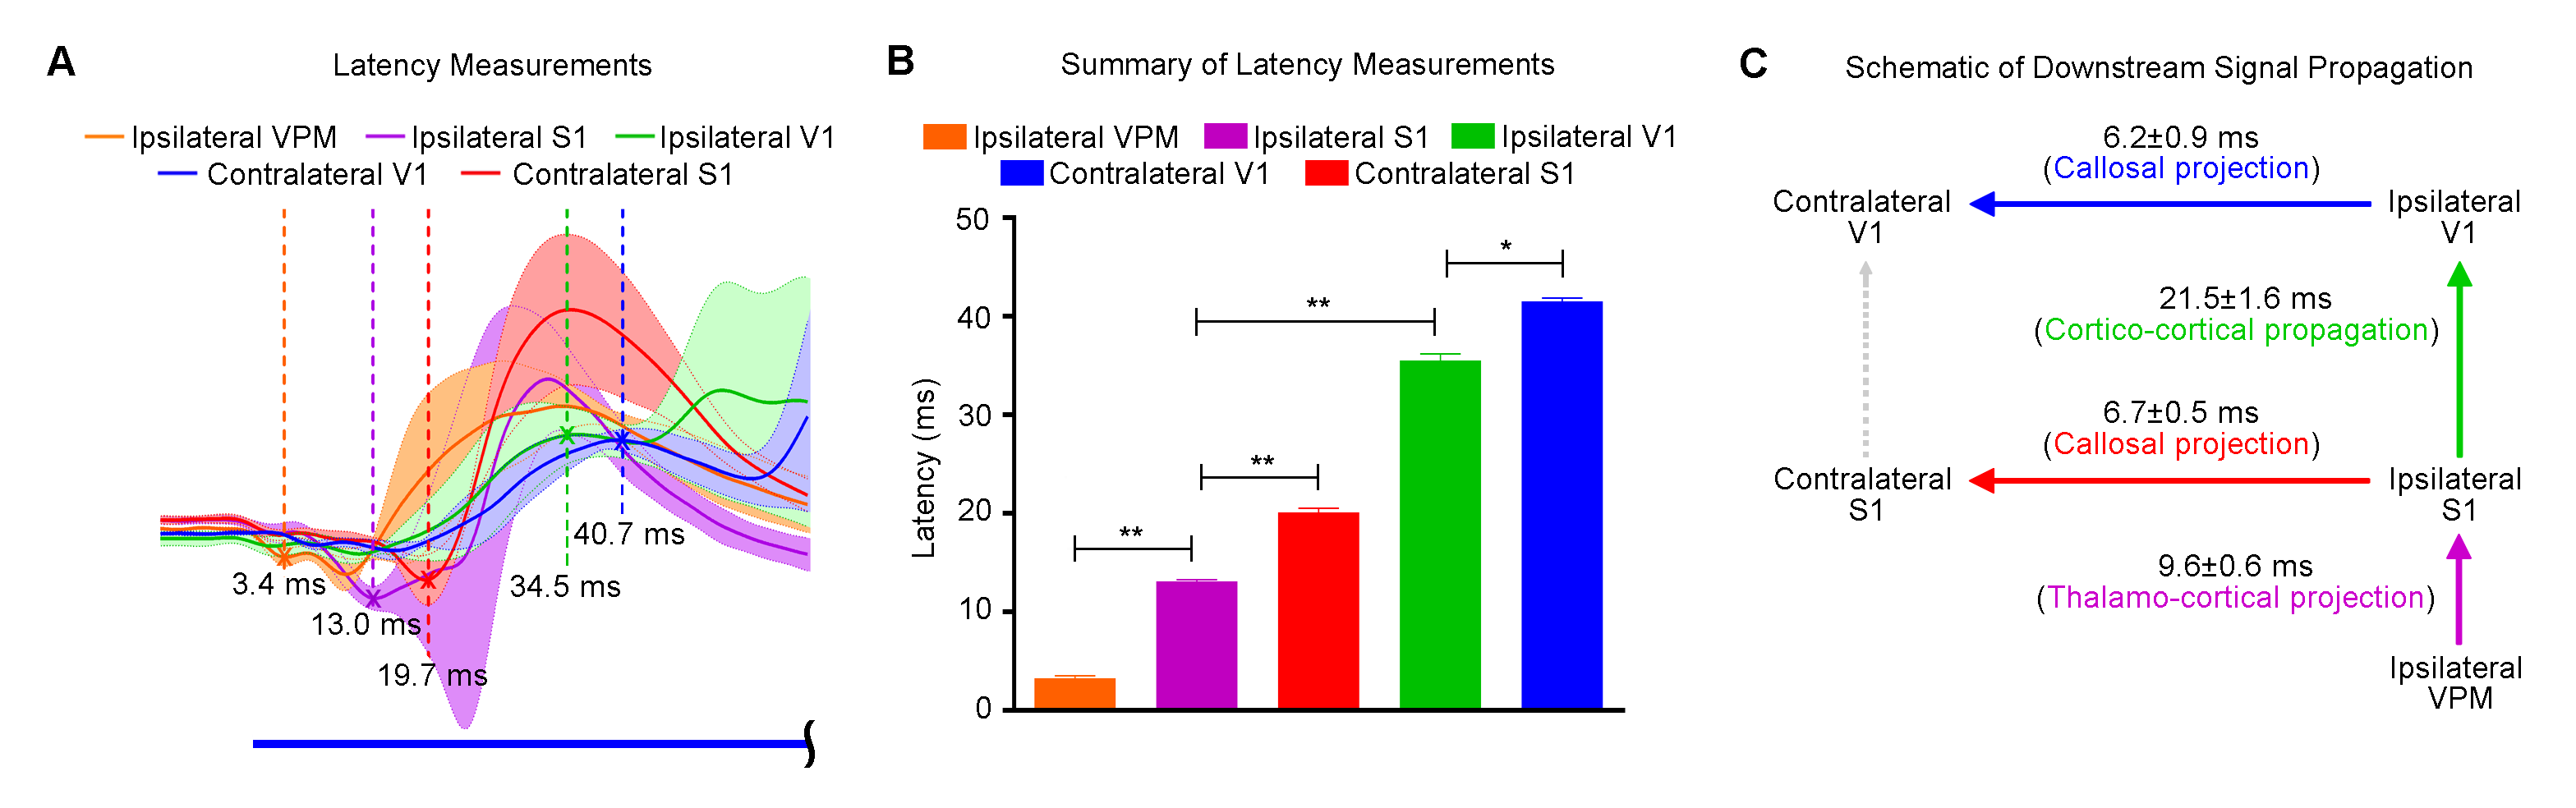
Figures 2 and 3 demonstrate the downstream propagation of low frequency neuronal activity as measured by LFP, underlying the BOLD activations during 1Hz VPM stimulation. In particular, secondary LFP peaks were observed in bilateral V1 after the primary optogenetically-evoked response at 1Hz, but not 5Hz.
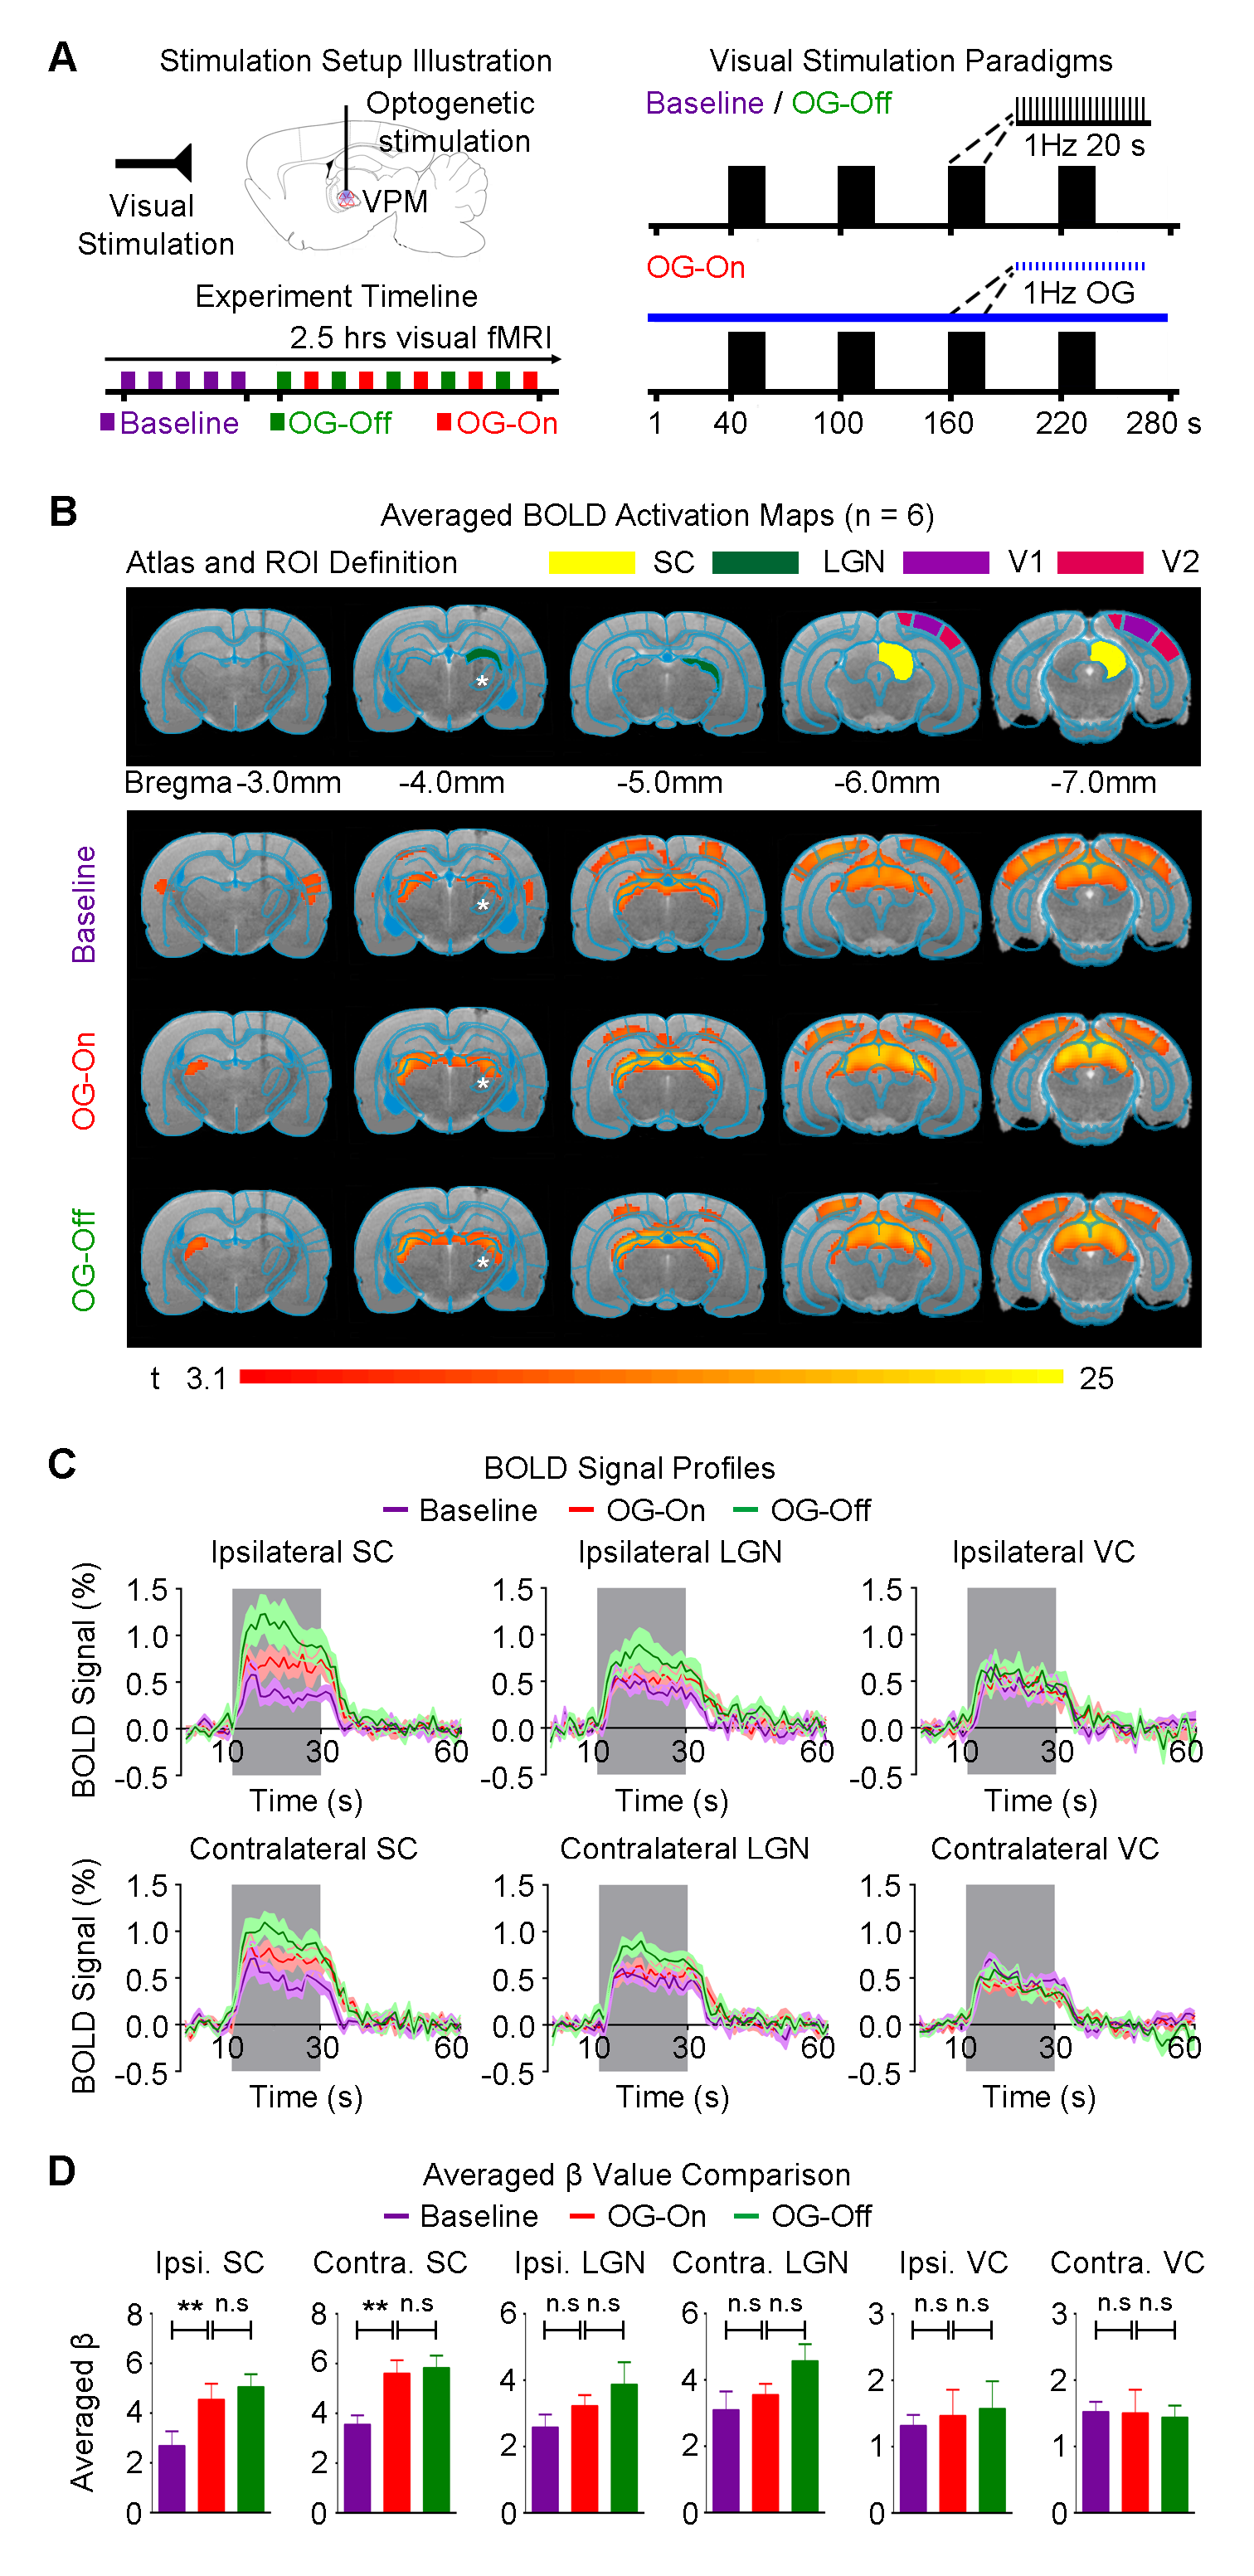
Figure 4 presents BOLD activations to binocular visual stimulation. Response amplitude in ipsilateral and contralateral superior colliculus (SC) to the visual stimulus were enhanced significantly during continuous 1Hz optogenetic stimulation, which remained elevated after cessation of optogenetic stimulation (P<0.05). Note that the visual thalamus, lateral geniculate nucleus (LGN) also displayed the similar trend of enhancement.
Discussion and Conclusion
Our results clearly demonstrate the importance of encompassing large-scale brain-wide interactions in the investigation of top-down control in sensory processing. Specifically, brain-wide propagation of low frequency activity (~1Hz) in cortical regions initiated by optogenetic excitation of the VPM thalamocortical excitatory neurons enhances SC BOLD responses to visual stimulation. Averaged LFPs evoked at 1Hz (Figure 2B) revealed activity that typically persisted for 200-300ms, which included strong synchronous secondary peaks long after the primary peaks, particularly in bilateral V1. Such patterns of low frequency activity draw many similarities to slow oscillations, which generate large, synchronous and propagating neuronal membrane-potential fluctuations across excitatory and inhibitory neurons throughout brain-wide networks4-6. Taken together, our optogenetic fMRI findings reveal the functional roles of brain-wide propagating low frequency activity in facilitating top-down visual processing via cortico-tectal projections to SC. Large view BOLD fMRI, together with optogenetic manipulation of specific neuronal activity, provides a powerful platform to interrogate the complex long-range brain circuits and their functions.Acknowledgements
No acknowledgement found.References
1. Knudsen, E.I. Fundamental components of attention. Annu Rev Neurosci 30, 57-78 (2007).
2. Zhang, S., Xu, M., Chang, W.C., Ma, C., Hoang Do, J.P., Jeong, D., Lei, T., Fan, J.L. & Dan, Y. Organization of long-range inputs and outputs of frontal cortex for top-down control. Nature neuroscience (2016).
3. Leong, A.T.L., Chan, R.W., Gao, P.P., Chan, Y.S., Tsia, K.K., Yung, W.H. & Wu, E.X. Long-range projections coordinate distributed brain-wide neural activity with a specific spatiotemporal profile. Proceedings of the National Academy of Sciences of the United States of America (2016 (in press)).
4. Sheroziya, M. & Timofeev, I. Global intracellular slow-wave dynamics of the thalamocortical system. The Journal of neuroscience : the official journal of the Society for Neuroscience 34, 8875-8893 (2014).
5. Stroh, A., Adelsberger, H., Groh, A., Ruhlmann, C., Fischer, S., Schierloh, A., Deisseroth, K. & Konnerth, A. Making waves: initiation and propagation of corticothalamic Ca2+ waves in vivo. Neuron 77, 1136-1150 (2013).
6. Matsui, T., Murakami, T. & Ohki, K. Transient neuronal coactivations embedded in globally propagating waves underlie resting-state functional connectivity. Proceedings of the National Academy of Sciences of the United States of America 113, 6556-6561 (2016).
Figures