5395
Fluctuations of the EEG-fMRI correlation reflect intrinsic strength of functional connectivity in default mode network1Diagnostic Radiology, Oulu University Hospital, Oulu, Finland, 2Clinical Neurophysiology, Oulu University Hospital, Oulu, Finland, 3Oncology and Radiotherapy, Oulu University Hospital, 4Neuroscience Center, University of Helsinki
Synopsis
Resting-state networks (RSN) functional connectivity has shown to be temporally dynamic in the brain. Also the correlations between infra slow fluctuations in electroencephalography (EEG) and blood oxygen level-dependent signal have shown dynamic variability over time. Here, we used simultaneous EEG-fMRI with ultra-fast magnetic resonance encephalography to study the link between the variations of these correlations and variations in RSN functional connectivity. The results suggest that the correlation strength is markedly linked to the strength of underlying functional connectivity. This leads to low correlations when averaged over a long period, high momentary synchrony can be reached due to intrinsic RSN dynamics.
Purpose
We address the neurophysiological underpinnings of the fluctuations in the correlation between electroencephalography (EEG) and blood oxygen level dependent (BOLD) signals. We also studied whether these variations are linked to the functional connectivity strength, magnitude or noise characteristics within the default mode network (DMN).Methods
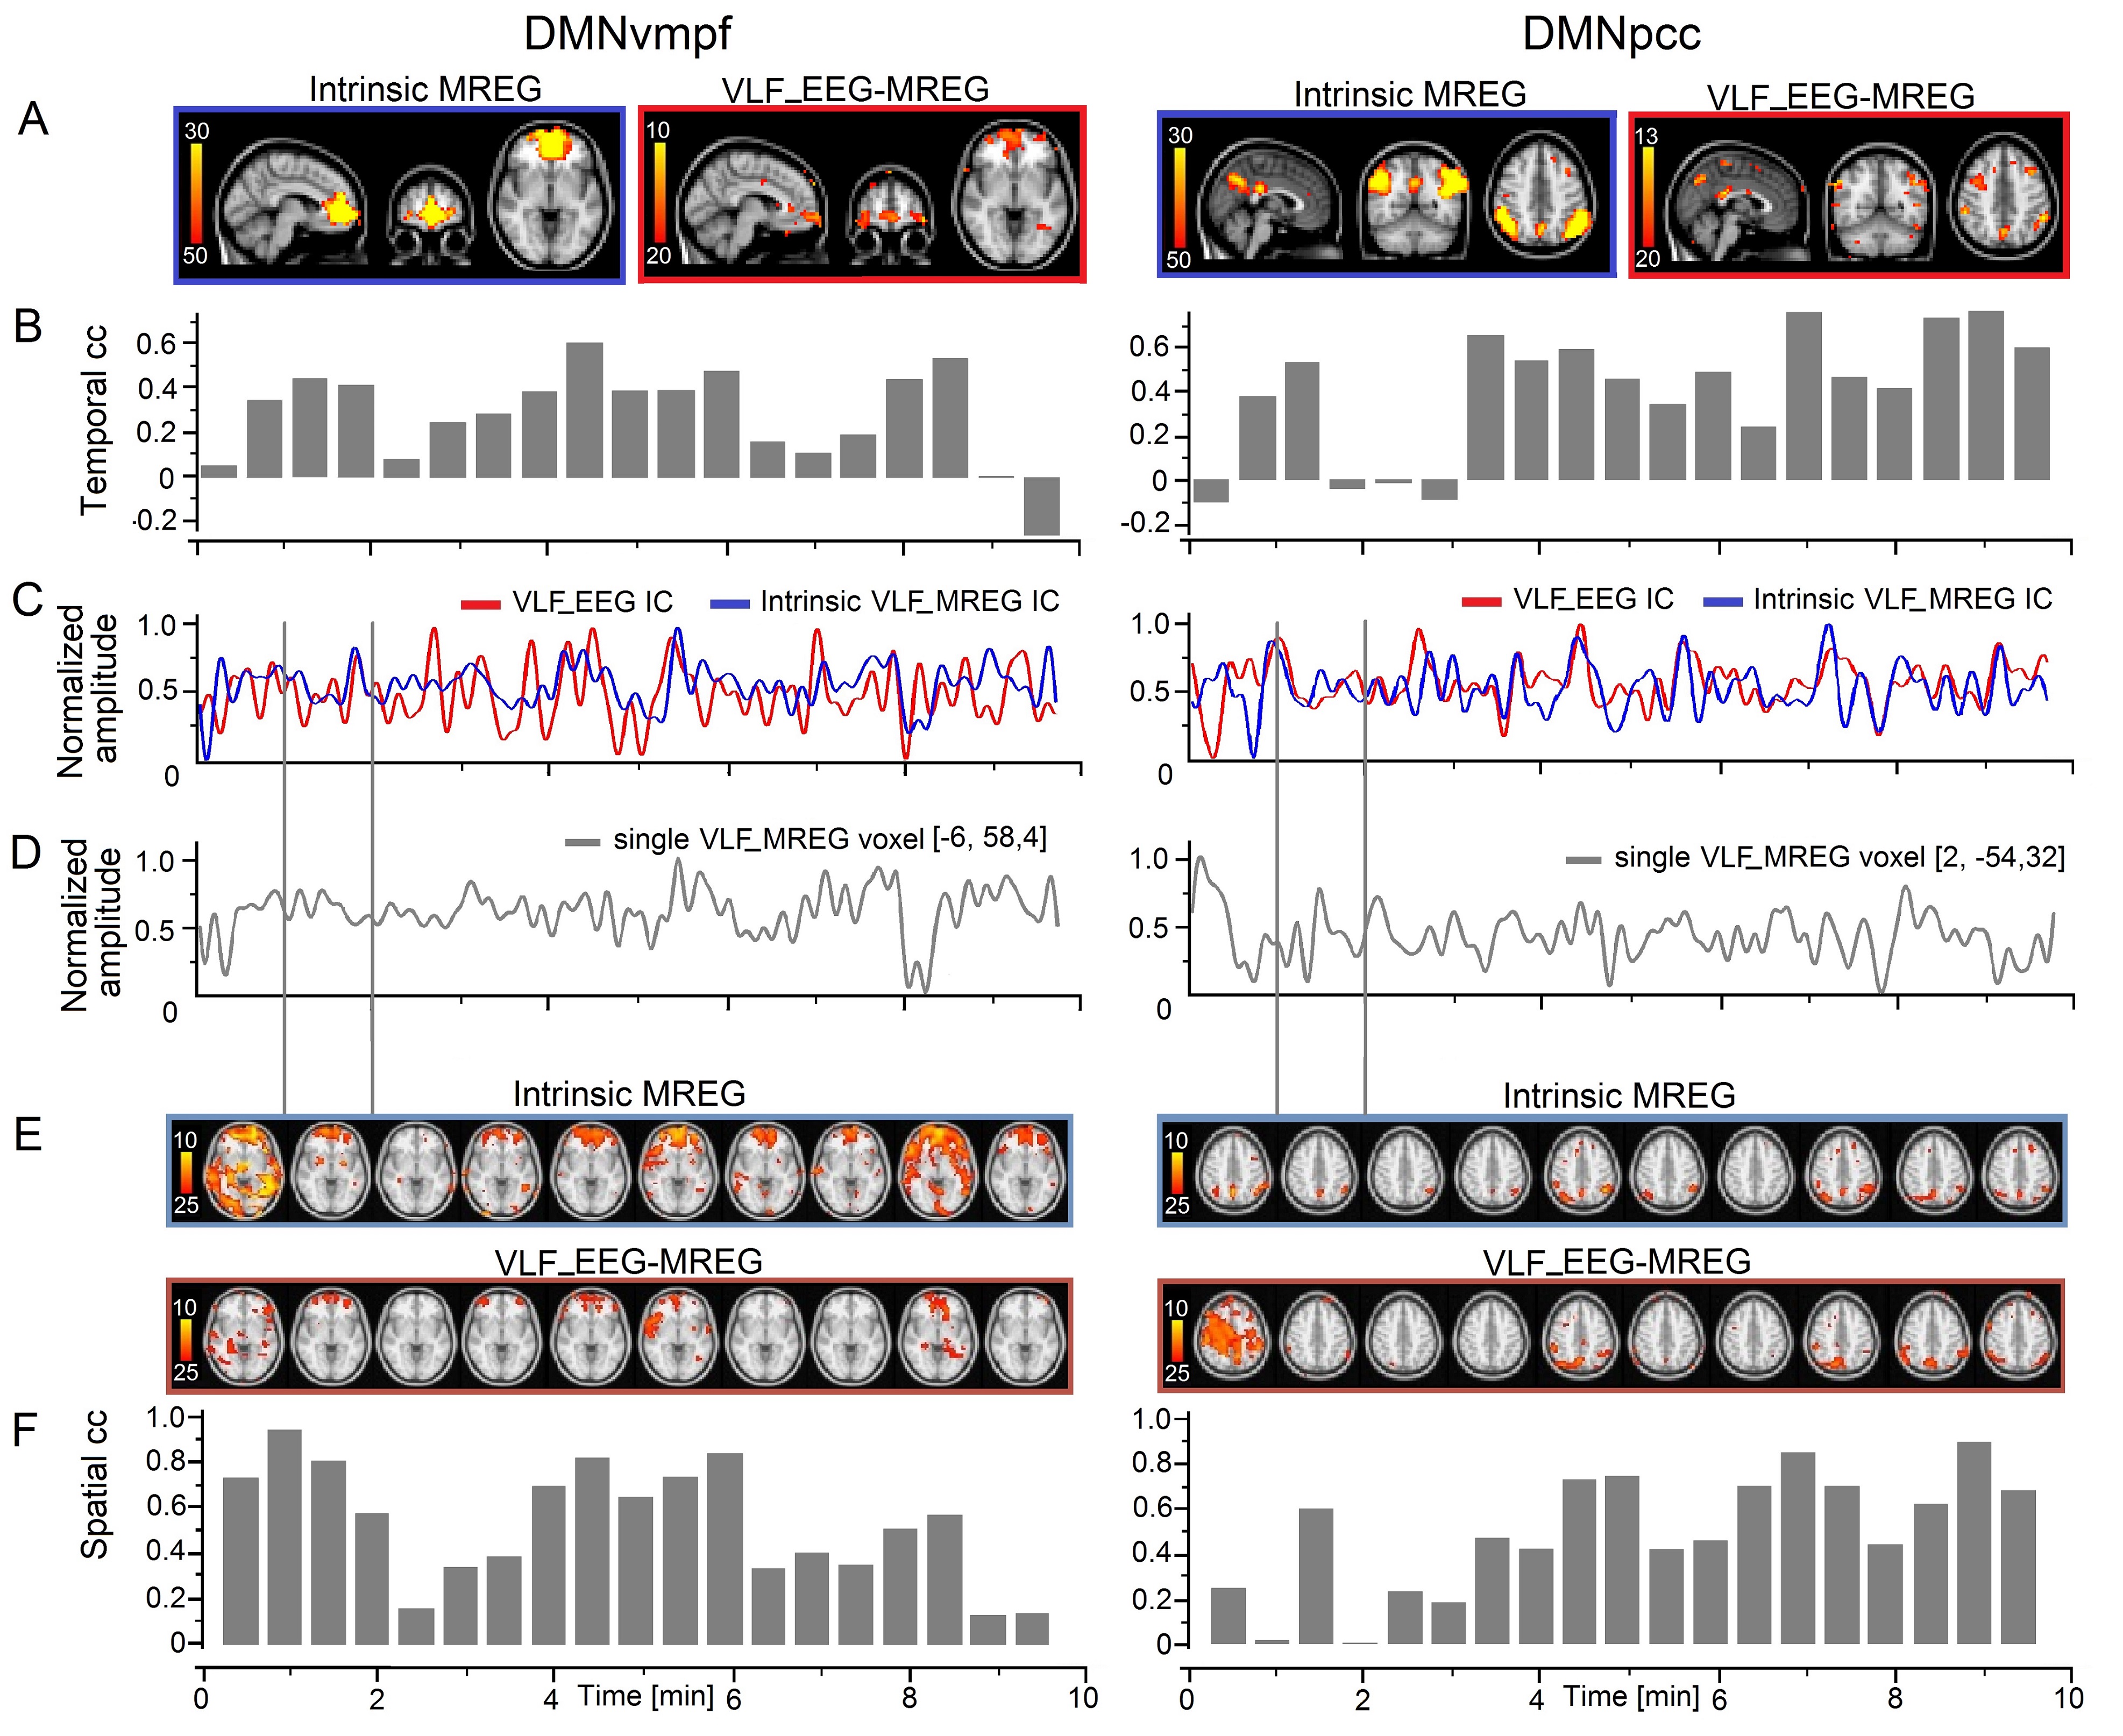
Simultaneous EEG-fMRI (functional magnetic resonance imaging) was measured from 16 subjects. FMRI was scanned with Siemens 3T SKYRA with a 32 channel head coil. We utilize magnetic resonance encephalography (MREG) sequence (TR = 100 msec, TE = 36 msec) obtained from Freiburg University.1, 2 3D MPRAGE images were used to register the MREG data into MNI-space. Resting state networks were separated using group probabilistic independent component analysis (ICA) as implemented in MELODIC3 with model order of 70. Subject-specific versions of spatial maps and associated time series were generated with dual-regression.4,5 The dominant DMNvmpf and DMNpcc components were selected for further analysis.6,7 EEG was recorded with BrainAmp system (Brain Products) using 32 Ag/AgCl electrodes (including electrocardiography). Sampling rate was 5 kHz, band pass from DC to 250 Hz and electrode impedances < 5 kΩ. EEG pre-processing steps included scanner and ballistocardiographic artifact correction with the AAS method8,9 in Brain Vision Analyzer (Brain Products), ICA calculation with EEGlab (Matlab) with maximum number of components (32), detrending and resampling to 10 Hz by getting an average of each of the 0.1-s periods to match the MREG sampling frequency. Individual EEG and MREG IC time courses were FFT band pass filtered to very low frequency (VLF) band (0.008-0.09 Hz) and normalized in OriginPro (Fig. 1C). VLF EEG ICs were used as regressors in FSL FEAT analysis to get individual VLF_EEG-MREG correlation maps. Temporal correlation coefficients between IC time courses were calculated in Matlab with Pearson correlation coefficients. The highest spatiotemporal correlation showing EEG IC was selected from each subject (Fig. 1A) and the temporal and spatial dynamics of correlations between VLF_EEG and MREG were studied in one-minute time windows (50% overlap). Temporal correlation coefficients were calculated between the selected EEG IC and dual regressed MREG IC (Fig. 1B). Also the spatial dynamics of the intrinsic MREG correlation maps and intermodal VLF_EEG-MREG correlation maps were studied by calculating correlations between these and MREG voxel time courses (Fig. 1D) with FSL fslcc tool. To see on group level where the intrinsic MREG maps show activations when the temporal correlation is highest and lowest, the corresponding correlation maps of these time windows were averaged among subjects and statistical significance between their differences was calculated with the randomize tool in FSL. Statistically significant dependency of the correlation strength and the MREG RSN ICs amplitude and root mean square (rms, supposed to reflect noise) (Matlab) as well as the number of active voxels within time window MREG RSN maps (fslmaths and fslstats tools in FSL) was calculated with one-tailed paired t-test.Results
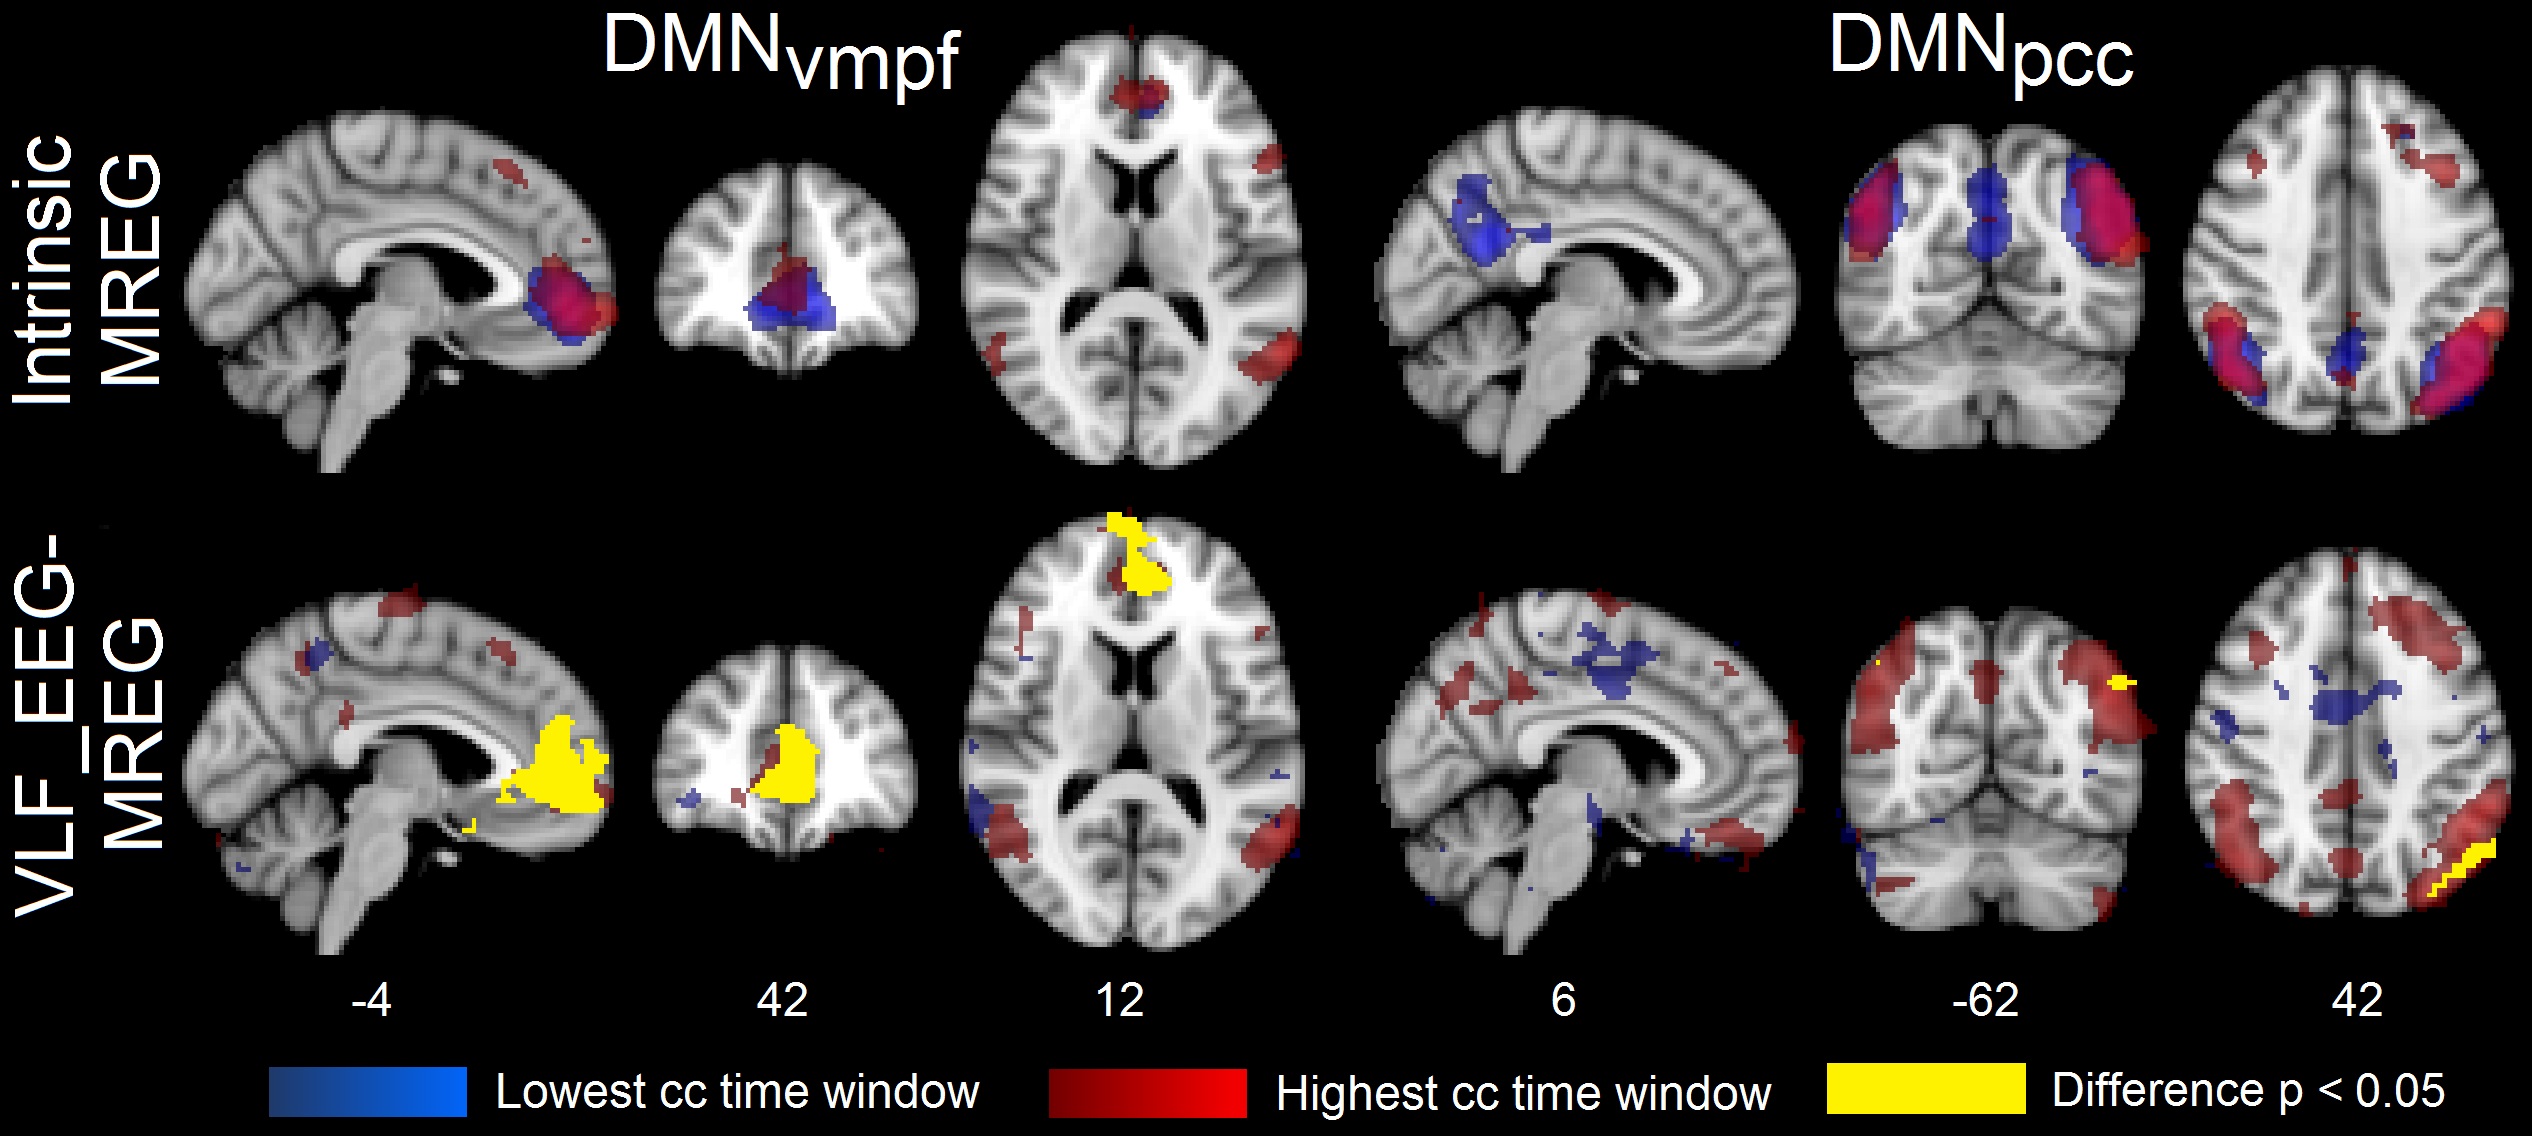
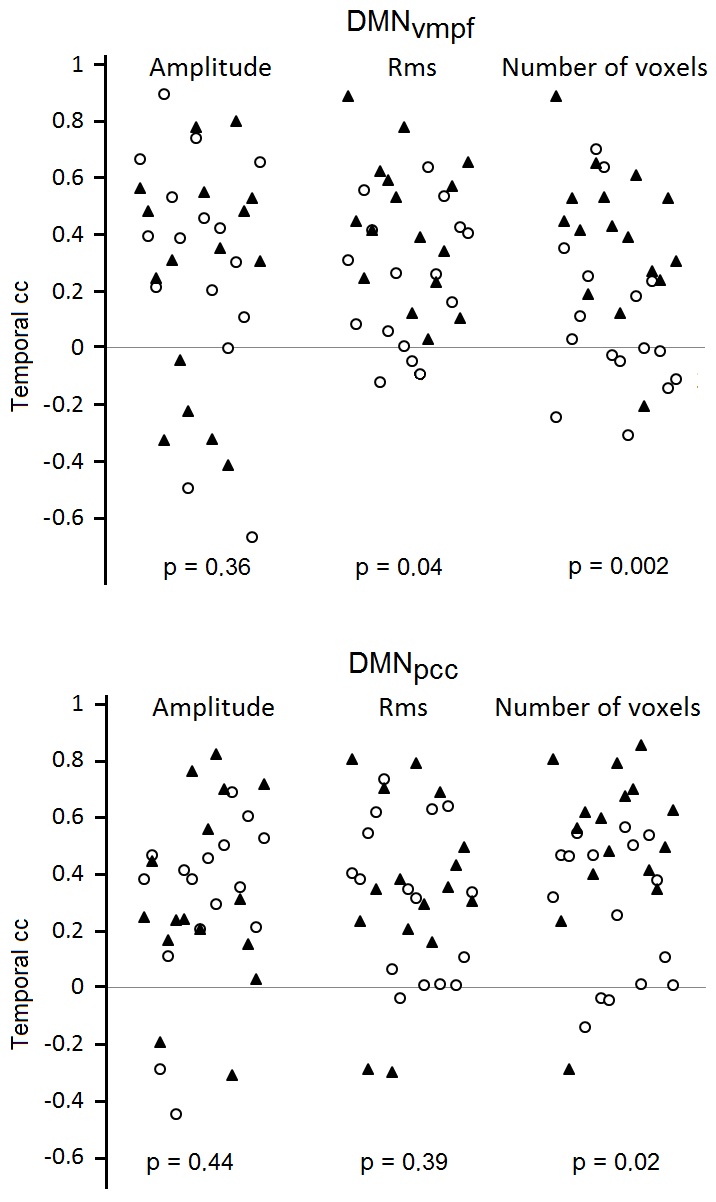
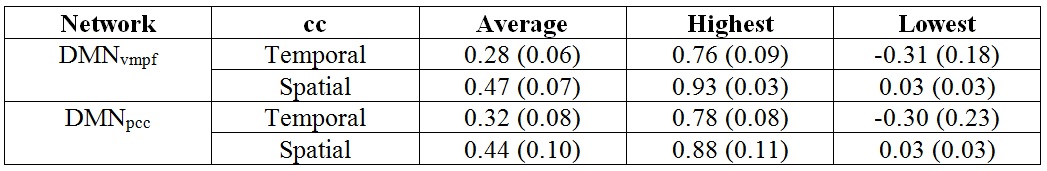
The spatial maps as well as spatial correlation coefficients between these maps revealed notable variation on single subject level (Fig. 1 E and F). Subject-wise averaged, highest and lowest temporal correlation coefficients are presented in Table 1. It shows the high variability in the averaged correlation coefficients between the highest and lowest correlating time windows resulting in average correlations of 0.3-0.4. Group level averaged maps of time windows that had highest and lowest correlation coefficient showed statistically significant differences in VLF_EEG-MREG correlation maps in DMNvmpf area and in cortical parts of DMNpcc (Fig. 2). The intrinsic MREG correlation maps did not reveal any statistically significant differences, but their spatial distribution indicates that correlation is strongest when the intrinsic RSN connectivity is strong and close to the pial brain surface (Fig. 2). Low intermodal correlations occurred when the intrinsic connectivity of the RSN was less coherent, in deeper structures or spread over wide areas VLF_EEG-MREG DMNpcc maps shows also an anti-correlating task-positive network activated when correlation to MREG is low. Temporal correlation coefficients were found to be stongest dependent of the number of activated voxels in RSN where a higher number of activated voxels relates to higher temporal correlation coefficient and vice versa (Fig. 3). The RSN amplitude or overall RSN noise characteristics did not explain the correlation dynamics between EEG and MREG BOLD.Conclusion
EEG ISFs are dynamically correlated to MREG BOLD signal due to intrinsic variability of the RSN source distributions and functional connectivity strength. The results indicate that the correlations between EEG and BOLD signal sources are low when averaged over a long period, but can reach high momentary synchrony due to intrinsic RSN dynamics.Acknowledgements
We gratefully acknowledge the Academy of Finland grants #111711 and #123772 and the Finnish Medical Foundation for their support of this work. The authors declare no competing financial interests.References
1. Zahneisen B, Hugger T, Lee KJ, LeVan P, Reisert M, Lee HL, Asslander J, Zaitsev M & Hennig J. Single shot concentric shells trajectories for ultra fast fMRI. Magn Reson Med 2012:68(2): 484-494.
2. Assländer J, Zahneisen B, Hugger T, Reisert M, Lee HL, LeVan P & Hennig J. Single shot whole brain imaging using spherical stack of spirals trajectories. Neuroimage 2013:73: 59-70.
3. Lin FH, Tsai KW, Chu YH, Witzel T, Nummenmaa A, Raij T, Ahveninen J, Kuo WJ & Belliveau JW. Ultrafast inverse imaging techniques for fMRI. Neuroimage 2012:62(2): 699-705.
4. Beckmann CF & Smith SM. Probabilistic independent component analysis for functional magnetic resonance imaging. IEEE Trans Med Imaging 2004:23(2): 137-152
5. Beckmann CF, Mackay CE, Filippini N, and Smith SM. Group comparison of resting-state FMRI data using multi-subject ICA and dual regression. Neuroimage 2009: 47(Suppl. 1):S148
6. Filippini N, MacIntosh BJ, Hough MG, Goodwin GM, Frisoni GB, Smith SM, Matthews PM, Beckmann CF & Mackay CE. Distinct patterns of brain activity in young carriers of the APOE-epsilon4 allele. Proc Natl Acad Sci U S A 2009:106(17): 7209-7214.
7. Abou-Elseoud A, Littow H, Remes J, Starck T, Nikkinen J, Nissila J, Timonen M, Tervonen O & Kiviniemi V. Group-ICA Model Order Highlights Patterns of Functional Brain Connectivity. Front Syst Neurosci 2011:5: 37.
8. Allen PJ, Polizzi GF, Krakow K, Fish DR, Lemieux L. Identification of EEG events in the MR scanner: the problem of pulse artifact and a method for its subtraction. NeuroImage 1998:8(3):229-39
9. Allen PJ, Josephs OF & Turner R. A method for removing imaging artifact from continuous EEG recorded during functional MRI. NeuroImage 2000:12(2):230-9
Figures