5392
Graph theoretical analysis of the modular organization of resting state functional connectivity in the rat1Center for Neuroscience and Cognitive Systems, Istituto Italiano di Tecnologia, Rovereto (TN), Italy
Synopsis
Modular organization of resting state functional connectivity has been demonstrated in human studies using graph theoretical approaches. Various methods, characterized by different resolutions, have enabled the investigation of the functional connectivity structure of the human brain at different scales. Here, we extend these approaches to the study of resting state connectivity in the rat, and demonstrate for the first time the existence of multi-scale, functionally segregated modules in this species.
Introduction
Graph theoretical methods have been widely applied to study the modular organization of functional connectivity networks in humans, demonstrating the existence of functionally segregated, mutually interacting sub-networks [1,2]. Alterations in the connectivity strength between modules have been observed in neuropsychiatric disorders [3] thus suggesting a potential role of this analysis for the study of the aetiology of these complex diseases. However, little is known about the modular organization of functional connectivity in rodents, often investigated as models of human brain disease. Here we applied different partitioning algorithms to investigate the modular structure of the rat brain at rest. We compared four different methods, characterized by different sensitivity to small modules, including Newman’s Modularity (with spectral or Louvain optimization), Infomap and Surprise, a recently proposed resolution-limit-free method [4].Methods
A group of n=20 Wistar rats was used for the resting state acquisition. Animals were anesthetized with isoflurane during preparation. Sedation was then maintained by continuous infusion of medetomidine, as described in [5]. Images were acquired with a 7T Bruker Pharmascan tomograph in a double coil configuration: a birdcage volume coil for transmission and a 4Ch helmet coil optimized for the rat brain for the detection of MR signals. The imaging protocol consisted of a high resolution T2w TSE (RARE, TR/TE 5500/76ms, MTX 256x256, RAREfactor 8, 25x1mm slices) used as anatomical reference for coregistration of functional images. Extended time-series of resting state functional images were acquired with a multishot GRE-EPI (TR/TE 2000/17ms, MTX 128x128, 8 shots, 20x1mm slices, 900 volumes) for a total acquisition time of about 45 minutes per subject. Datasets were processed with MATLAB and FSL. Preprocessing consisted of motion correction, regression of motion trace, regression of signal from cerebrospinal fluid and gray matter, in-plane gaussian smoothing, bandpass filtering of timeseries (0.01 – 0.5Hz) and ICA-based removal of susceptibility artifact and physiological fluctuation of the signal. Functional images were then coregistered to a rat brain template6 and parcellated in 72 regions for each brain hemisphere. For each subject, Fisher's R-to-Z transform of the Pearson's correlation coefficient of time-series was obtained. The resulting adjacency matrices were averaged at the group level and thresholded by percolation analysis to identify the optimal trade-off between sparsity and connectedness of the matrix. For community detection, four algorithms were applied: Newman's spectral modularity [7], Louvain optimization of Newman's modularity [7], Infomap [8] and Surprise [9]. Partitions were compared by Normalized Mutual Information.Results and Discussion
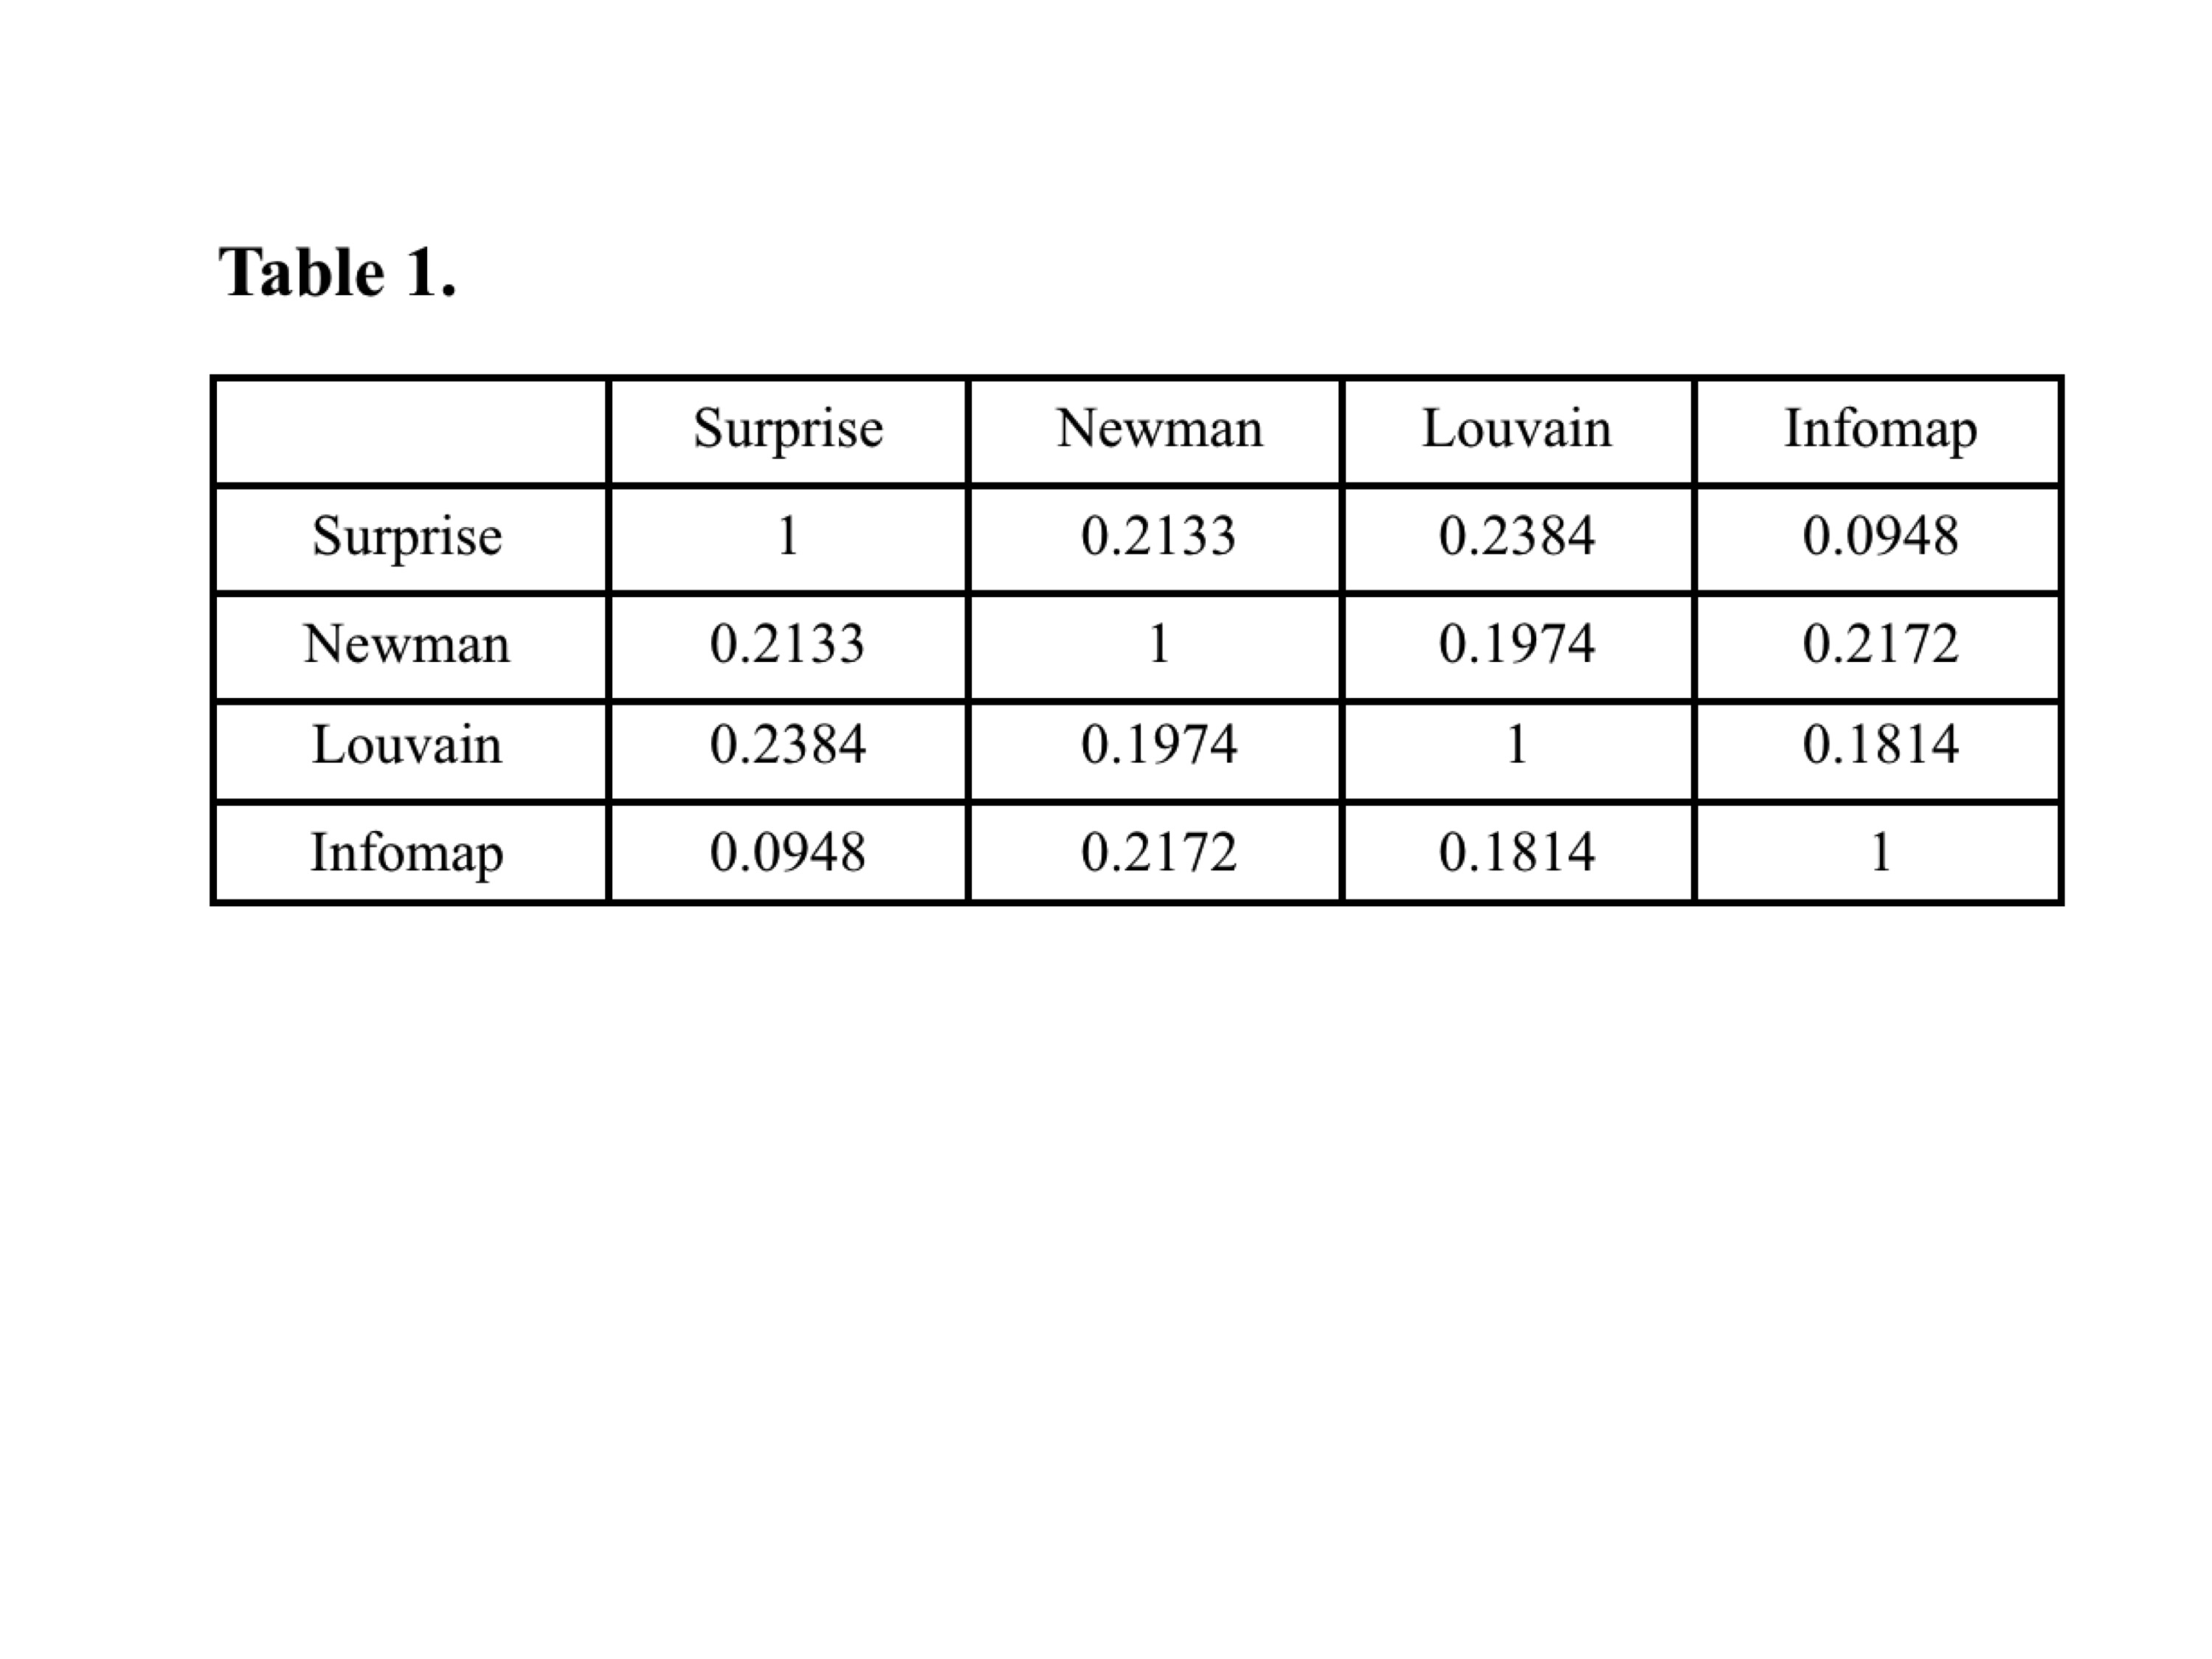
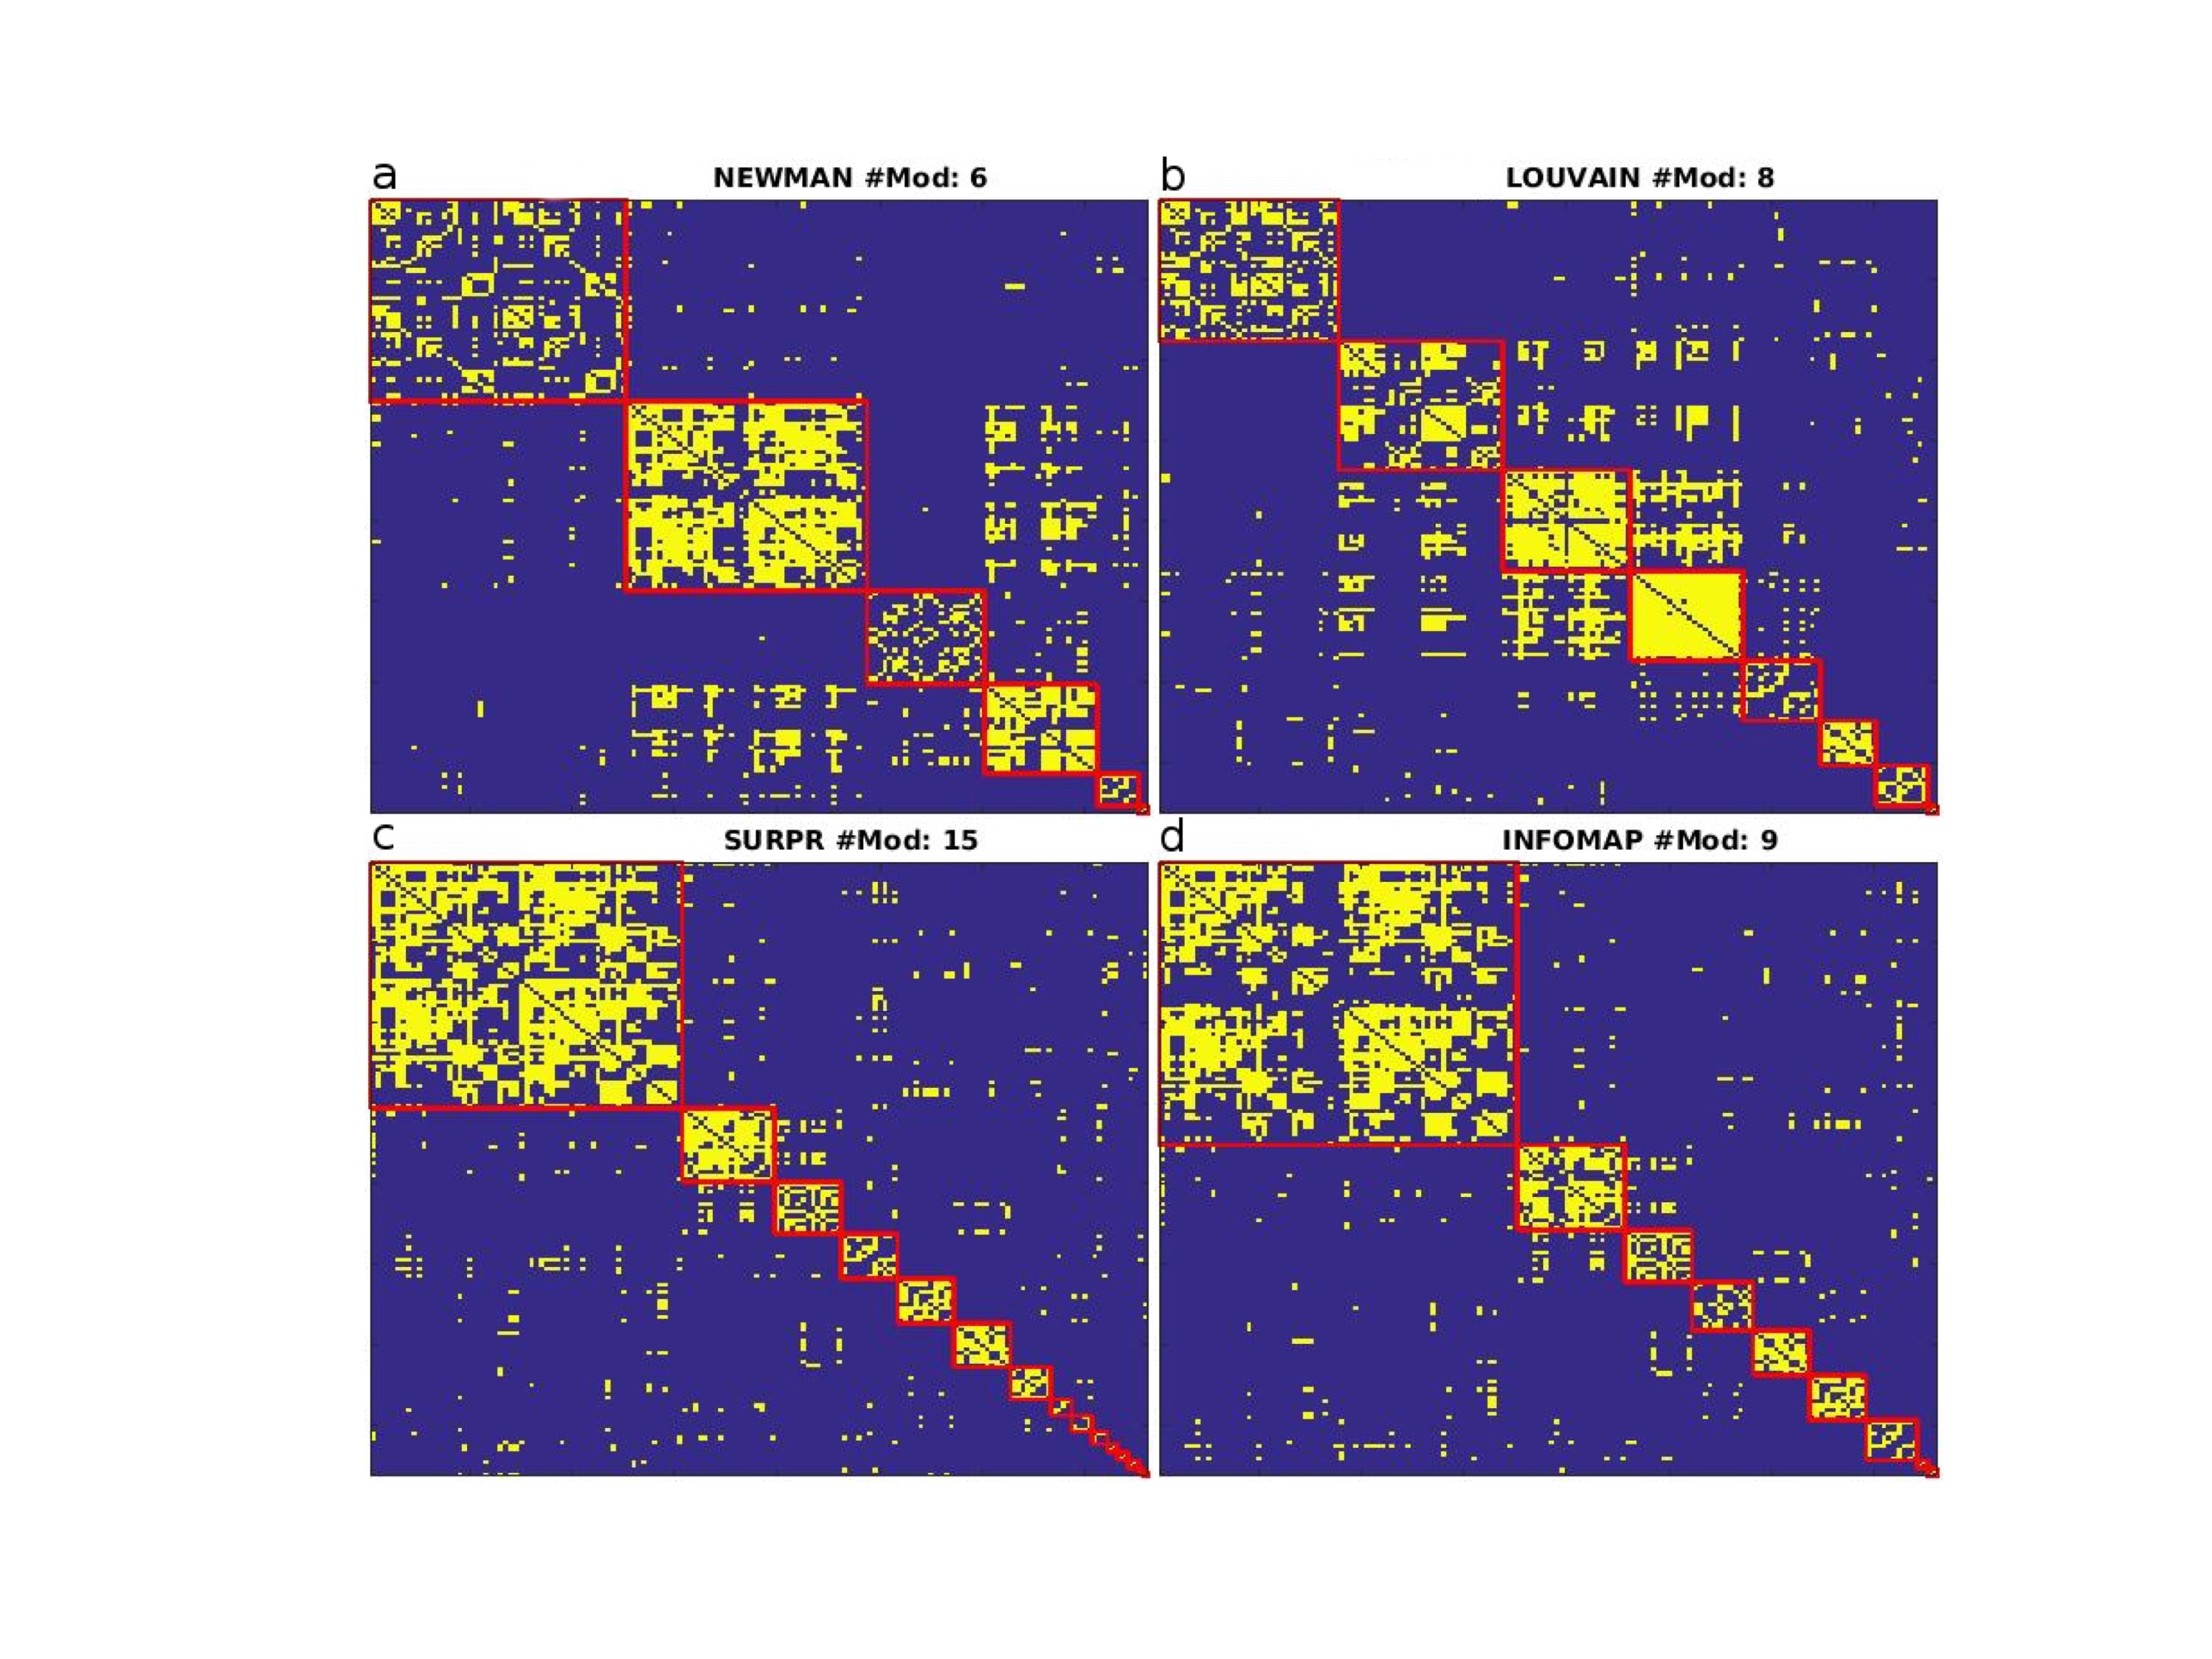
Figure 1 shows the modular structure retrieved by the four partition methods. Elements of the adjacency matrix were rearranged by their community memberships and are highlighted by a thick red line. Newman's decompositions – either by spectral (a) or Louvain (b) optimization – produce qualitatively different results compared to Surprise (c) and Infomap (d), as shown by the mutual NMI indices reported in Table 1. The modular structure identified by Newman’s Modularity was characterized by a few modules of comparable size, a result of the strong resolution limit and intrinsic scale of this method. Optimization of Surprise detected the largest number of communities with a broader distribution of modules' dimension, consistent with the idea that this method is nearly resolution-limit-free [4]. Infomap partition was very close to that of Surprise, with substantial correspondence of the largest modules. However, the tail of the distribution of modules retrieved by Infomap was thicker than for Surprise, an indication of the intrinsically lower sensitivity to small modules of this method.Conclusion
We have applied graph theoretical approaches to investigate the modular structure of brain functional connectivity in the rat. Four different methods, characterized by different resolutions, were compared. Infomap and Surprise, a recently proposed resolution-limit-free method, revealed a heterogeneous distribution of functional segregated modules, in keeping with similar observations in human studies.Acknowledgements
This project has received funding from the European Union’s Horizon 2020 research and innovation program under grant agreement No 668863.References
1. Eguluz, V., Chialvo, D., Cecchi, G., Baliki, M. & Apkarian, A. Scale-Free Brain Functional Networks. Phys. Rev. Lett. (2005)
2. De Luca, M., Beckmann, C. F., De Stefano, N., Matthews, P. M. & Smith, S. M. fMRI resting state networks define distinct modes of long-distance interactions in the human brain. Neuroimage (2006)
3. Chen, A. C. & Etkin, A. Hippocampal network connectivity and activation differentiates post-traumatic stress disorder from generalized anxiety disorder. Neuropsychopharmacology (2013)
4. Nicolini C, Bifone A., Modular structure of brain functional networks: breaking the resolution limit by Surprise. Sci Rep. 2016
5. Tambalo, S., Peruzzotti-Jametti, L., Rigolio, R., Fiorini, S., Bontempi, P., Mallucci, G., … Marzola, P. (2015). Functional Magnetic Resonance Imaging of Rats with Experimental Autoimmune Encephalomyelitis Reveals Brain Cortex Remodeling. J Neurosci (2015)
6. Schwarz AJ, Danckaert A, Reese T, Gozzi A, Paxinos G, Watson C, Merlo-Pich E, Bifone A, A stereotaxic MRI template set for the rat brain with tissue class distribution maps and co-registered anatomical atlas: Application to pharmacological MRI, NeuroImage (2006)
7. Meunier, D., Lambiotte, R. & Bullmore, E. T., Modular and hierarchically modular organization of brain networks. Front. Neurosci. (2010)
8. Rosvall, M. & Bergstrom, C. T. Maps of random walks on complex networks reveal community structure. Proc. Natl. Acad. Sci. USA. (2008)
9. Jiang, Y., Jia, C. & Yu, J. An efficient community detection algorithm using greedy surprise maximization. J. Phys. (2014)
Figures