5390
Topological Networks reorganization in two profile of High Potential Children: a resting state fMRI study.1Université Claude Bernard - Lyon 1, Lyon, France
Synopsis
High Potential Children diagnosis remains unclear. We proposed to examine 56 children with a resting state fMRI study. The profile of network topology was explored in two different groups of HP estimating the hub disruption index (k). A disruption of the order of importance of specific nodes in both the HP groups was found with a stronger reorganization in
Introduction
The term High Potential (HP) has been used to describe children with very high Intelligence Quotient (IQ>130) as measured by the Wechsler Intelligence Scale for Children (WISC-IV). HP children usually characterized by better abilities such as faster processing speed, visuo-spatial abilities, large memory, problem solving capacities and reasoning strategies. However, they may present different disabilities in reading, writing, movement coordination, attention and/or managing their emotions and relationships, and such cases, are referred to child psychiatric care. Based on these clinical observations, two HP profiles were defined: homogeneous HP profile (Hom-HP) with well-controlled behavior and successful curriculum and heterogeneous HP profile (Het-HP) with maladjustment and learning troubles based on their heterogeneity detected by a significant difference between verbal comprehension index (VCI) and perceptual reasoning index (PRI) values as well as standard levels in working memory index (WMI) and processing speed index (PSI) at the WISC-IV. To better understand the brain function differences between these two profiles of HP, we proposed a new graph-based approach to investigate resting-state fMRI (rs-fMRI) functional networks.Methods
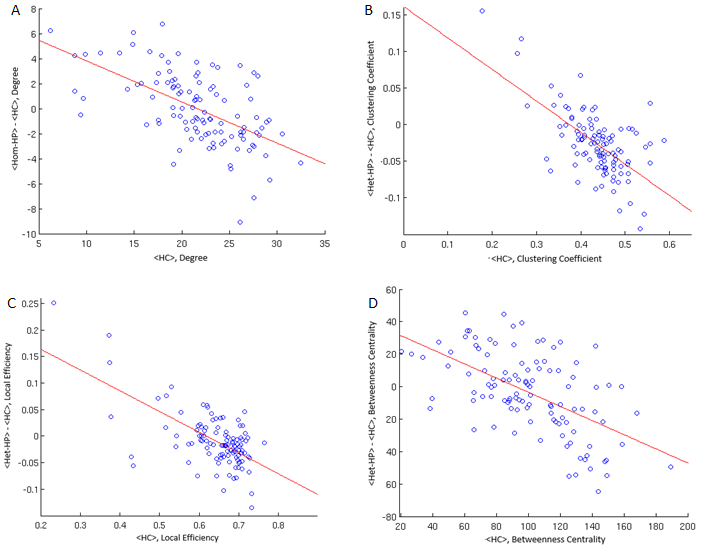
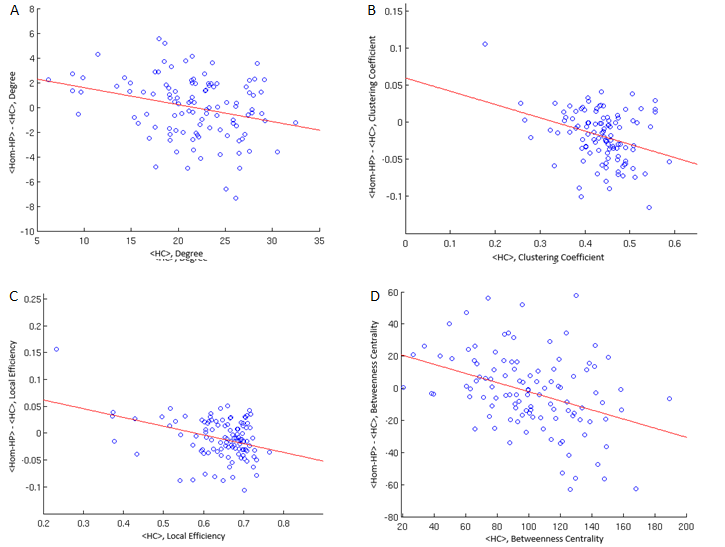
Forty-four HP children (24 Het-HP and 20 Hom-HP) and 14 healthy control (HC) subjects with age mean of 10.1 (± 1.2) years old were scanned using a 1.5T Siemens Sonata MRI system. A T1-weighted MPR was acquired with a resolution of 1 x 1 x 1 mm3 and fMRI data were recorded while subjects lay quietly at rest in the scanner for 10.3 min using an EPI sequence (250 scans, TR = 2.5 s, TE = 50 ms, voxel size = 3.4 x 3.4 x 3 mm3). The rs-fMRI data were preprocessed using SPM12 software and data artifacts for head motion were detected using ArtRepair. The scans affected by head motion bigger than 3 mm translation were removed. Two subjects were excluded at this stage because more than 12% of their scans were affected by head motion. Time series were extracted using Conn Toolbox from a total of 132 regions, encompassing brain cortical and subcortical areas of Harvard-Oxford Atlas and cerebellum areas. Connectivity matrices were computed using the wavelet approach proposed by Achard et 1 The following local metrics were then estimated using the Brain Connectivity Toolbox in MATLAB2: Degree (D), Clustering Coefficient (CC), Local Efficiency (LE) and Betweenness Centrality (BC). D represents the number of connections that link a node to the rest of the network; CC describes how the neighbors are connected to each other; LE characterizes the information exchange between node neighbors if this node is removed; BC quantifies the centrality of a node as a hub. Network topology differences in between HP children groups were evaluated using the hub disruption index (k) introduced by Achard et al.3. The hub disruption index is defined for each nodal metric (kD, kCC, kLE and kBC) as the slope of the linear regression model for each HP group compared to the control group. To test the statistical significance of the hub disruption index, we used a general linear model (GLM) test.Results
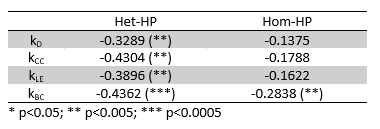
k values of each metric were measured in both Het-HP (Fig.1) and Hom-HP (Fig. 2) groups using GLM model including age and sex as cofactors. While there was no correlation with age nor sex, the hub disruption indices (kD, kCC, kLE and kBC), were significant in the Het-HP group in contrast to the Hom-HP group which was only significant for kBC (Table 1). Indeed, the kBC calculated for each patient was significantly different between the two HP and the control group (Fig. 3).Discussion
These results highlighted a disruption of the order of importance of specific nodes in both HP groups. Indeed, the negative slopes showed that the nodes with the highest value of hubness in control subjects are those with the greatest reduction in the HP subjects. Despite the same trend of k in both HP groups, a stronger reorganization occurred in Het-HP group for all k indices. This finding confirms that Het-HP children may present a more important topological reorganization than Hom-HP children compared to controls subjects.Conclusion
This study demonstrated the sensitivity of graph metrics based on rs-fMRI to characterize significant differences in functional brain network organization of HP children and particularly of Het-HP children which are more often associated with altered behavioral and learning troubles. This new technique may constitute a promising approach for a better characterization of HP brain function and disabilities.Acknowledgements
No acknowledgement found.References
1. Achard S, Salvador R et al. A Resilient, Low-Frequency, Small-World Human Brain Functional Network with Highly Connected Association Cortical Hubs. J Neurosci. 2006;26(1):63-72.
2. Rubinov M, Sporns O. Complex network measures of brain connectivity: Uses and interpretations. Neuroimage. 2010;52:1059–1069.
3. Achard S, Delon-Martin C et al. Hubs of brain functional networks are radically reorganized in comatose patients. PNAS. 2012;109(50):20608-20613.
Figures