5388
Stimulus-evoked fMRI activations are a subset of resting-state fMRI networks in the rat olfactory bulb1Radiology and Biomedical Imaging, Yale University, New Haven, CT, United States, 2Magnetic Resonance Research Center (MRRC), Yale University, New Haven, CT, United States, 3Quantitative Neuroscience with Magnetic Resonance (QNMR) Core Center, Yale University, New Haven, CT, United States, 4The John B. Pierce Laboratory, New Haven, CT, United States, 5Neurobiology, Yale University, New Haven, CT, United States, 6Biomedical Engineering, Yale University, New Haven, CT, United States
Synopsis
Are coordinated activations of the brain during sensory stimulation linked to the synchronized activations or “functional connectivity” observed with resting state fMRI? We recorded odor-stimulation fMRI and resting state fMRI in the rat olfactory bulb’s glomerular sheet. Glomerular activations due to three odors were compared to spontaneous fluctuations organized as twenty-two independent component networks. Networks correlated with activation in an odor-specific manner. We reconstructed approximations of activation which retained odor specificity for two of three odors, despite being constructed from resting state data. Our results suggest a function for synchronized resting oscillations in reinforcing stimulation-specific responses.
PURPOSE
Evidence exists that synchronized activations seen in task performance and sensory stimulation may be a subset of the synchronized activity seen at rest, organized as functional networks1. One well-studied type of stimulation, odor, activates the glomerular layer of the olfactory bulb in reproducible, odor-specific patterns2. Comparing these patterns to resting state activity in the olfactory bulb could provide a tool to study the underlying functions of resting state networks. Such studies have, however, been prevented by technical limitations due to the small size of the olfactory bulb, and the necessity of sufficient temporal resolution for resting state analysis.METHODS
Imaging was performed using a 9.4T small-bore Bruker Biospec system. High temporal resolution EPI of the rat olfactory bulb was acquired for freely-breathing Sprague-Dawley rats (n=6) anesthetized with urethane (1.3g/kg B.W) while exposed to odor (25.6x12.8mm FOV, 64x32 matrix, 8 slices, 1s TR, 13ms TE, 30s baseline/60s stimulation/30s baseline). The odors tested were isoamyl acetate (IAA), methyl valerate (MV) and ethyl butyrate (EB). All of these molecules are esters with fruit-like odors. An improved signal-to-noise ratio was made possible through second-order spherical harmonics shimming3.
Similar parameters were used to collect resting state fMRI data, except that to prevent signal loss over long scans, a reference image was collected for every scan producing an effective TR of 2s and allowing scans of 500s in length. Anatomical images were collected last.
Data were pre-processed using standard methods: motion correction, slice-timing correction, registration to an anatomical template and blurring. Images in 3D space were converted to “flatmaps” of the glomerular sheet of the olfactory bulb using a simplified version of prior algorithms4.
RESULTS
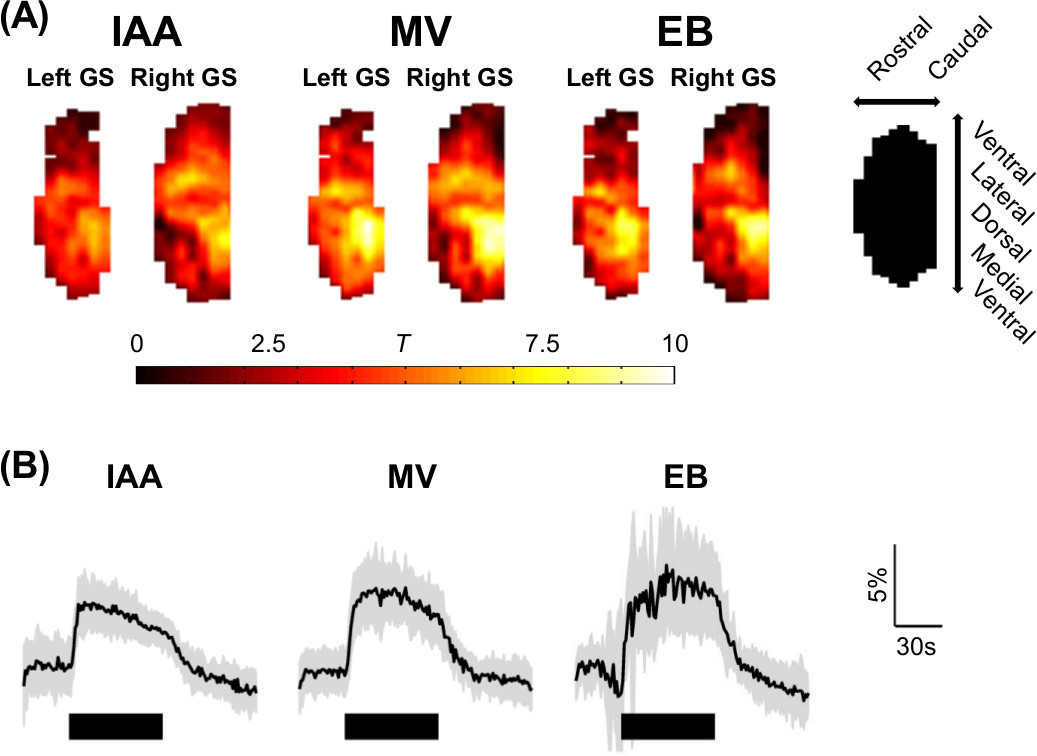
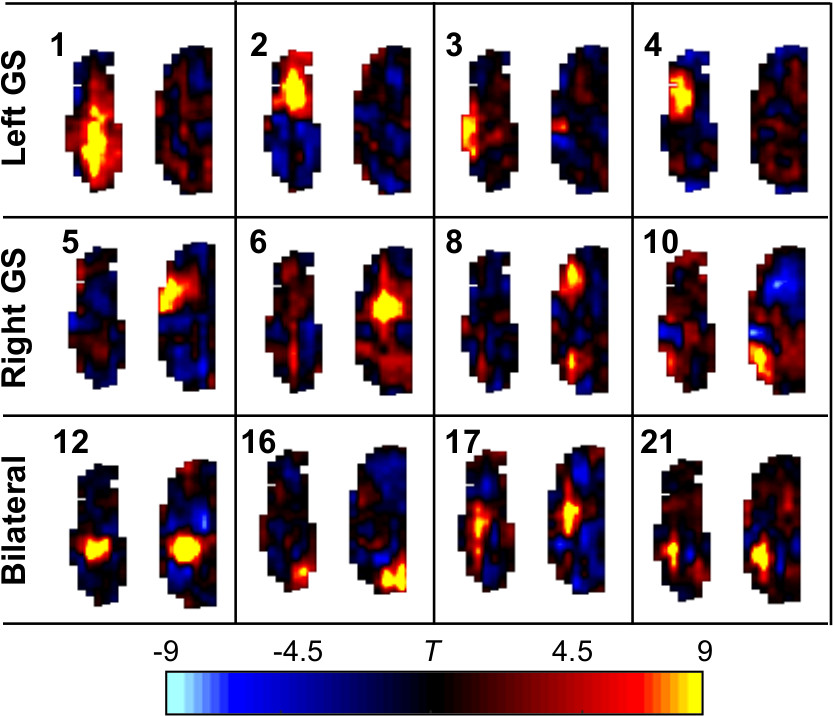
Odor-specific activation in the glomerular sheet was observed (T-test between all baseline and activation periods, one-tailed, equal variance, 4s hemodynamic shift) (Figure 1A), appearing similar to previous studies which used slower temporal resolution5. The high temporal resolution allowed visualization of time traces of activation (Figure 1B). Independent component analysis6 was performed on resting state data, generating 22 networks in the olfactory bulb. Both unilateral and bilateral networks appeared (Figure 2).
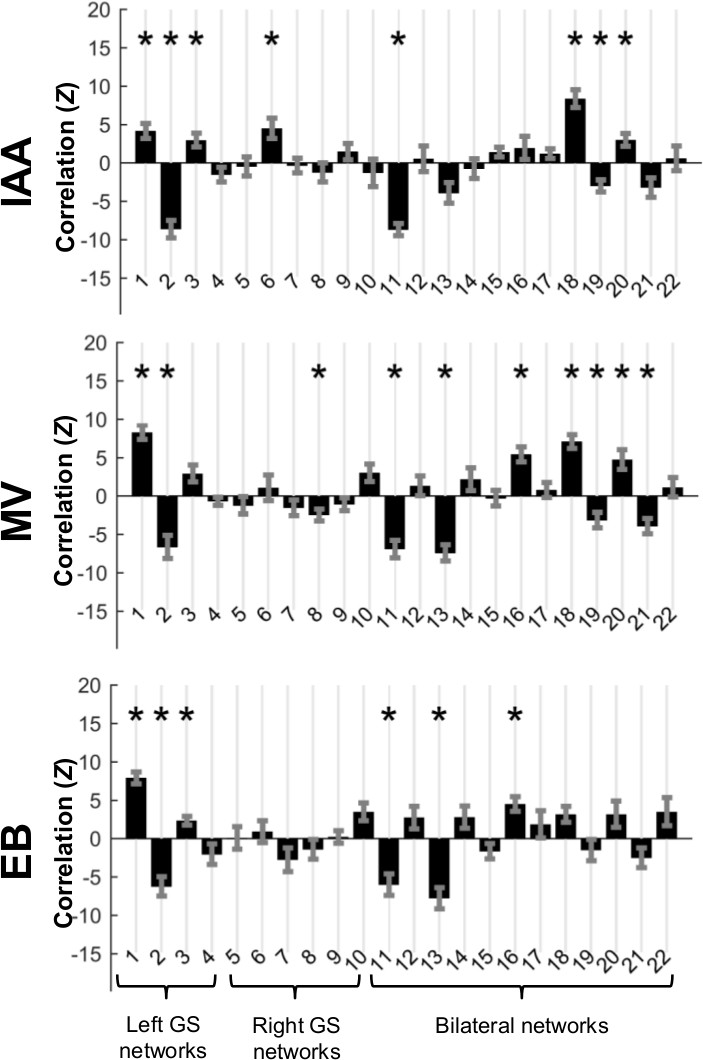
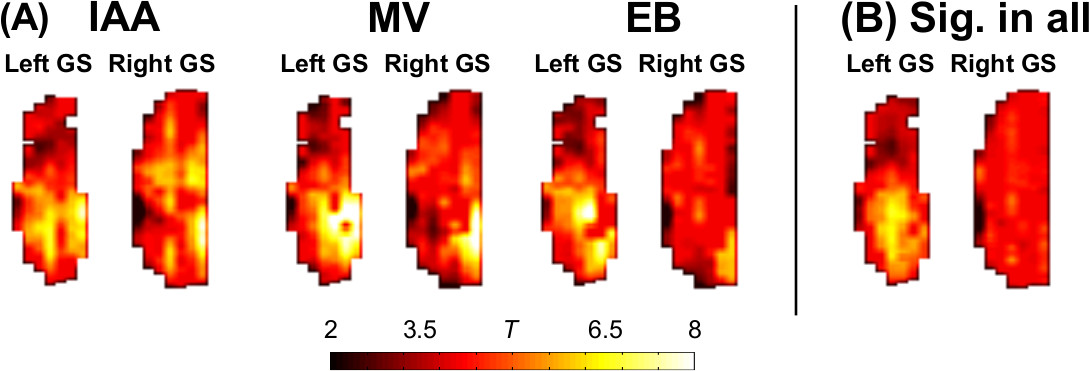
Similarly to previous work in the human brain which compared resting state networks to key features of activation maps1, here independent components were correlated with odor activation maps. Significant (p ≤ 0.05 multiple comparison corrected) correlations (Figure 3) existed which differed between odors. Significant correlations were used as weights for independent components to build simulated maps of odor activation based on resting state data (Figure 4A). In addition, a map of significant components in all odors was constructed (Figure 4B). Two of the three odor reconstructions (IAA, MV) correlated significantly with the actual odor’s activation versus other odors, and the “all odors” reconstruction correlated similarly across different odors, but more strongly in the left bulb than the right bulb.
DISCUSSION
The glomerular sheet of the rat olfactory bulb provides an excellent model to study whether synchronized activation is linked to the spontaneous synchronizations seen at rest because odor stimulation produces highly reproducible, odor-specific, maps of activation2,4,5 and resting state activity has been observed within it7. However, investigations into the olfactory bulb’s resting state have been limited by the small size of the bulb combined with resting state analysis’ requirement of sufficient temporal resolution. Using novel shimming and recording methods, we were able to acquire high temporal resolution odor stimulation and resting state data to address this question.
Our work indicates that stimulus-evoked fMRI activations are a subset of resting-state fMRI networks in the rat olfactory bulb. Multiple resting state networks significantly correlated with every odor’s activation map, and these networks could be combined to create approximations of the activation maps that showed odor specificity.
CONCLUSION
While present results are only correlative, it has been suggested that rehearsal at rest in the olfactory bulb may provide a mechanism for reinforcing the neural plasticity that creates the synchronized, odor-specific responses8. If this is true, our work provides evidence for this role of resting state functional connectivity in an isolated sensory system. If olfaction is a model for higher brain functions, the similarity observed between more complex tasks and sensation in humans1 may indicate a function for resting state functional networks.Acknowledgements
The authors would like to thank Bei Wang for help in animal preparation. Supported by NIH grants R01 DC-011286, R01 MH-067528 and P30 NS-052519, and a fellowship supporting GJT from NIH 2T32DA022975-06A1.References
1. Smith SM, Fox PT, Miller KL, et al. Correspondence of the brain's functional architecture during activation and rest. Proc Natl Acad Sci U S A 2009;106(31):13040-13045.
2. Xu F, Kida I, Hyder F, Shulman RG. Assessment and discrimination of odor stimuli in rat olfactory bulb by dynamic functional MRI. Proc Natl Acad Sci U S A 2000;97(19):10601-10606.
3. Shu CY, Herman P, Coman D, et al. Brain region and activity-dependent properties of M for calibrated fMRI. Neuroimage 2016;125:848-856.
4. Liu N, Xu FQ, Marenco L, Hyder F, Miller P, Shepherd GM. Informatics approaches to functional MRI odor mapping of the rodent olfactory bulb - OdorMapBuilder and OdorMapDB. Neuroinformatics 2004;2(1):3-18.
5. Schafer JR, Kida I, Rothman DL, Hyder F, Xu F. Adaptation in the rodent olfactory bulb measured by fMRI. Magn Reson Med 2005;54(2):443-448.
6. Calhoun VD, Adali T, Pearlson GD, Pekar JJ. Spatial and temporal independent component analysis of functional MRI data containing a pair of task-related waveforms. Hum Brain Mapp 2001;13(1):43-53.
7. Nasiriavanaki M, Xia J, Wan H, Bauer AQ, Culver JP, Wang LV. High-resolution photoacoustic tomography of resting-state functional connectivity in the mouse brain. Proc Natl Acad Sci U S A 2014;111(1):21-26.
8. Galan RF, Weidert M, Menzel R, Herz AV, Galizia CG. Sensory memory for odors is encoded in spontaneous correlated activity between olfactory glomeruli. Neural Comput 2006;18(1):10-25.
Figures