5384
Dynamic Functional Connectivity within the Default Mode Network is associated with the Complexity of its Network Nodes1Laboratory of FMRI Technology (LOFT), USC Stevens Neuroimaging and Informatics Institute, Keck School of Medicine of USC, University of Southern California, Los Angeles, CA, United States
Synopsis
While dynamic functional connectivity (dynFC) provides an estimate of the information transfer between brain network nodes, the signal dynamics at each node represents the local information processing. Here we assessed the relation between dynFC within the default mode network and the complexity/regularity of fMRI signal of network nodes. We found that a more complex and thus less predictable signal in a node allows for a more dynamic connectivity and hence a richer repertoire of different FC states.
Purpose
Recent research shows that there is considerable variability and reconfiguration of functional networks across both spatial and temporal scales, and there are dynamic changes of FC (dynFC) on the order of seconds to minutes. The dynamic changes of FC can be related to theories on neural complexity and brain’s information processing 1. Recently, we and others have explored the use of Multi-Scale Entropy (MSE) to quantify the complexity or regularity of regional rs-fMRI signals. In the presented study we aimed to investigate the relation between local signal complexity (MSE) and the static (FC) and dynamic changes in functional connectivity (dynFC) within the Default Mode Network (DMN). We hypothesize that nodes with higher MSE exhibit more dynamic interactions with other nodes, which in turn reduces the static FC between these nodes.Methods
We analyzed 31 subjects from the HCP database 2. Data were acquired at 3T with TR/TE = 720/33ms, multiband-factor 8, FA = 52°, gradient-echo EPI readout and 2mm isotropic resolution 3. Datasets were preprocessed according to HCP minimal preprocessing pipeline 4.
Six nodes of the DMN were defined from a template-DMN 5: ACC/mPFC, PCC, left & right IPL and left & right hippocampus. First, we computed static FC between all nodes using conventional Pearson correlation. Second, using a sliding window approach (window-length 20TRs) the dynamic changes in interregional FC was computed. MSE was calculated using sample-entropy for 40 coarse-sampled temporal scales (pattern length m=2, matching threshold r=0.3) 6. This allowed comparing FC and dynFC to signal complexity at different temporal frequencies. To test for potential relations between the local signal dynamics (MSE) and network coherence (FC and dynFC) we (i) correlated the overall network FC with overall network MSE across scales to identify a global association between network connectivity and network complexity; (ii) correlated MSE to the average static FC of each node as well as the variance of dynFC at each node, respectively to identify the frequency range where MSE correlates to nodal connectivity; and (iii) calculated the correlation between meanMSE of each node and node-to-node variance of dynFC to evaluate if there is uni- or bidirectional relation between the dynamic changes in FC between two nodes and their respective MSE.
Results
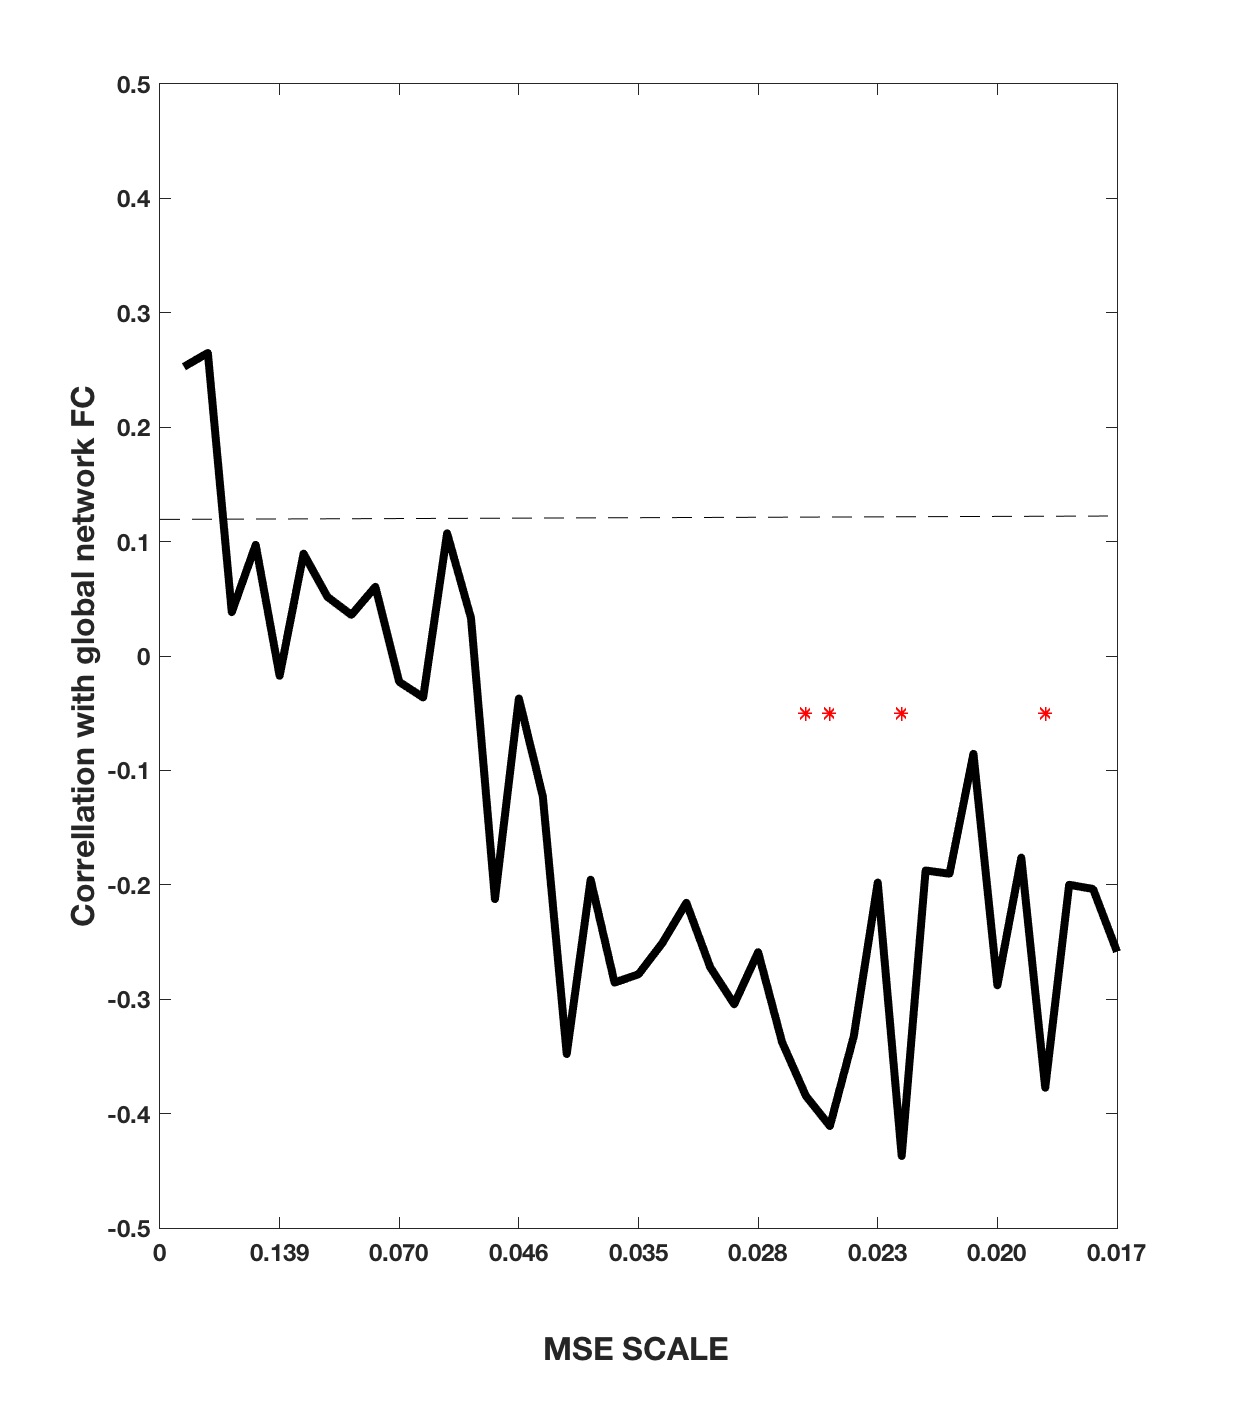
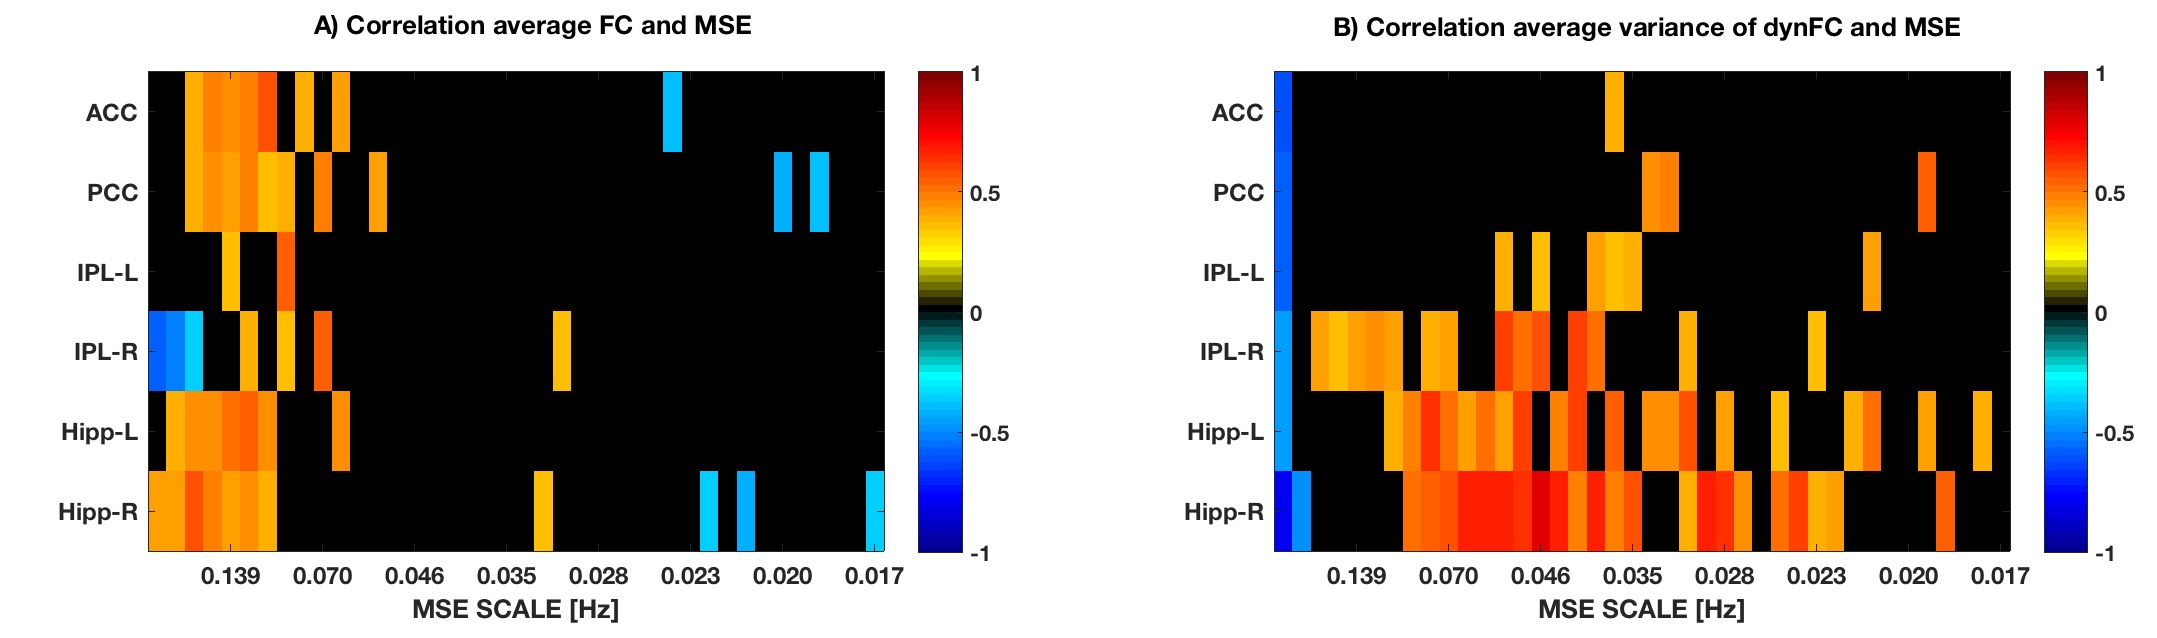
On the network level, we found that the overall static network FC of the DMN is inversely related to the overall network MSE of all DMN nodes at lower temporal frequencies (0.019-0.025Hz) across subjects (Figure1). A more detailed analysis of this relationship at each network node revealed that the static FC of a network node is positively correlated to its regional signal complexity at higher frequencies (Figure2A). Furthermore, the variance of dynFC (Figure2B) was positively associated with MSE over a wide range of frequency scales in peripheral network nodes (IPL and Hipp), while not strongly related to MSE in the core hub areas (PCC & ACC). Finally, the variance of node-to-node dynFC was observed to be positively related to the meanMSE of regional fMRI signals at the node (Figure3).Discussion and Conclusion
We found relations between network connectivity and signal complexity of network nodes of the DMN. 1) The overall static FC of the network was negatively related to overall network MSE at low temporal frequencies, while at individual network node level the static FC is positively correlated to its regional signal complexity at higher frequencies. This finding is consistent with the theory that higher-frequency oscillations originate from smaller local neuronal populations, whereas low-frequency oscillations encompass larger long-range neuronal populations. 2) The variance of dynamic changes in FC across time showed a positive correlation to MSE over a wide range of frequencies mainly in peripheral network nodes. We hypothesize, that while the connectivity between the ACC and PCC forms the backbone of the DMN, there are considerable variations and potential reconfiguration of peripheral nodes such as IPL and Hipp. Accordingly, complex and thus less predictable signals in network nodes, allow for a more dynamic network reconfiguration and explorations of different FC states 7. Our study suggests that by taking into account nodal signal complexity one can gain further insight into the mechanisms and dynamic organization of brain networks. Future work will investigate this relationship in whole brain networks as well as its alterations in pathological states.Acknowledgements
Data were provided by the Human Connectome Project, WU-Minn Consortium (Principal Investigators: David Van Essen and Kamil Ugurbil; 1U54MH091657) funded by the 16 NIH Institutes and Centers that support the NIH Blueprint for Neuroscience Research; and by the McDonnell Center for Systems Neuroscience at Washington University. The data release of 40 unrelated adult subjects was used in the present study.References
[1] McDonough IM & Nashiro K, Front Hum Neurosci. 2014; 8:409 [2] VanEssen DC et al. NeuroImage 2013; 80:62-79 [3] Smith SM et al. Neuroimage 2013; 80:144-68 [4] Glasser MF et al. Neuroimage 2013; 80:105–124 [5] Shirer et al. Cereb Cortex 2012; 22(1):158-65 [6] Smith RX et al. Brain Imaging Behav. 2014; 8(2):284-91 [7] Yang, AC et al. Neurobiol Aging. 2013; 34(2):428-38.Figures